A candlestick chart for Flutter with 31 indicators and 29 drawing tools, and 39
other chart widgets: the order book and the tape, the charts a backtest report
is built from, and the ones a dashboard is. Everything is rendered with
CustomPainter — no WebView and no JavaScript bridge.
Each image links to the documentation page for that feature.
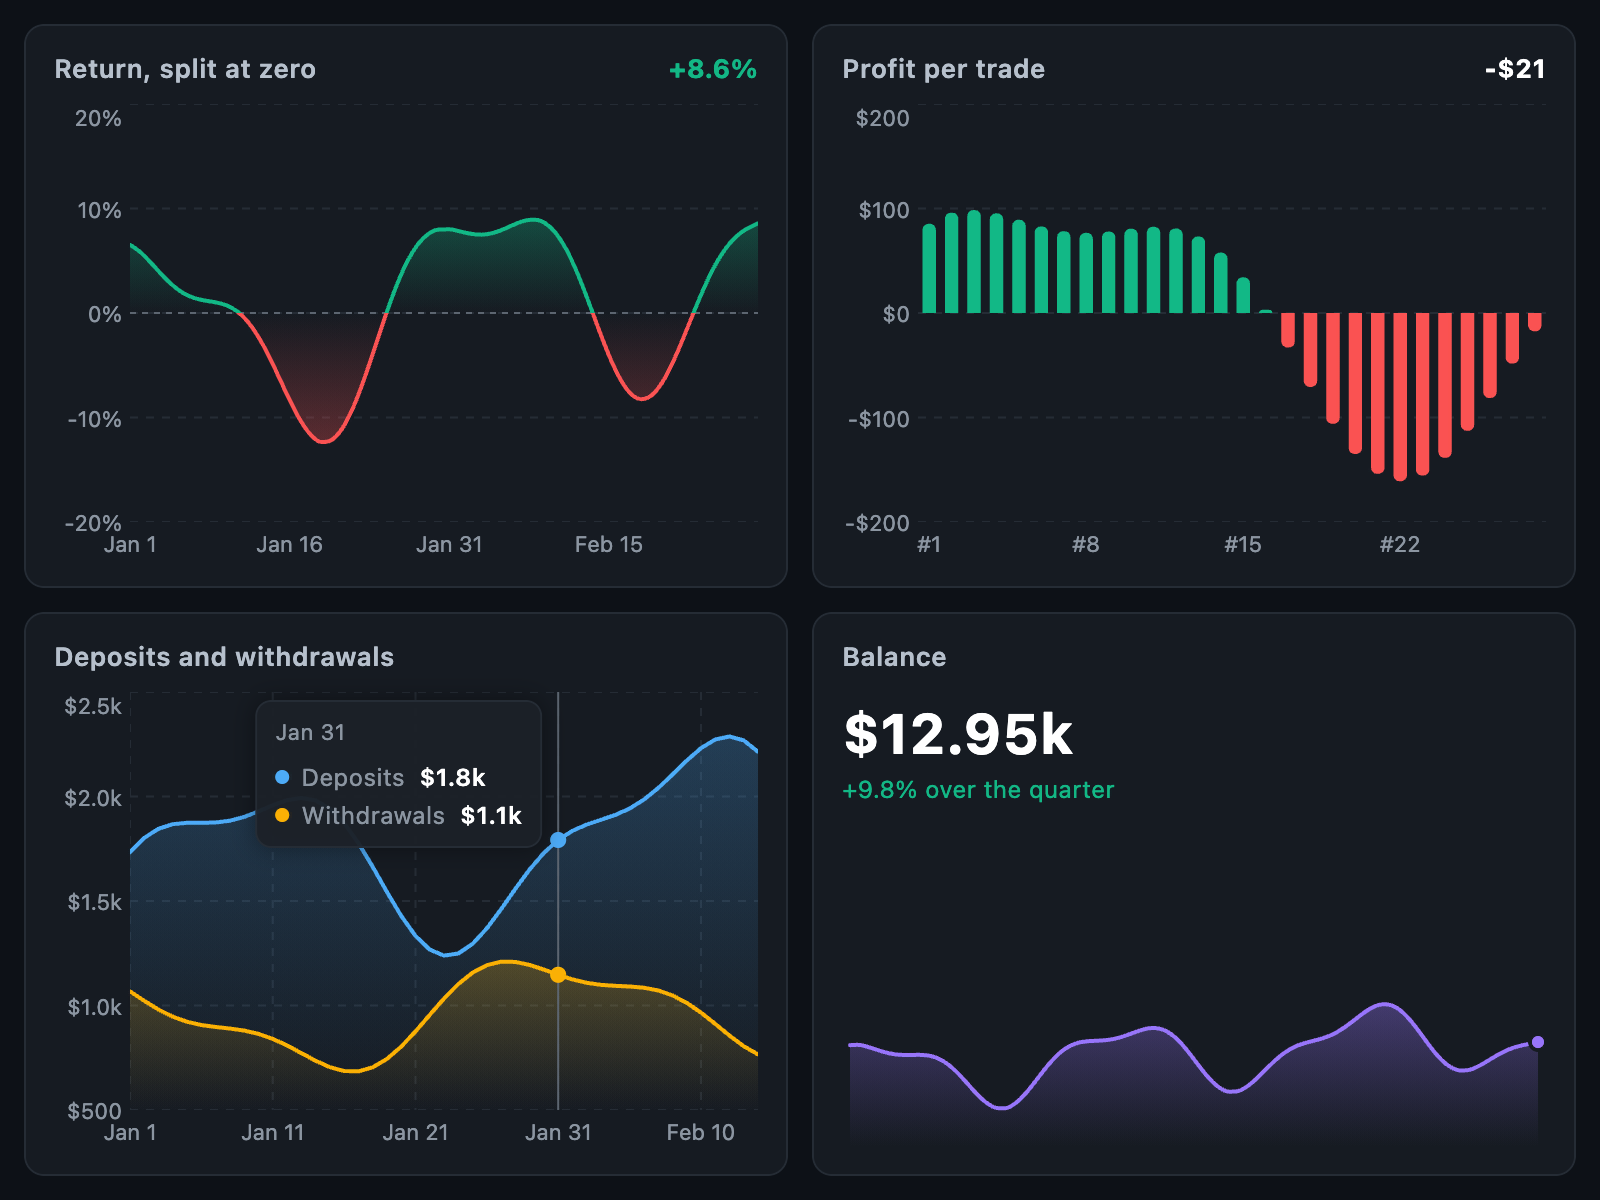 Four business charts Returns split at zero, profit bars, cash flows with a tooltip, and a sparkline. |
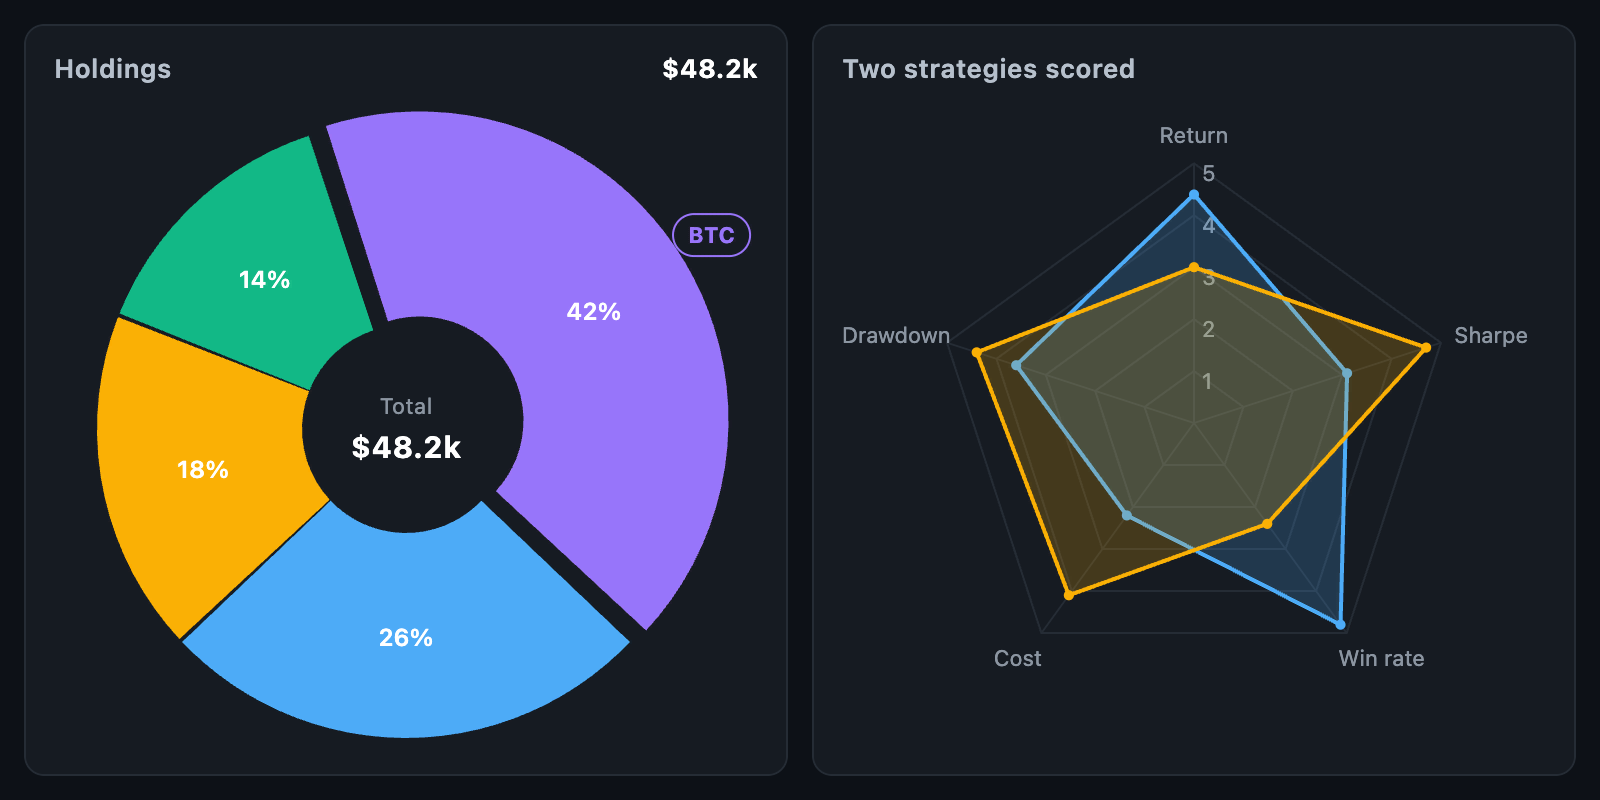 Pie and radar A doughnut with its total in the centre, and a radar comparing two strategies. |
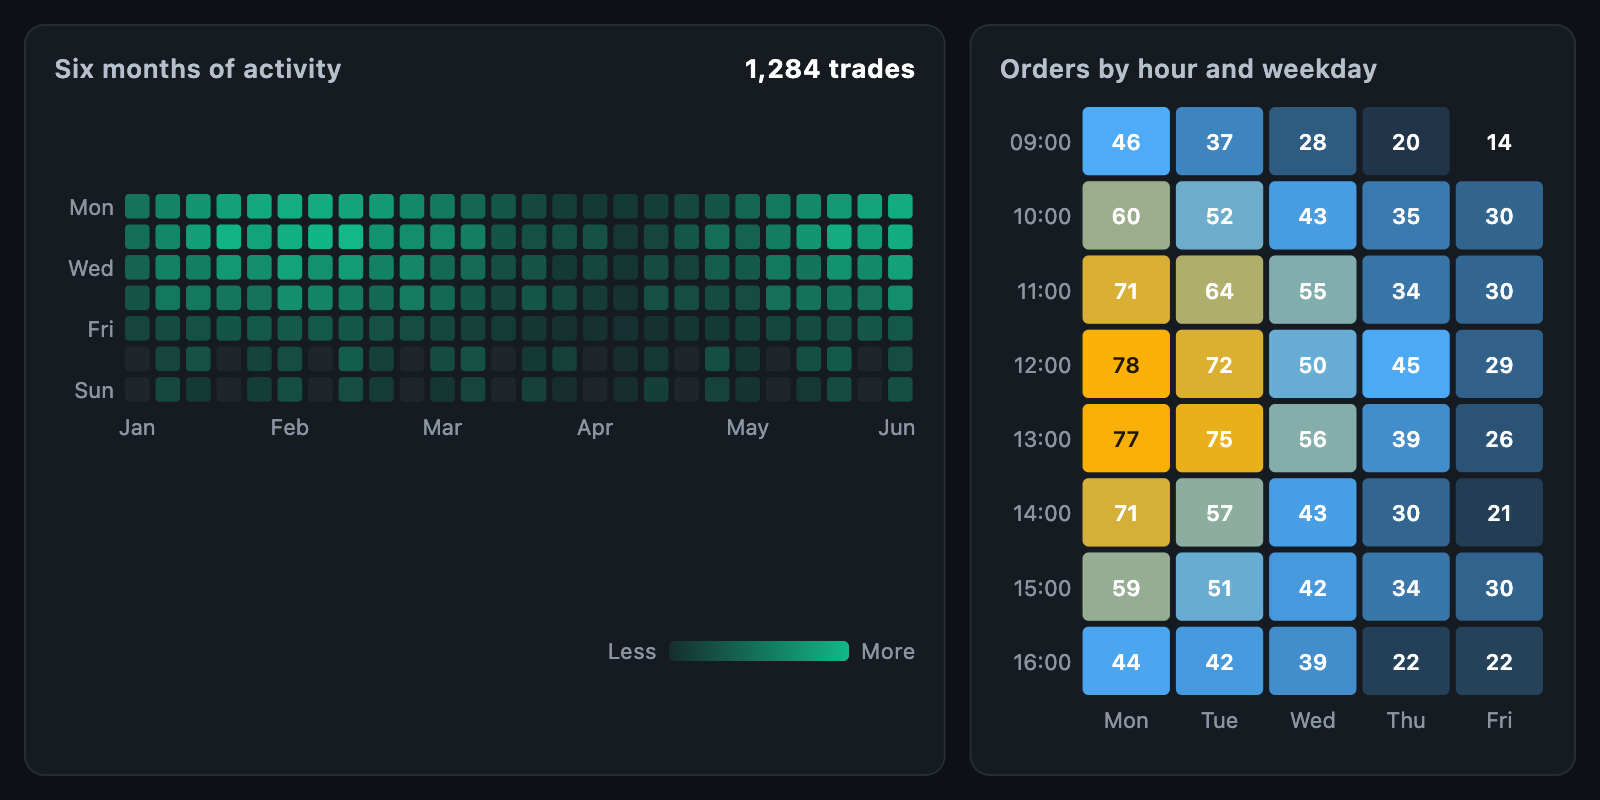 Heatmap Six months of activity, and orders by hour and weekday. |
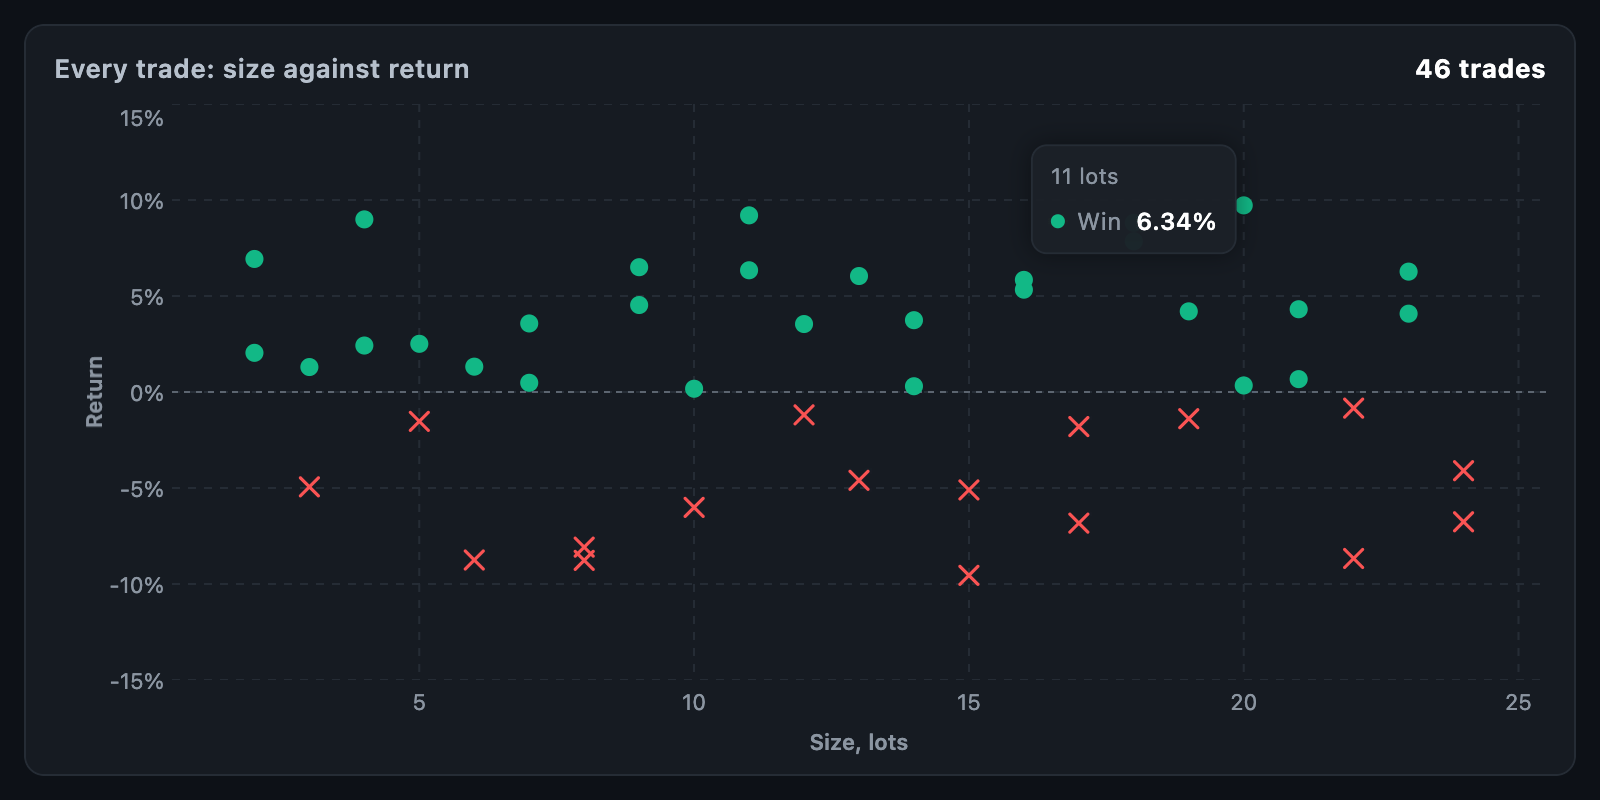 Scatter One point per trade, with per-point shape and colour and a single-point readout. |
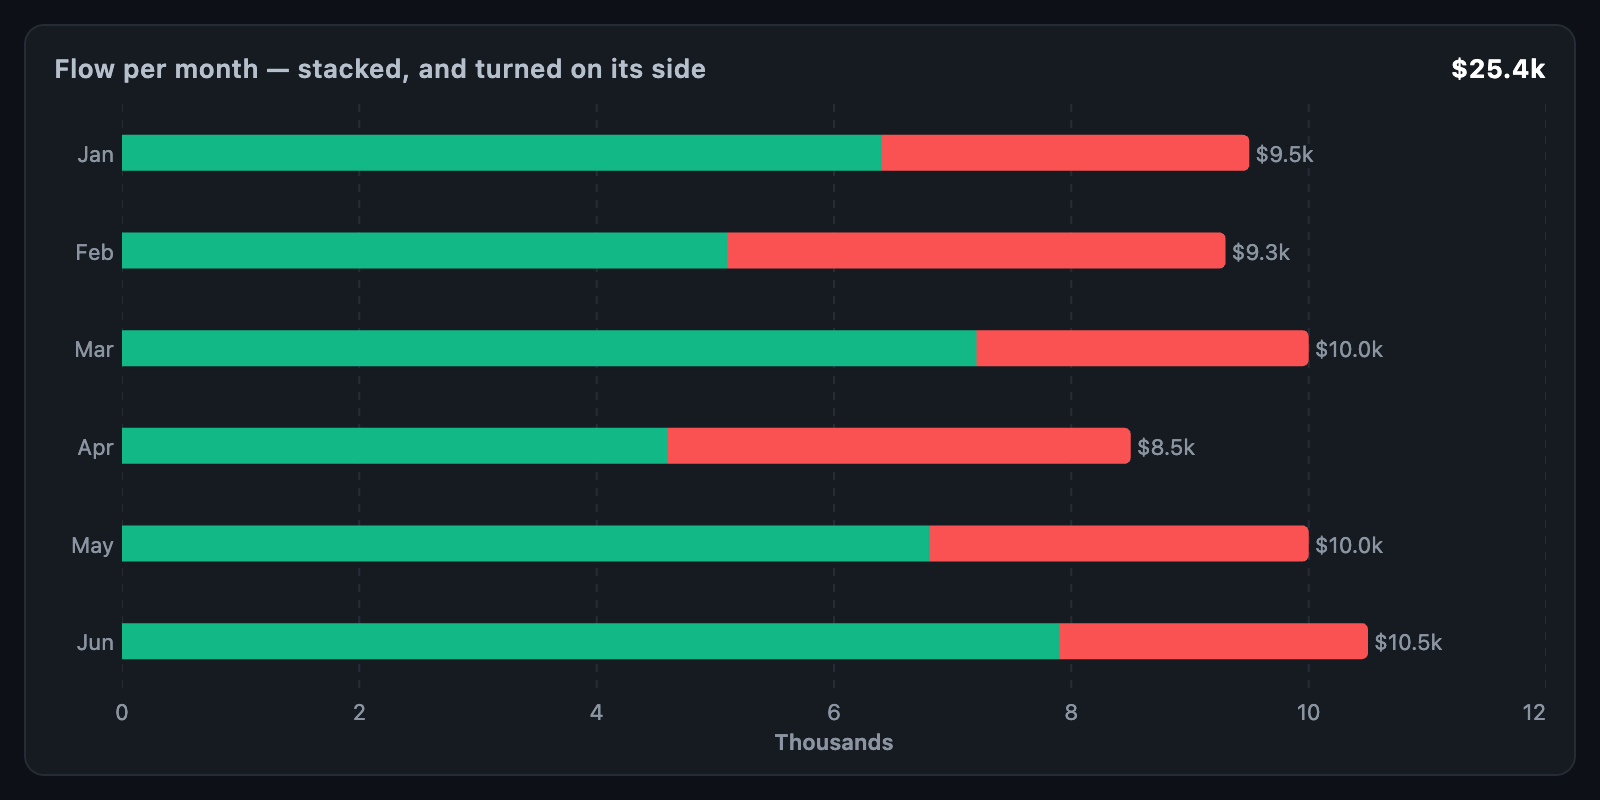 Stacked horizontal bars Stacked bars in horizontal orientation, with titled axes. |
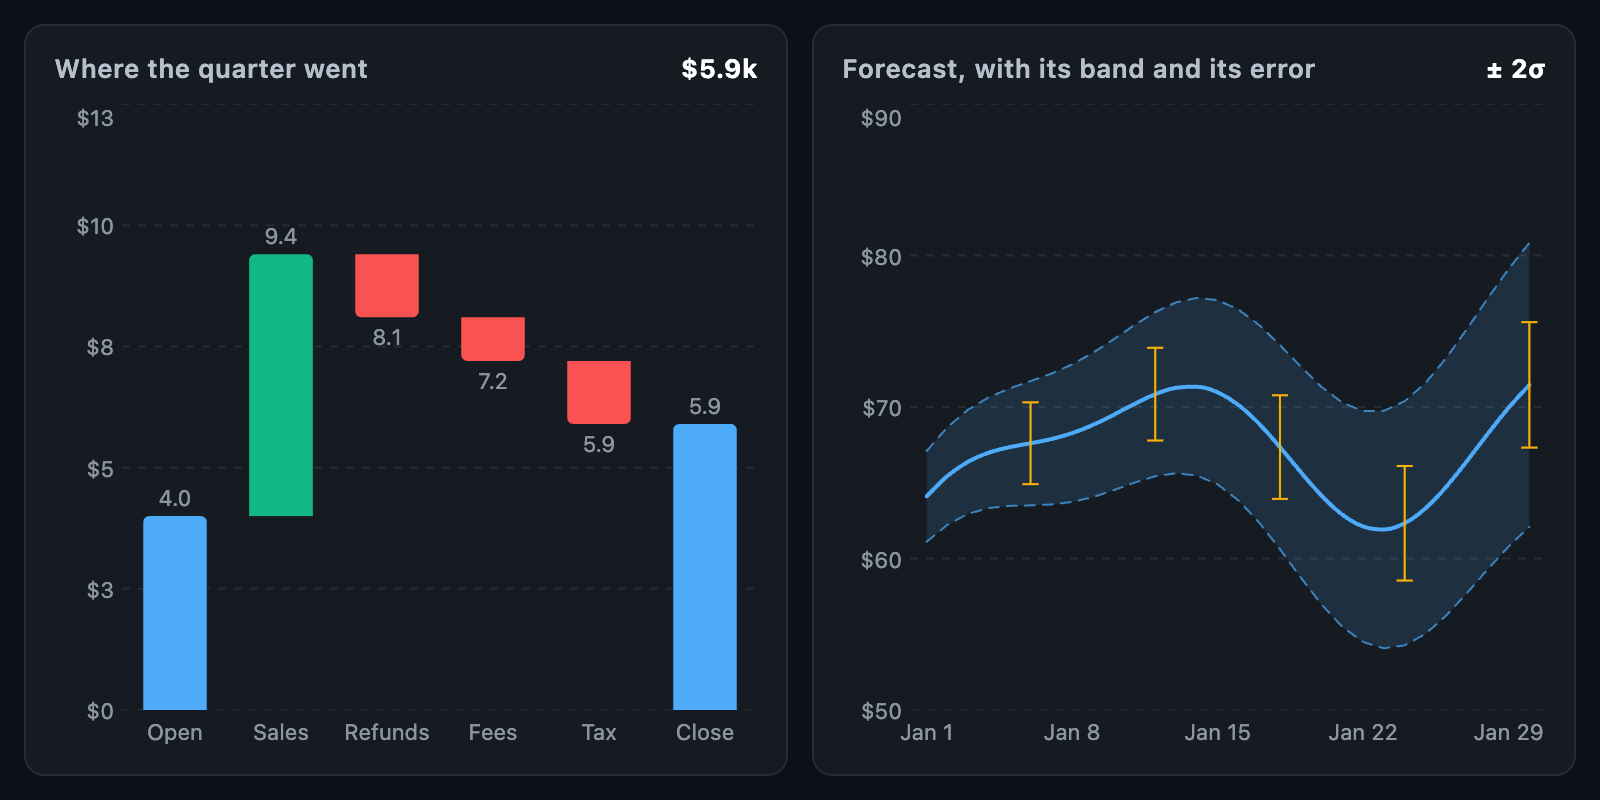 Floating bars and bands A waterfall chart, and a forecast band with error bars. |
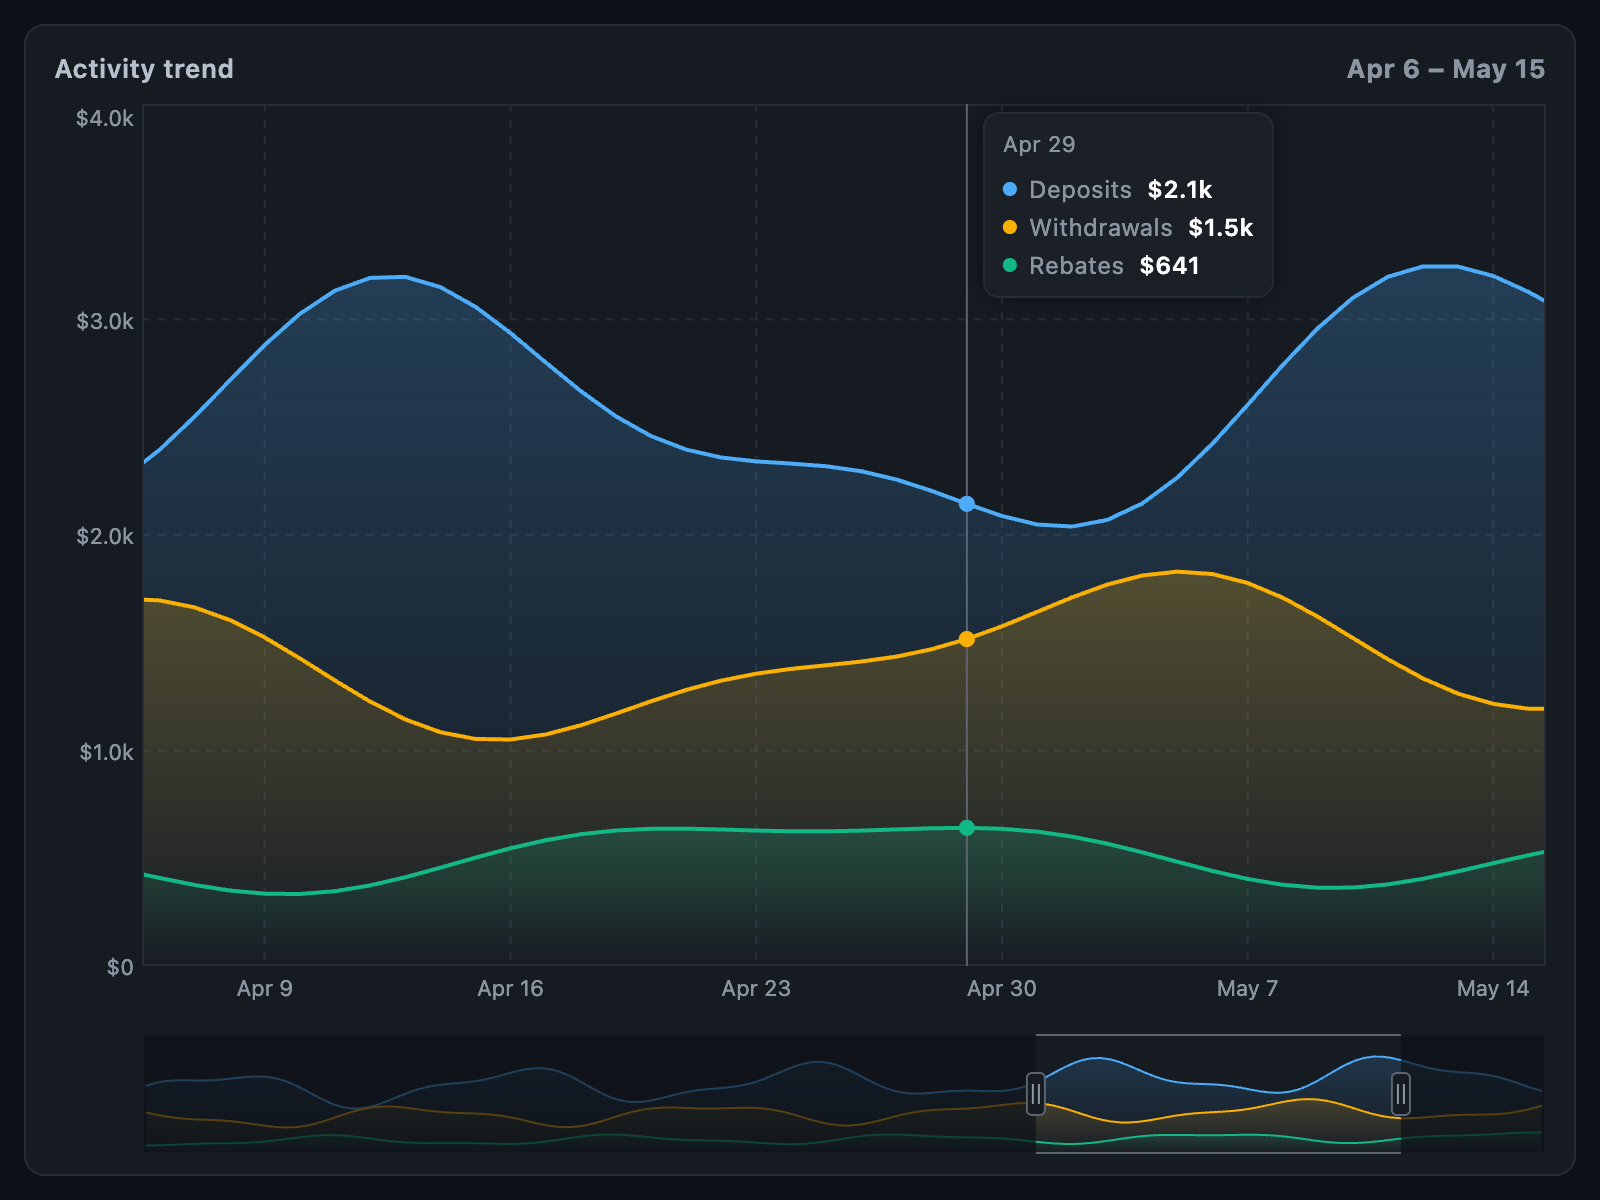 Range selector Three series over five months, with a range selector below. |
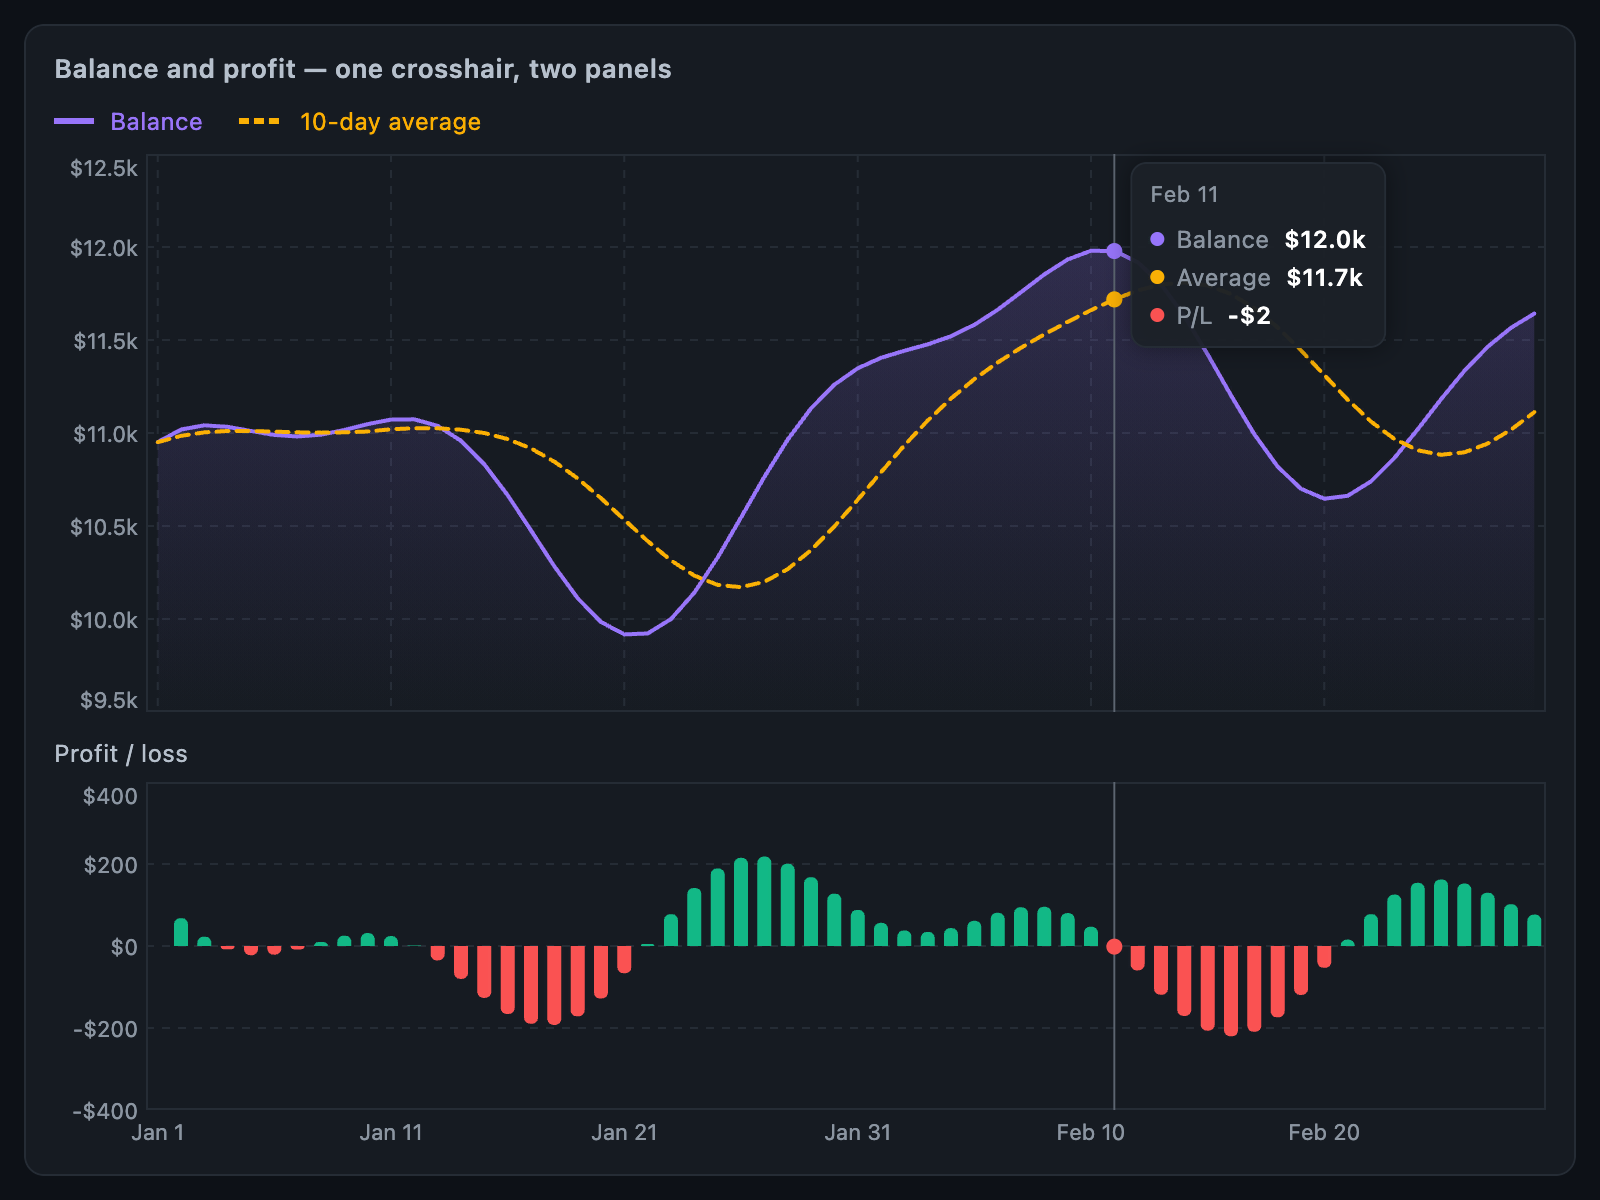 Synchronised crosshair Balance and profit panels sharing one crosshair. |
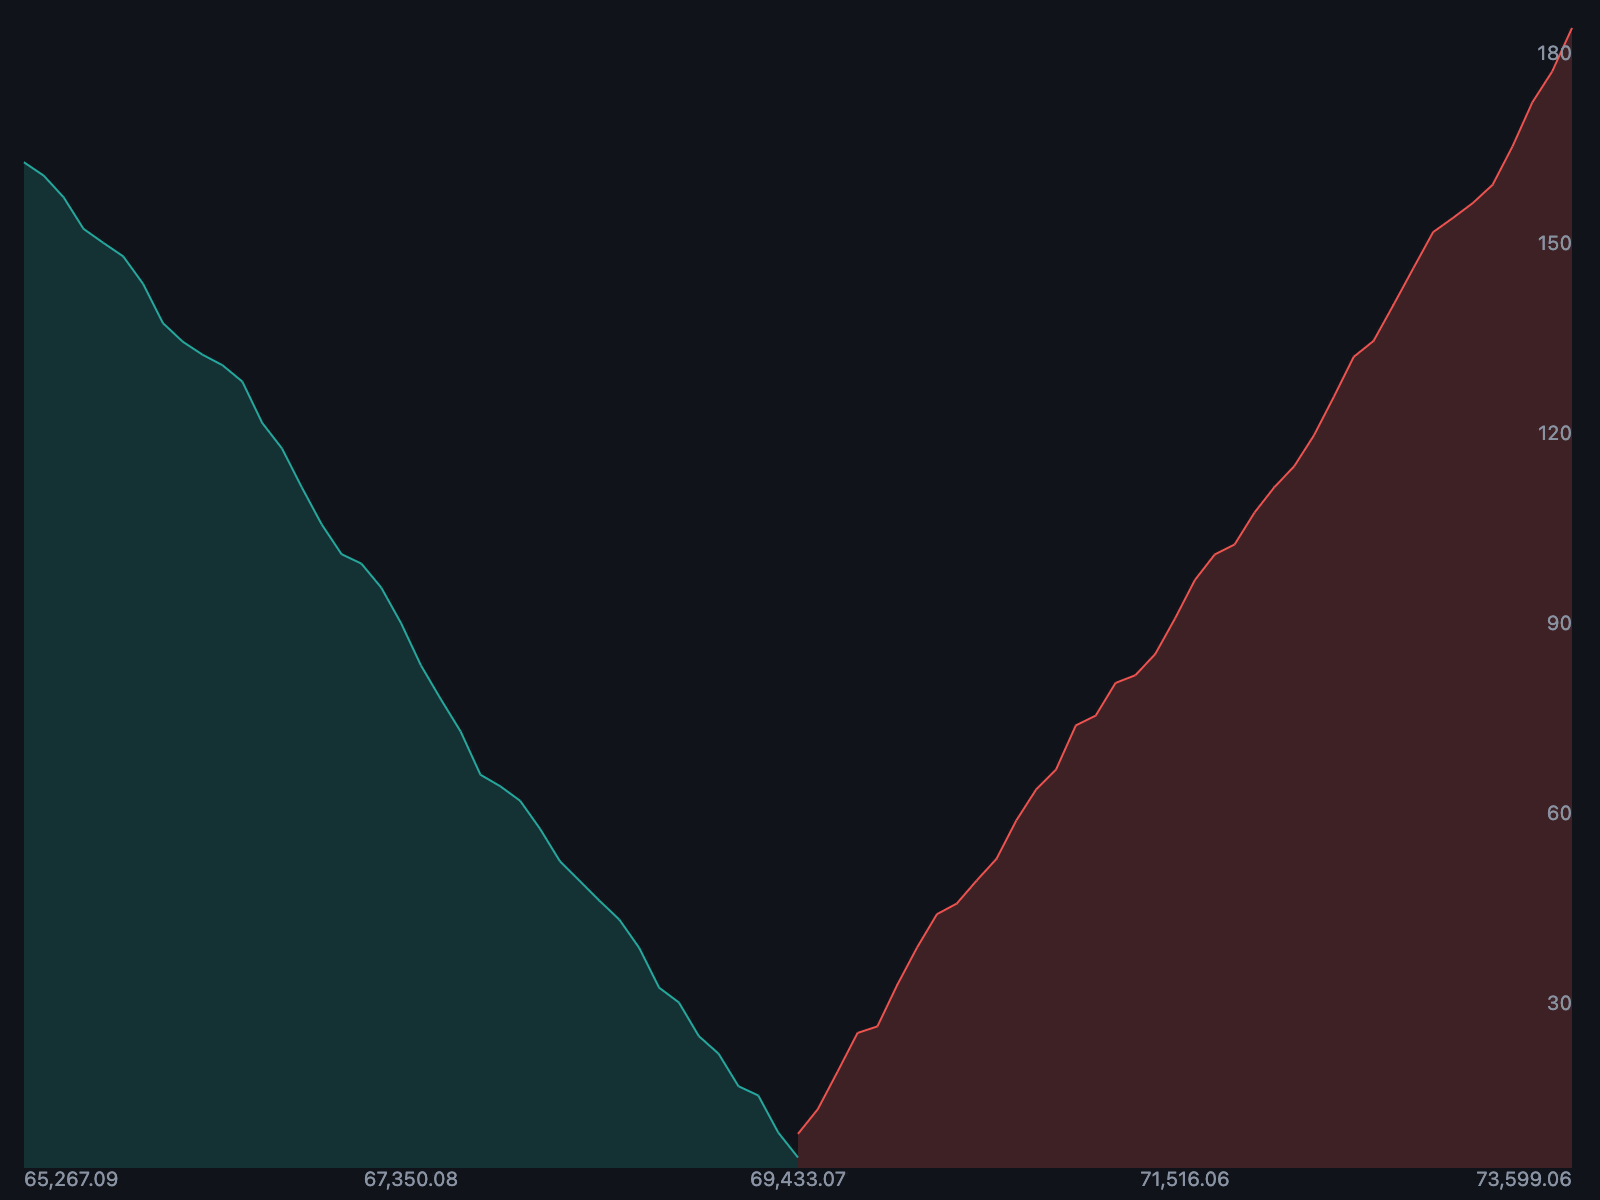 Depth chart Cumulative bid and ask depth. |
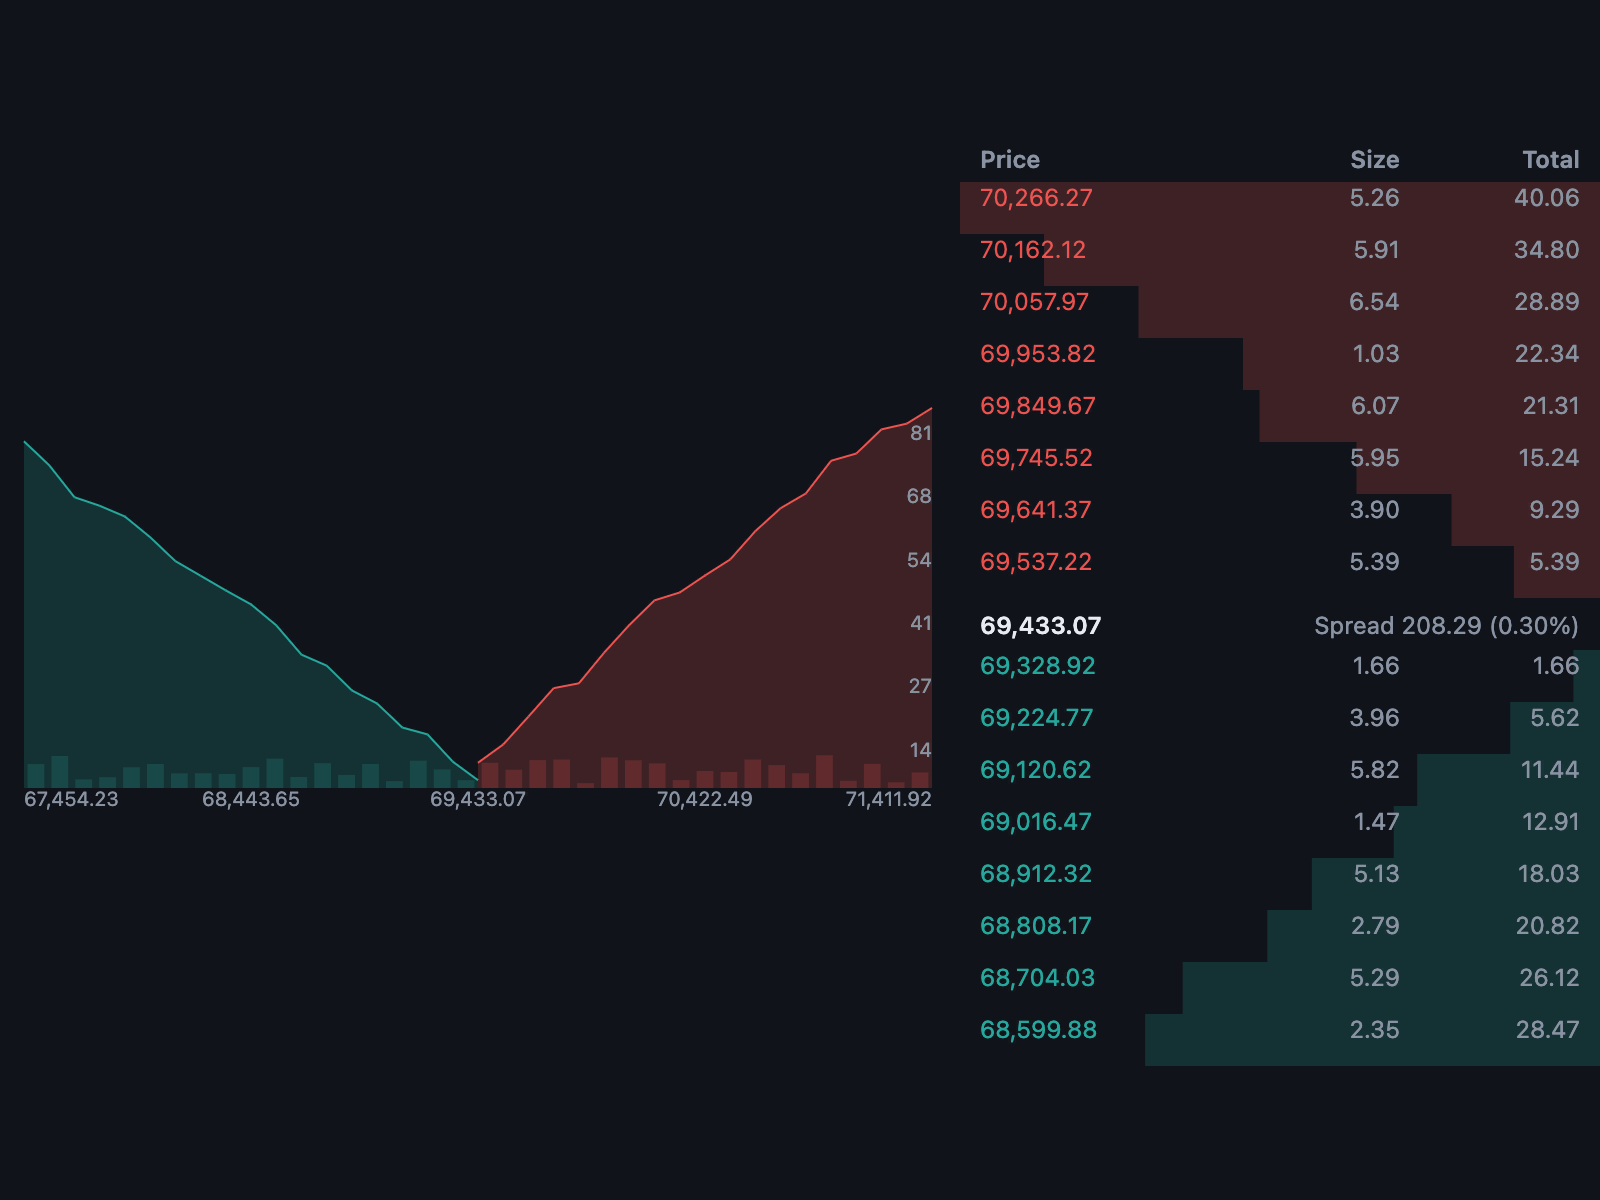 Depth chart modes Cumulative, histogram, combined and ladder modes. |
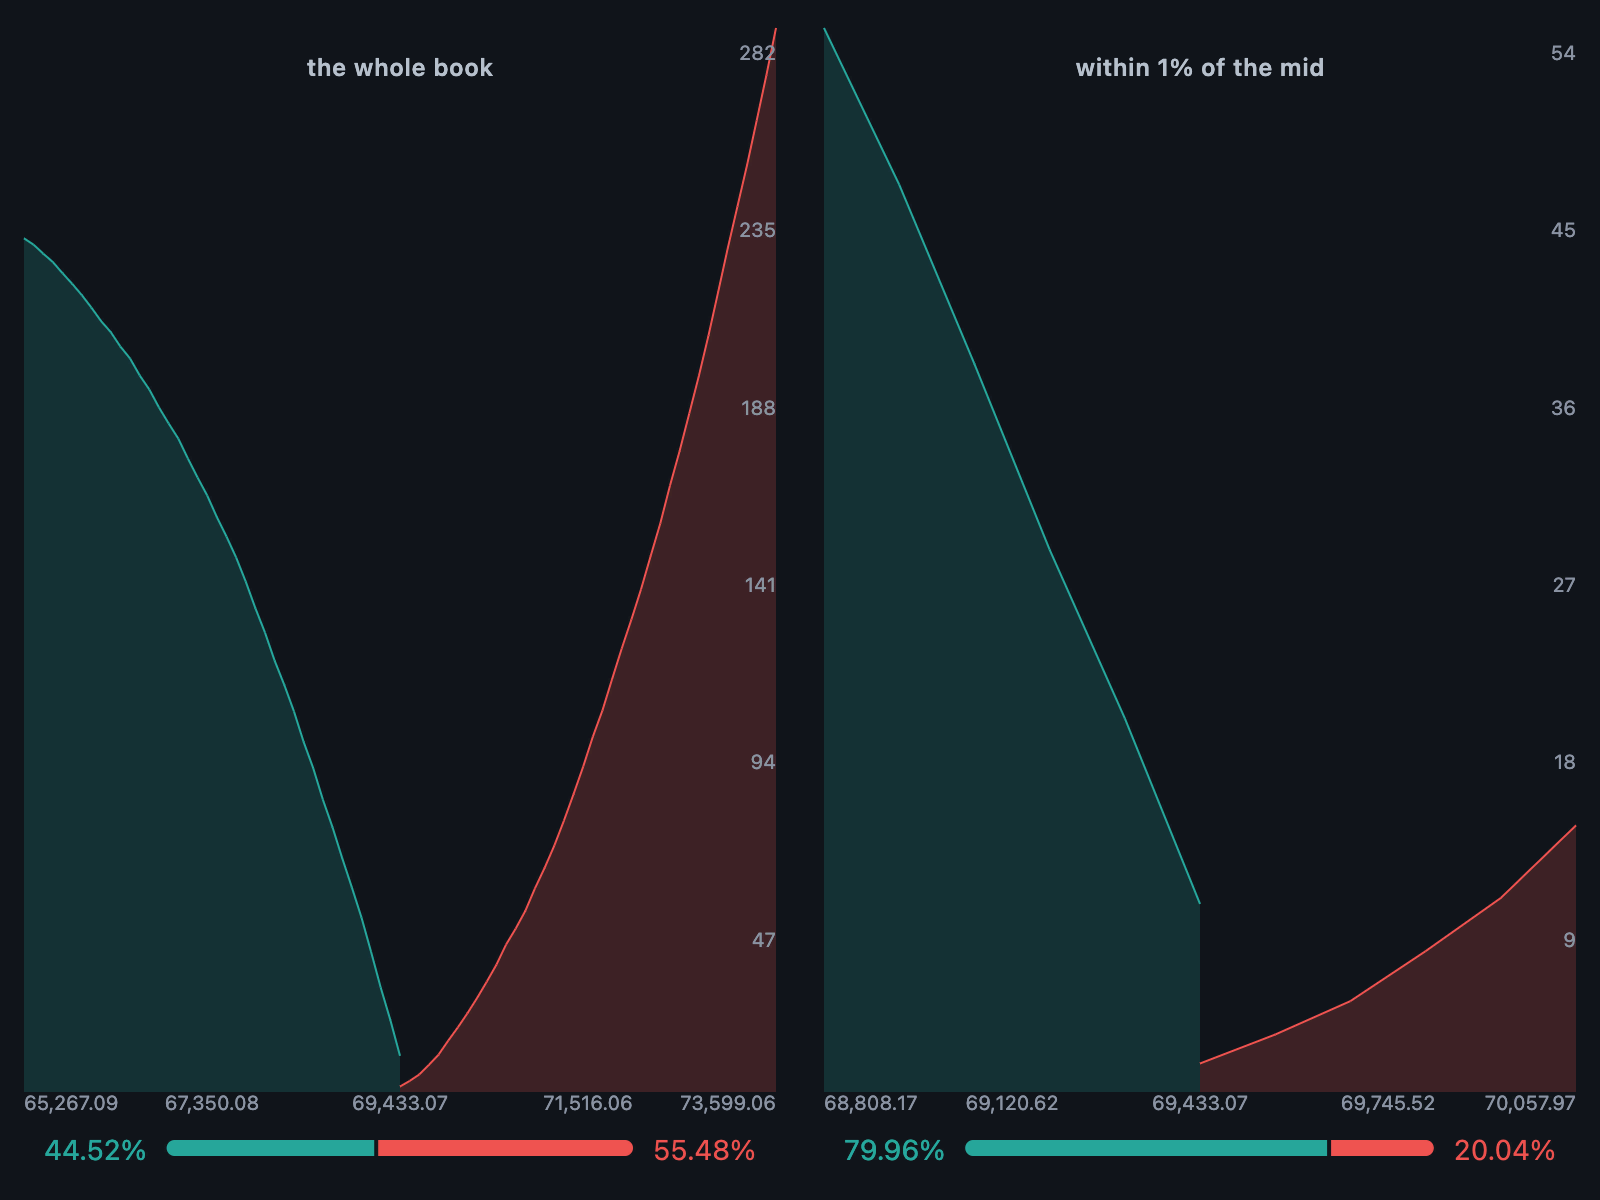 The bid/ask ratio bar The balance of bid and ask volume, below the depth chart. |
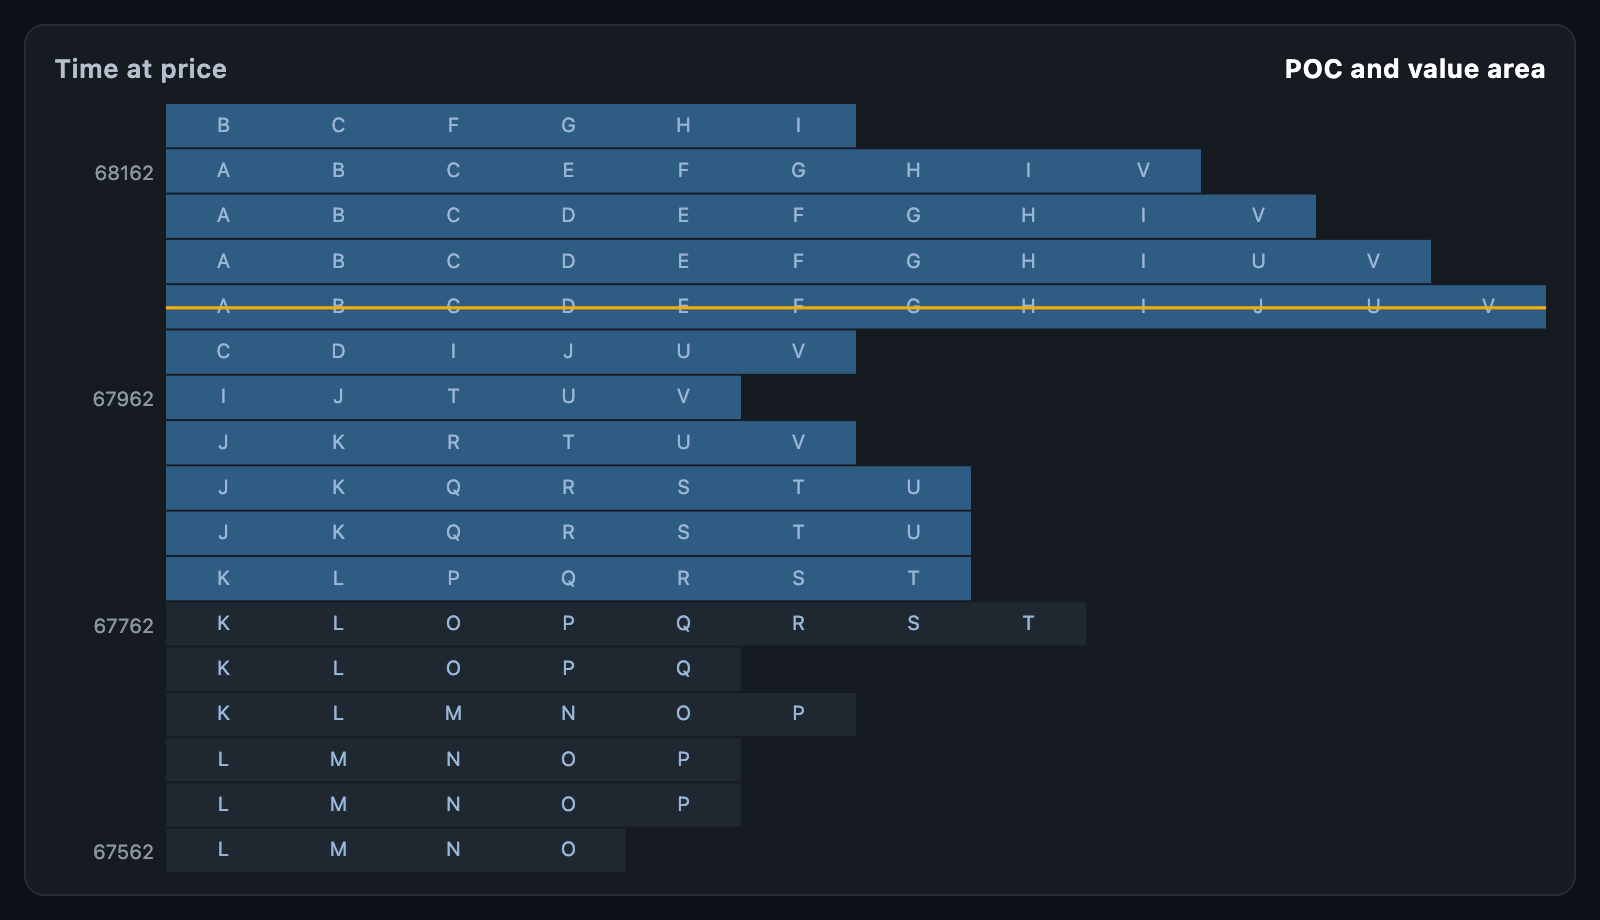 Market profile Time at price as TPO letters, with the point of control and value area. |
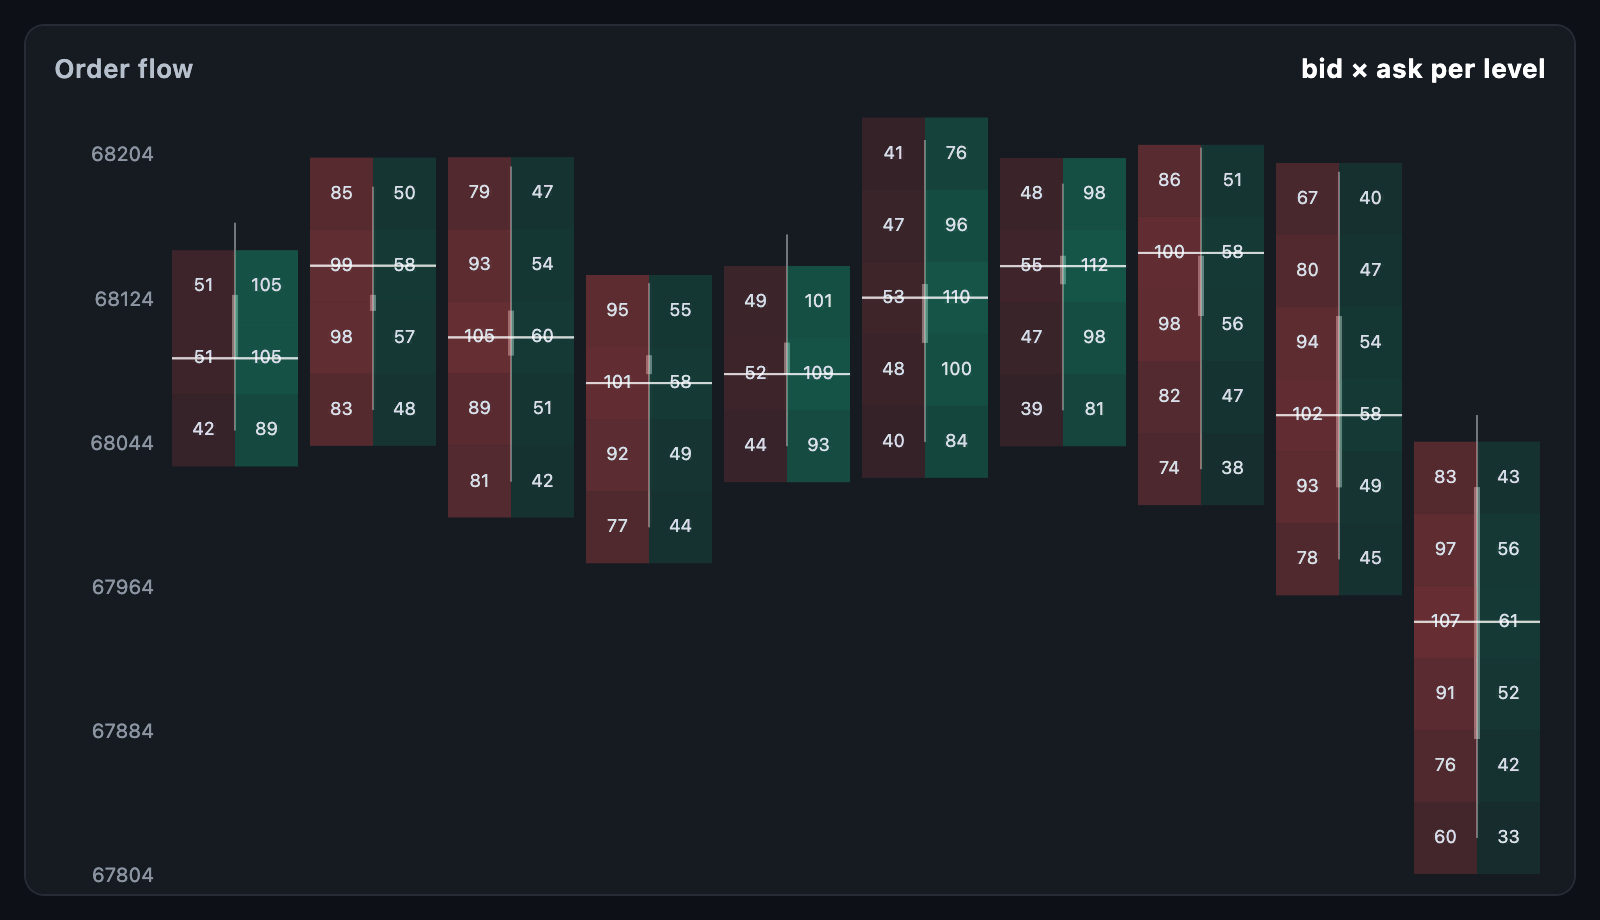 Footprint Bid and ask volume at every price, inside each candle. |
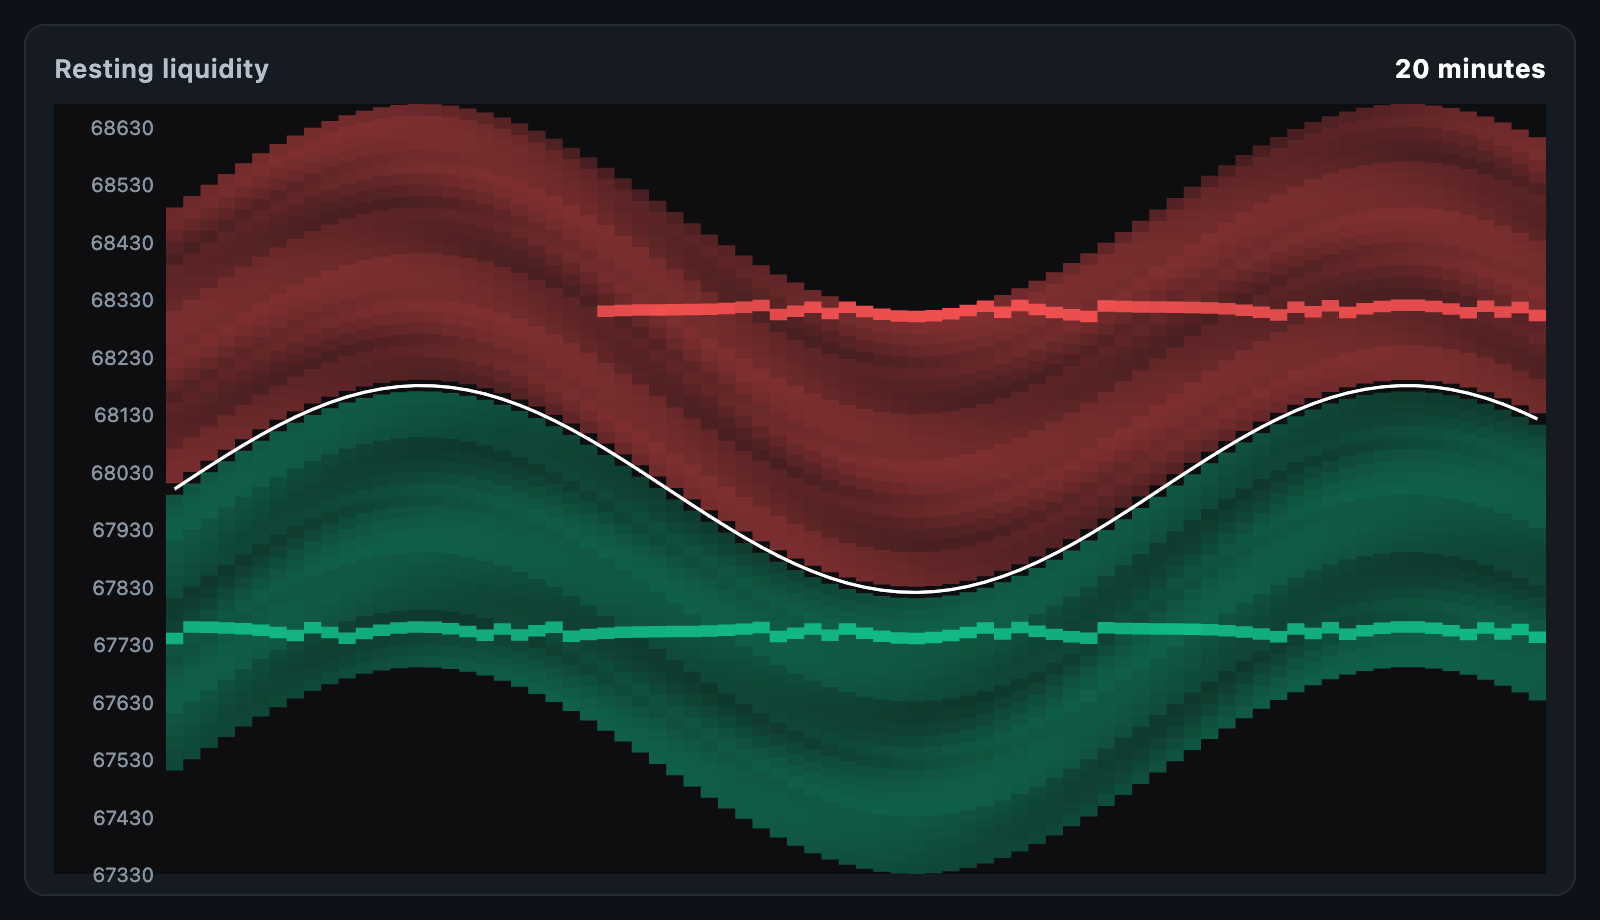 Order-book heatmap Resting liquidity over time, with walls as bright lines. |
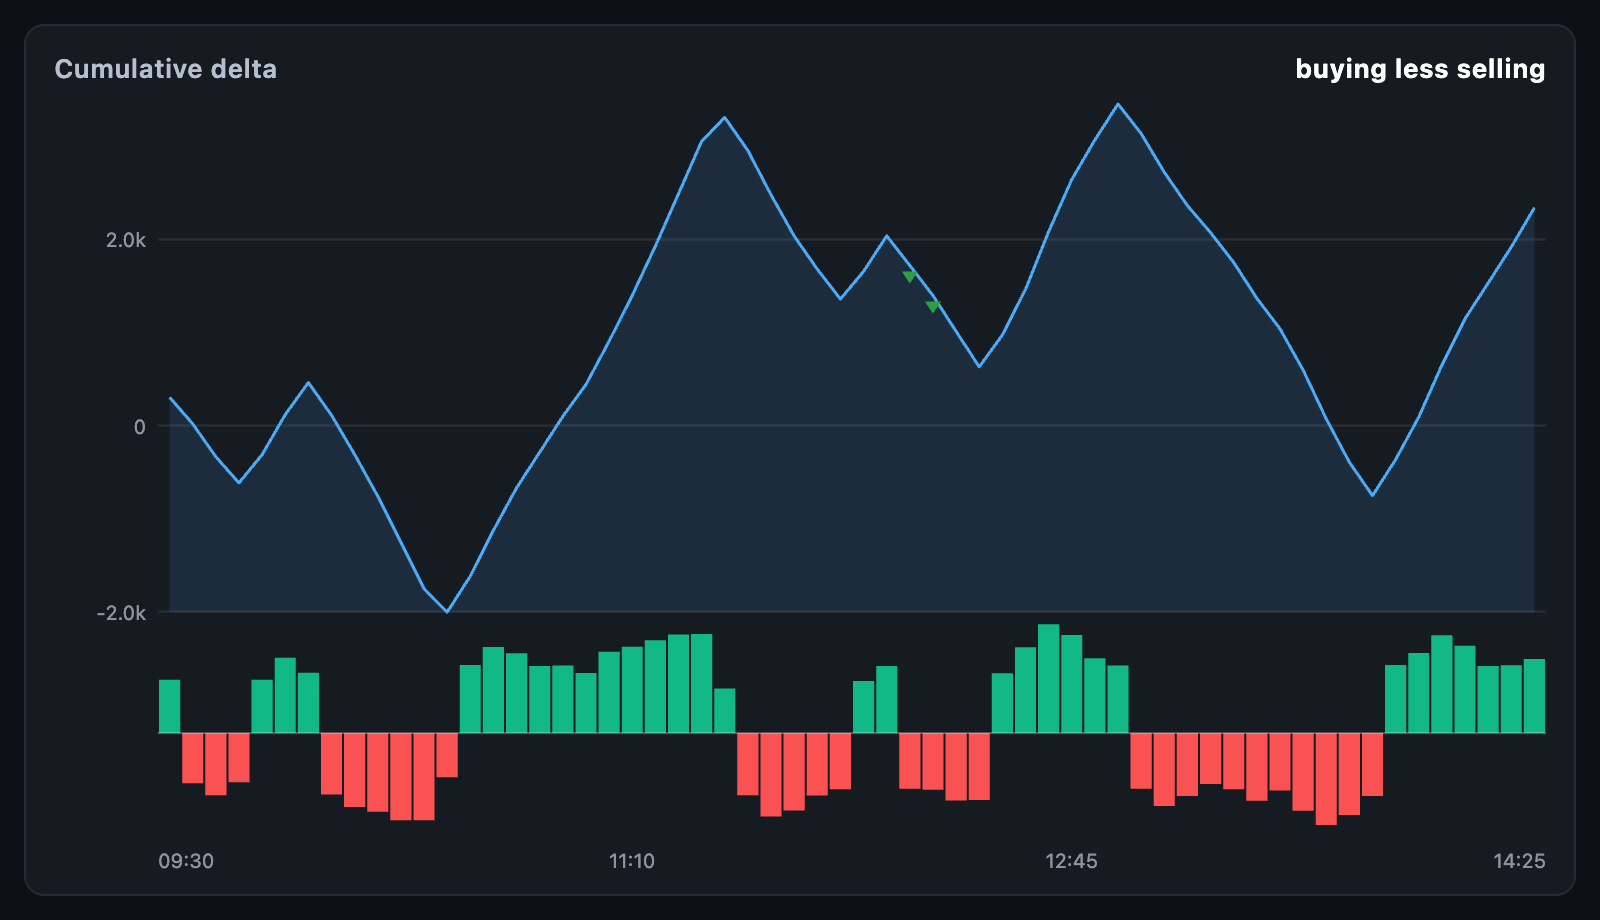 Cumulative delta Running delta over a session, with buying and selling per bar. |
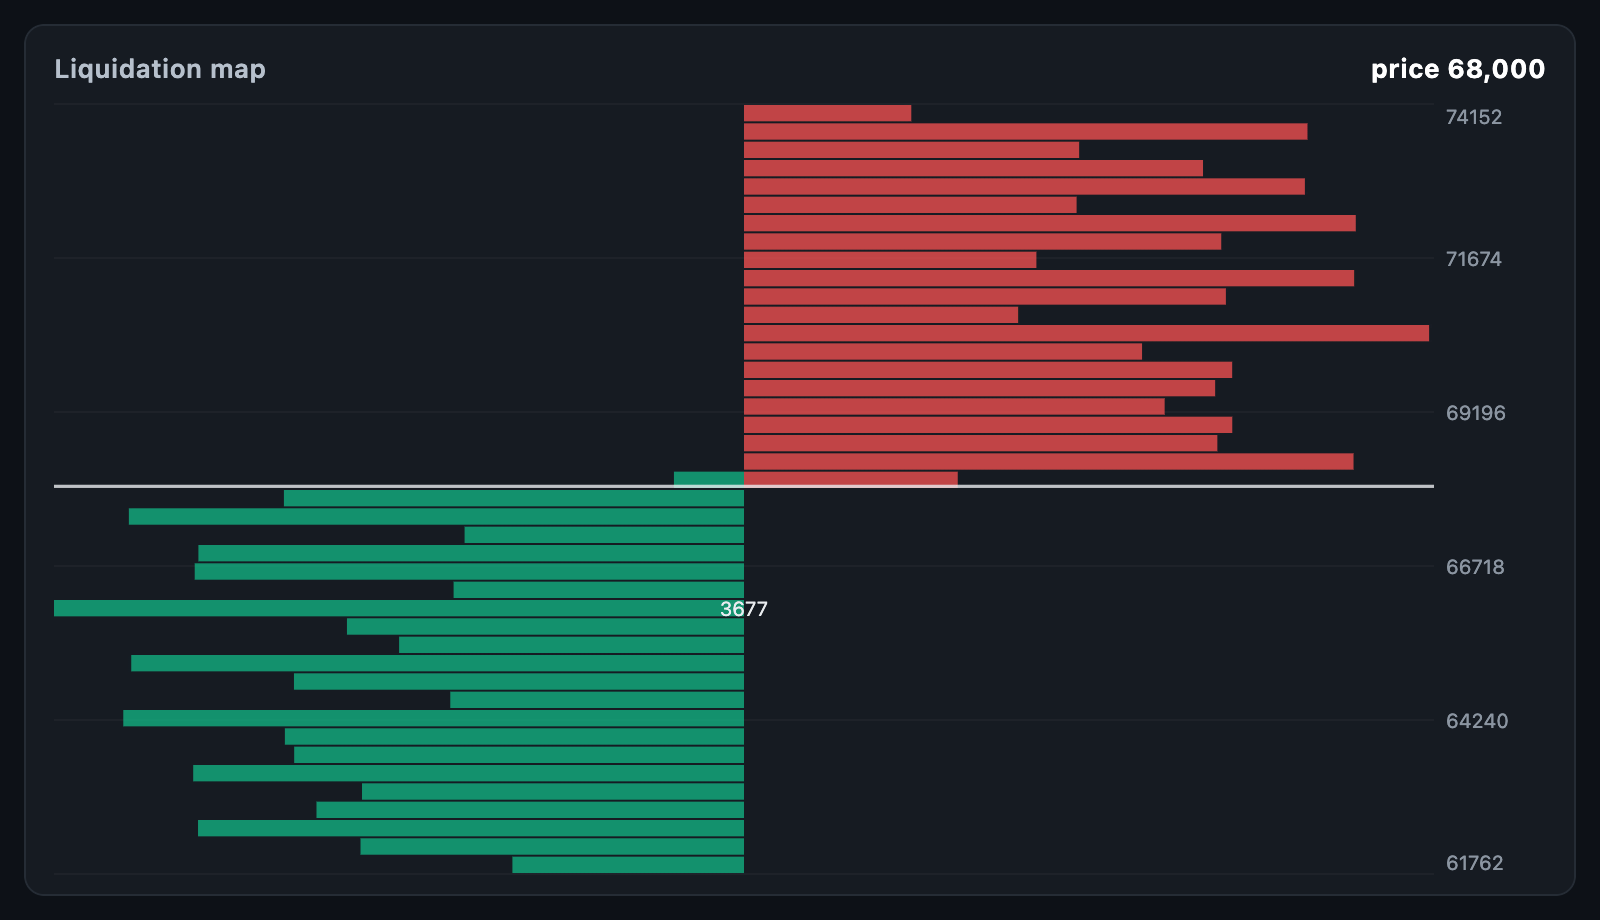 Liquidity map Where the leveraged stops sit, longs below the price and shorts above. |
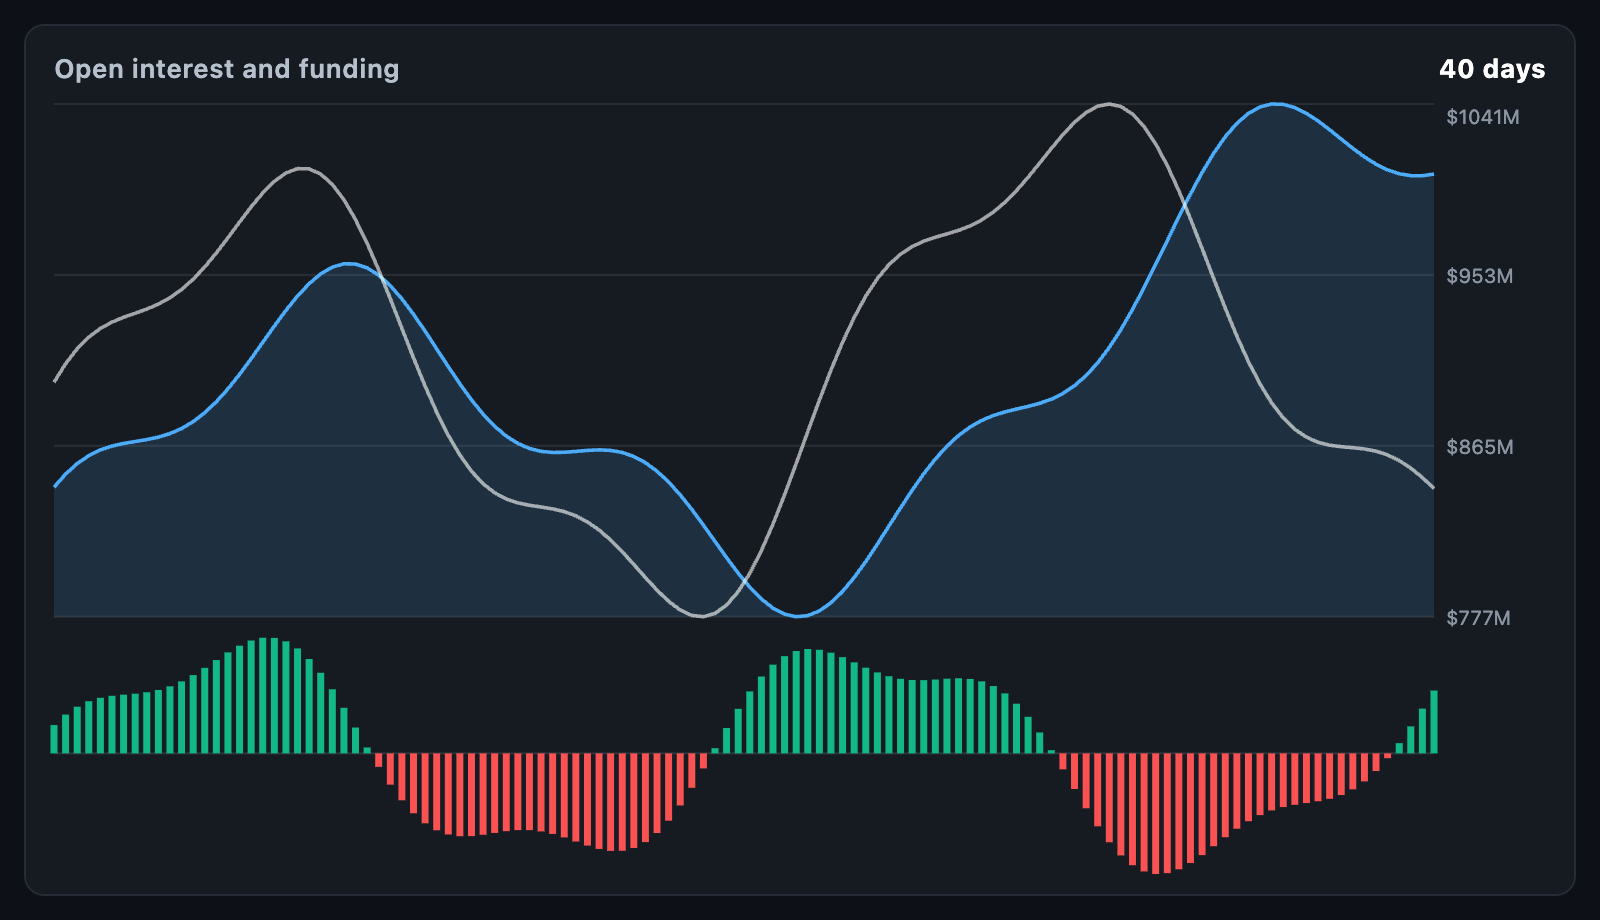 Open interest and funding How much money is in the trade, and which side is paying. |
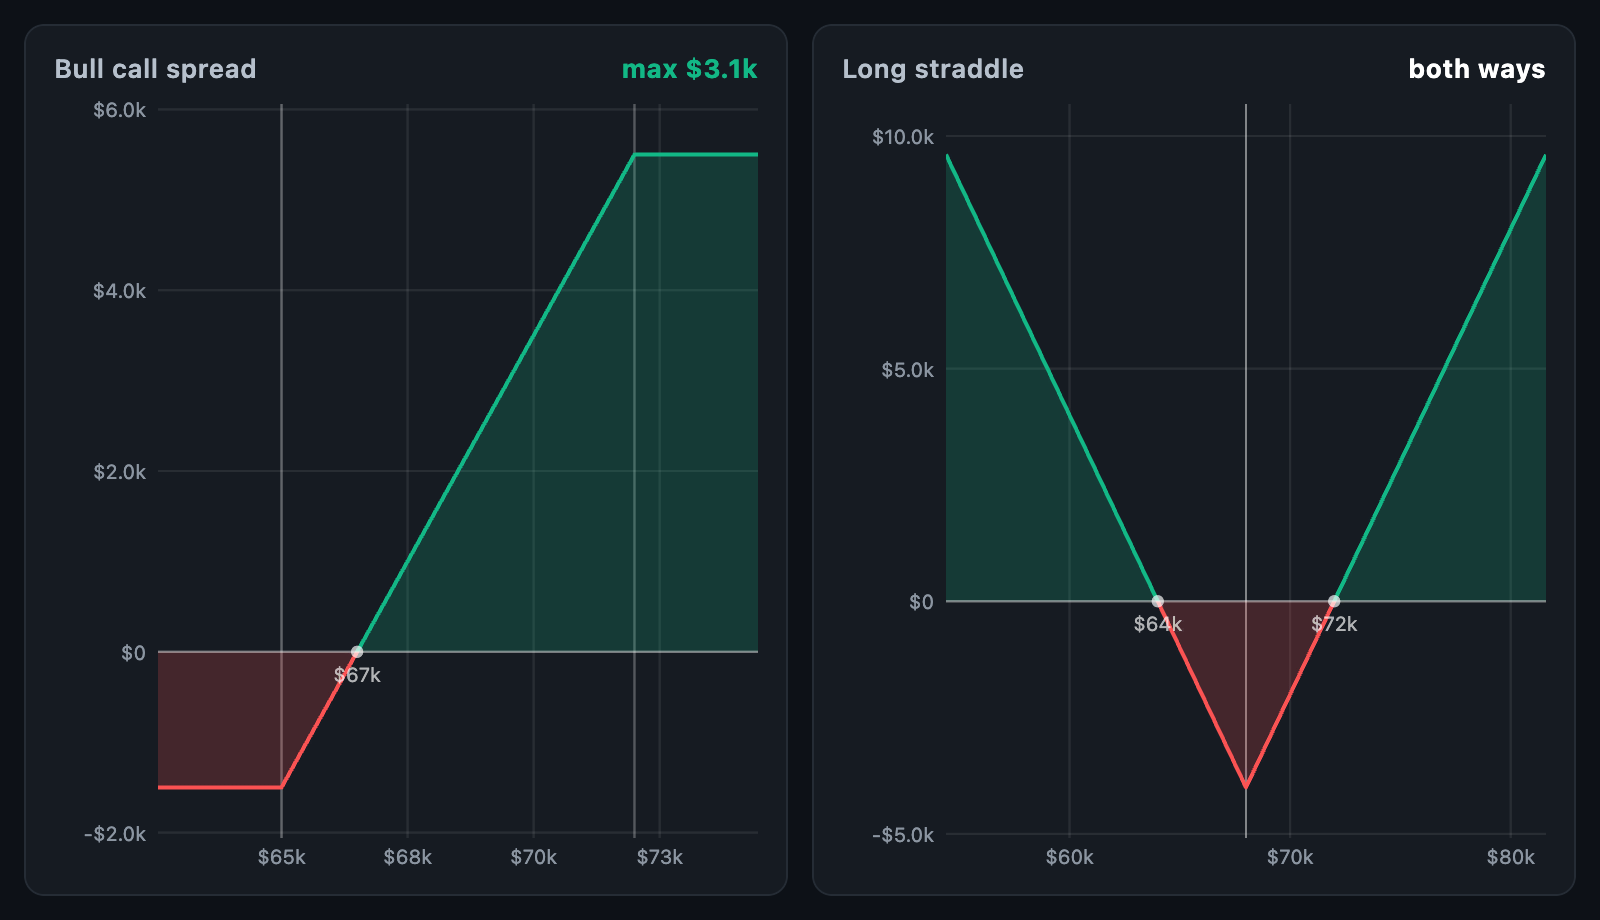 Options payoff A bull call spread and a long straddle at expiry, with break-evens. |
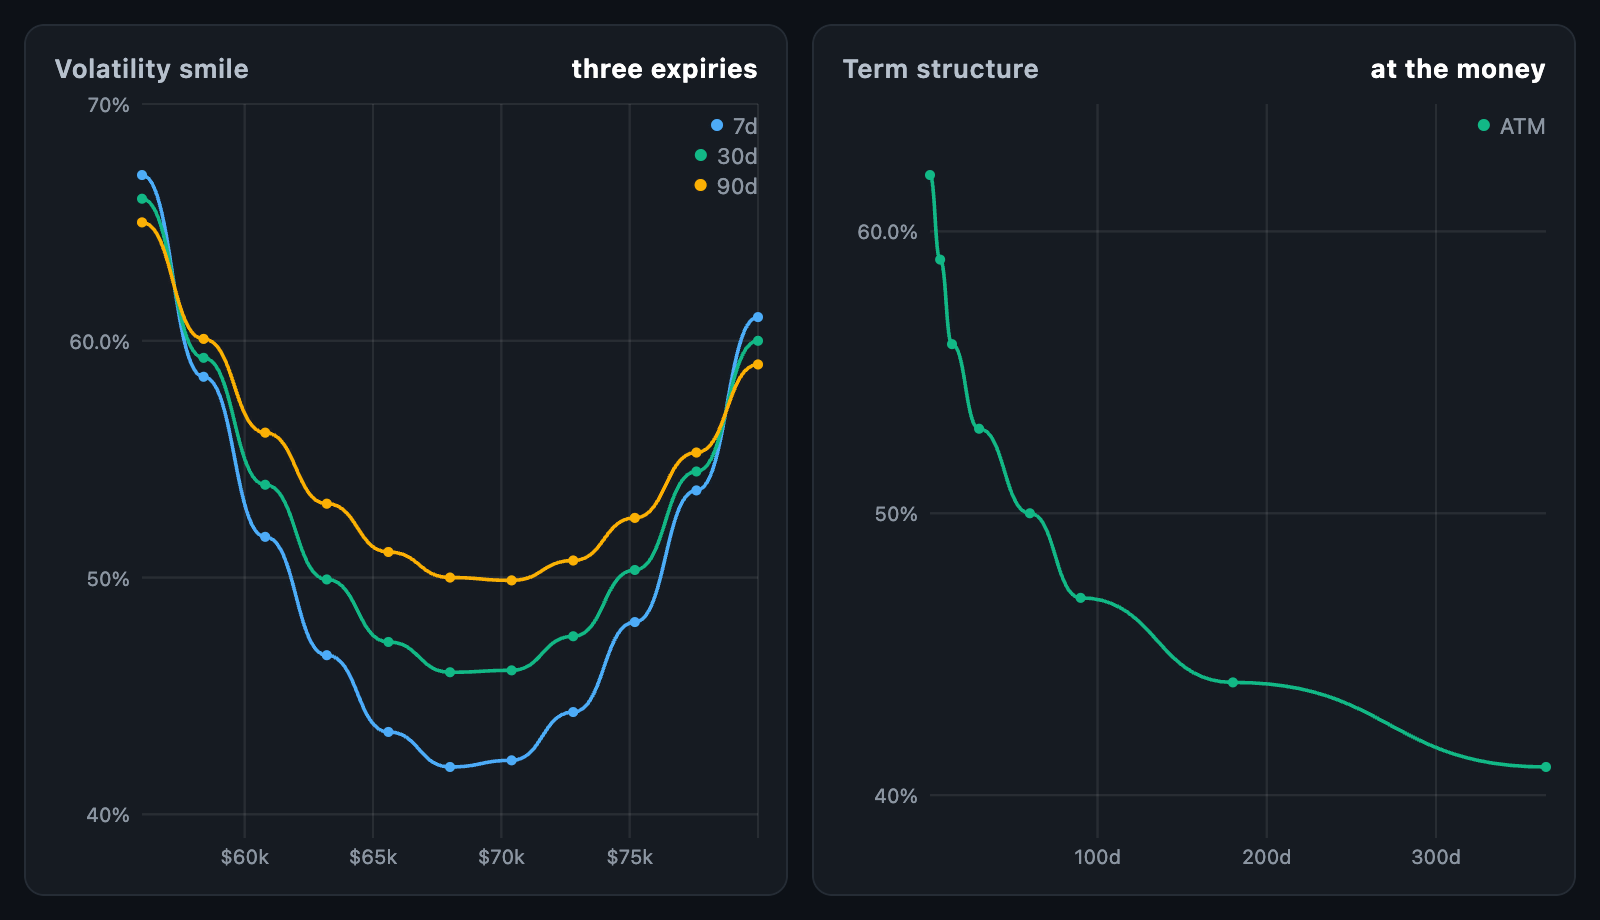 Volatility curves A smile at three expiries, and a term structure. |
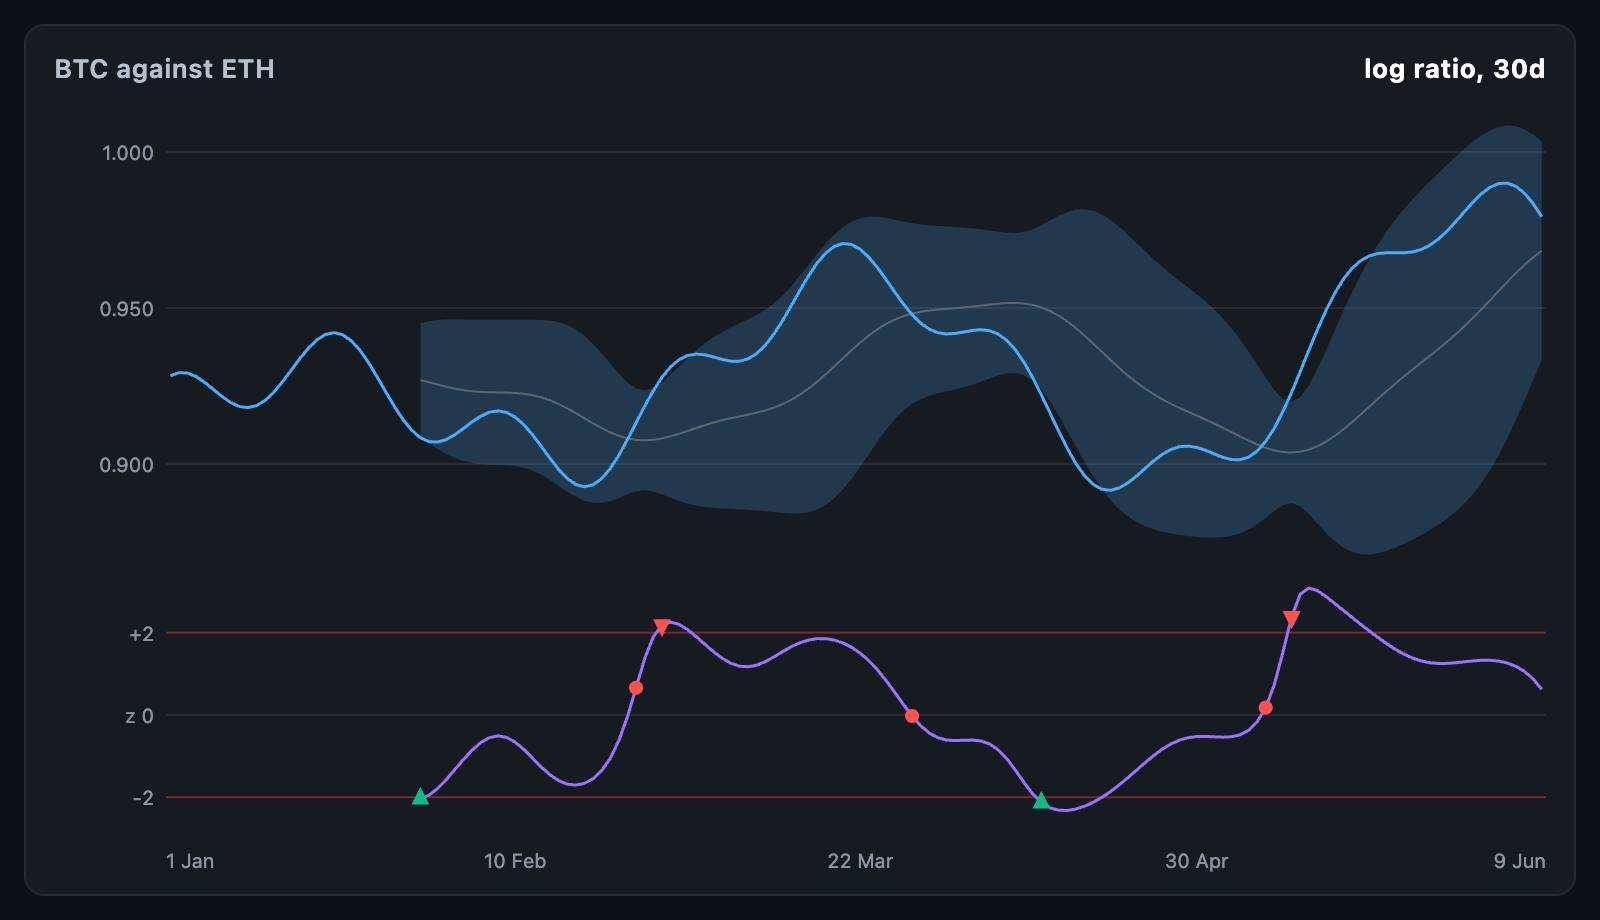 Pair spread The log ratio of two symbols, with bands and a z-score. |
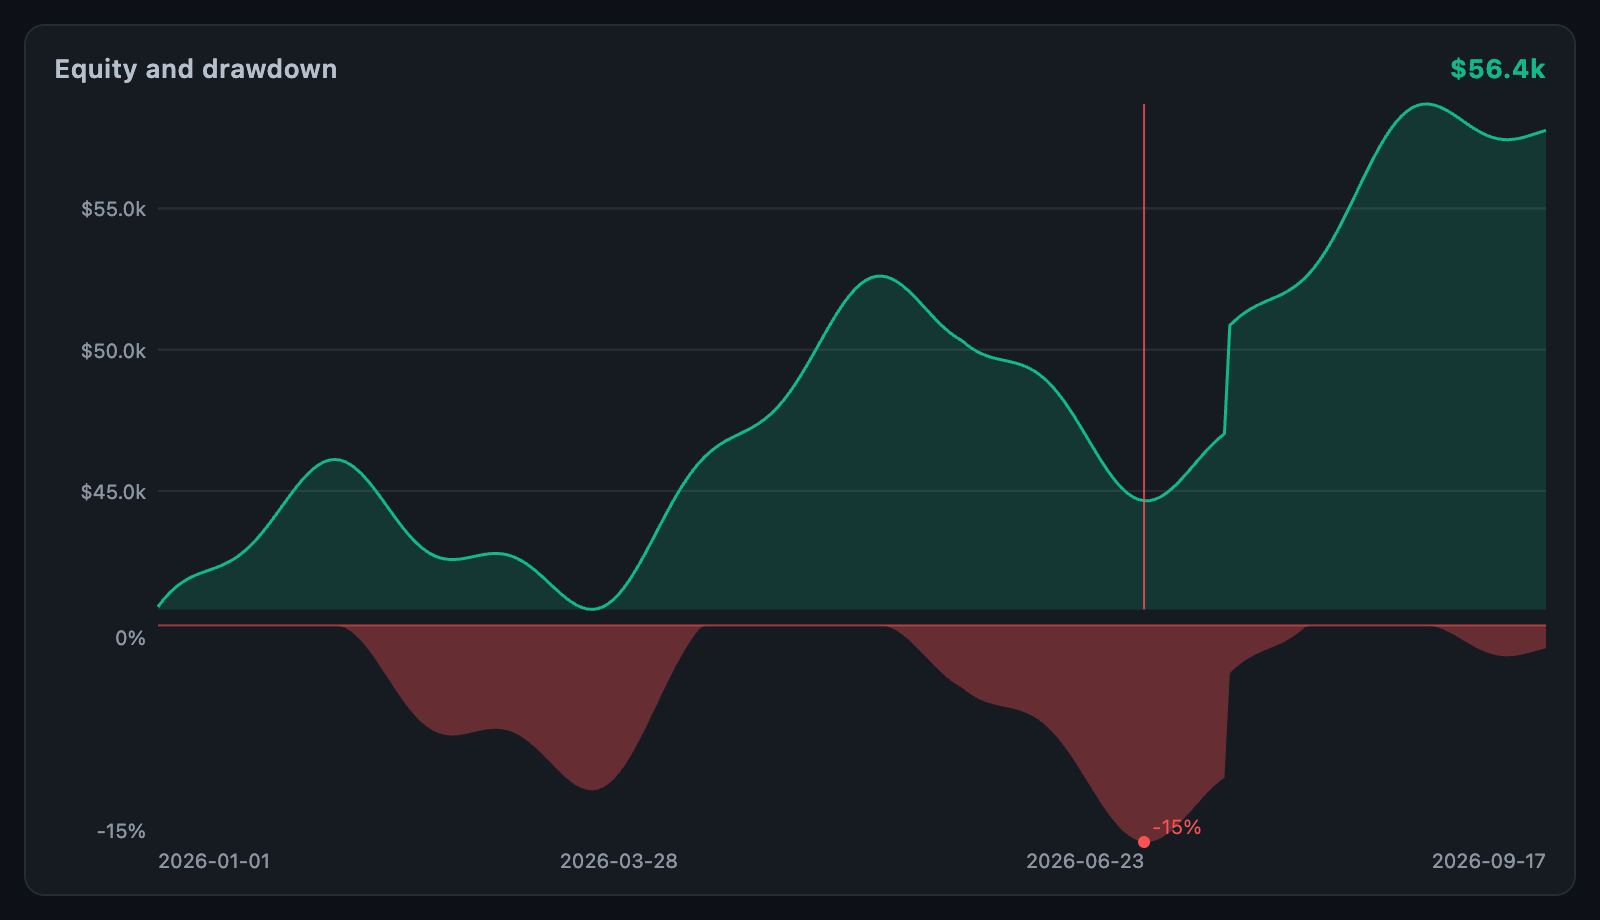 Equity curve The curve, with the underwater drawdown panel beneath it. |
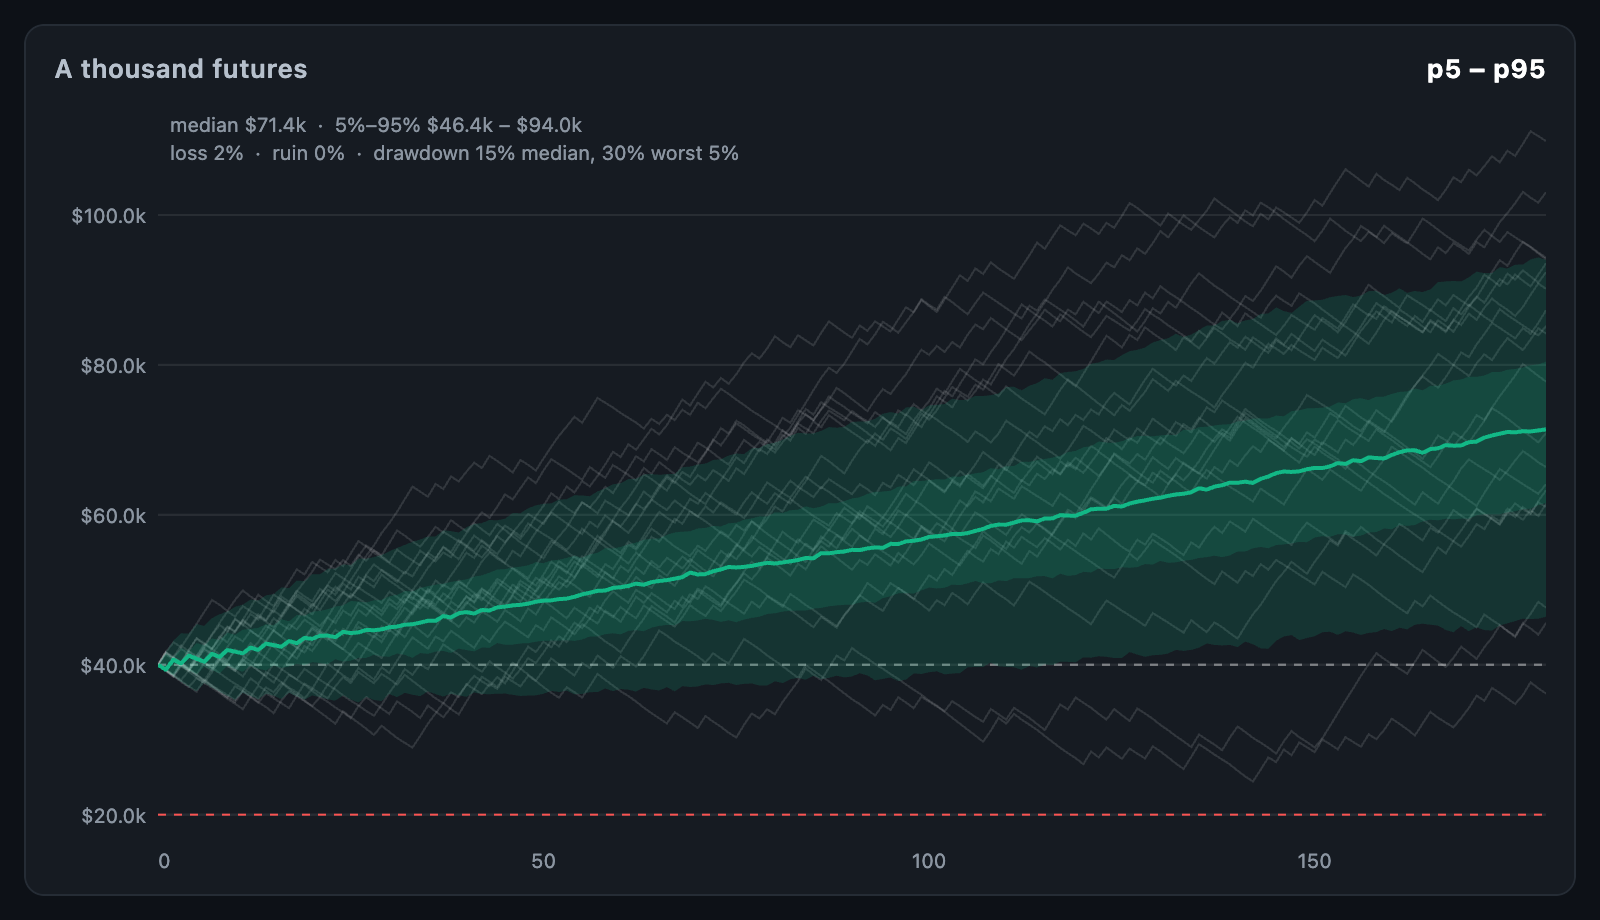 Monte Carlo fan Simulated paths as percentile bands, with the odds of loss and ruin. |
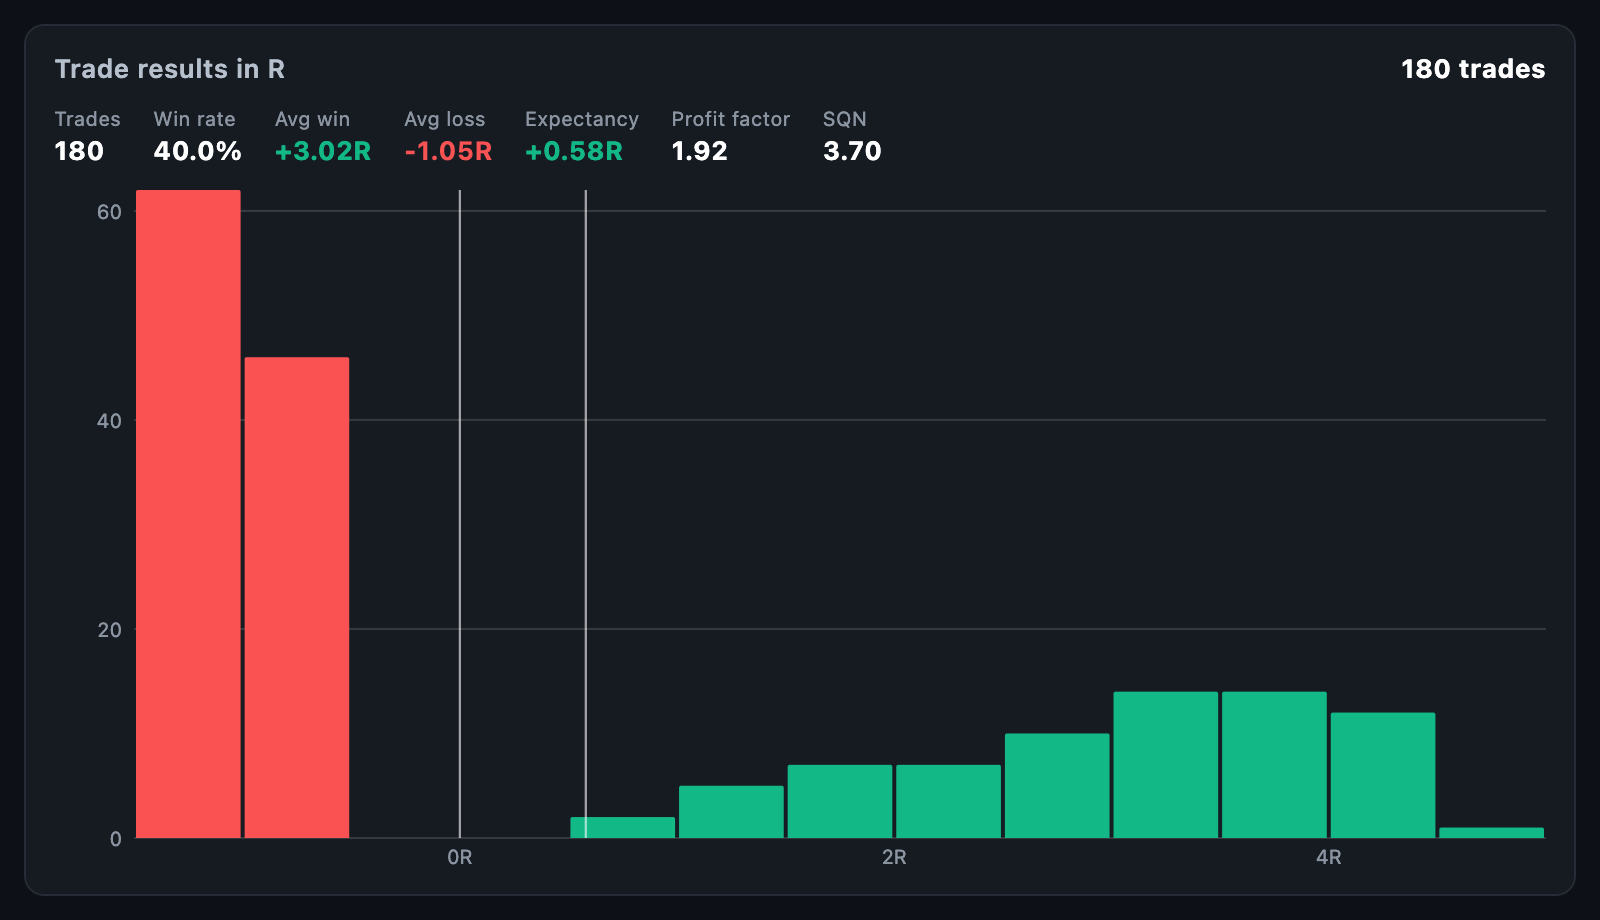 R-multiple distribution Results in R, with expectancy, profit factor and SQN. |
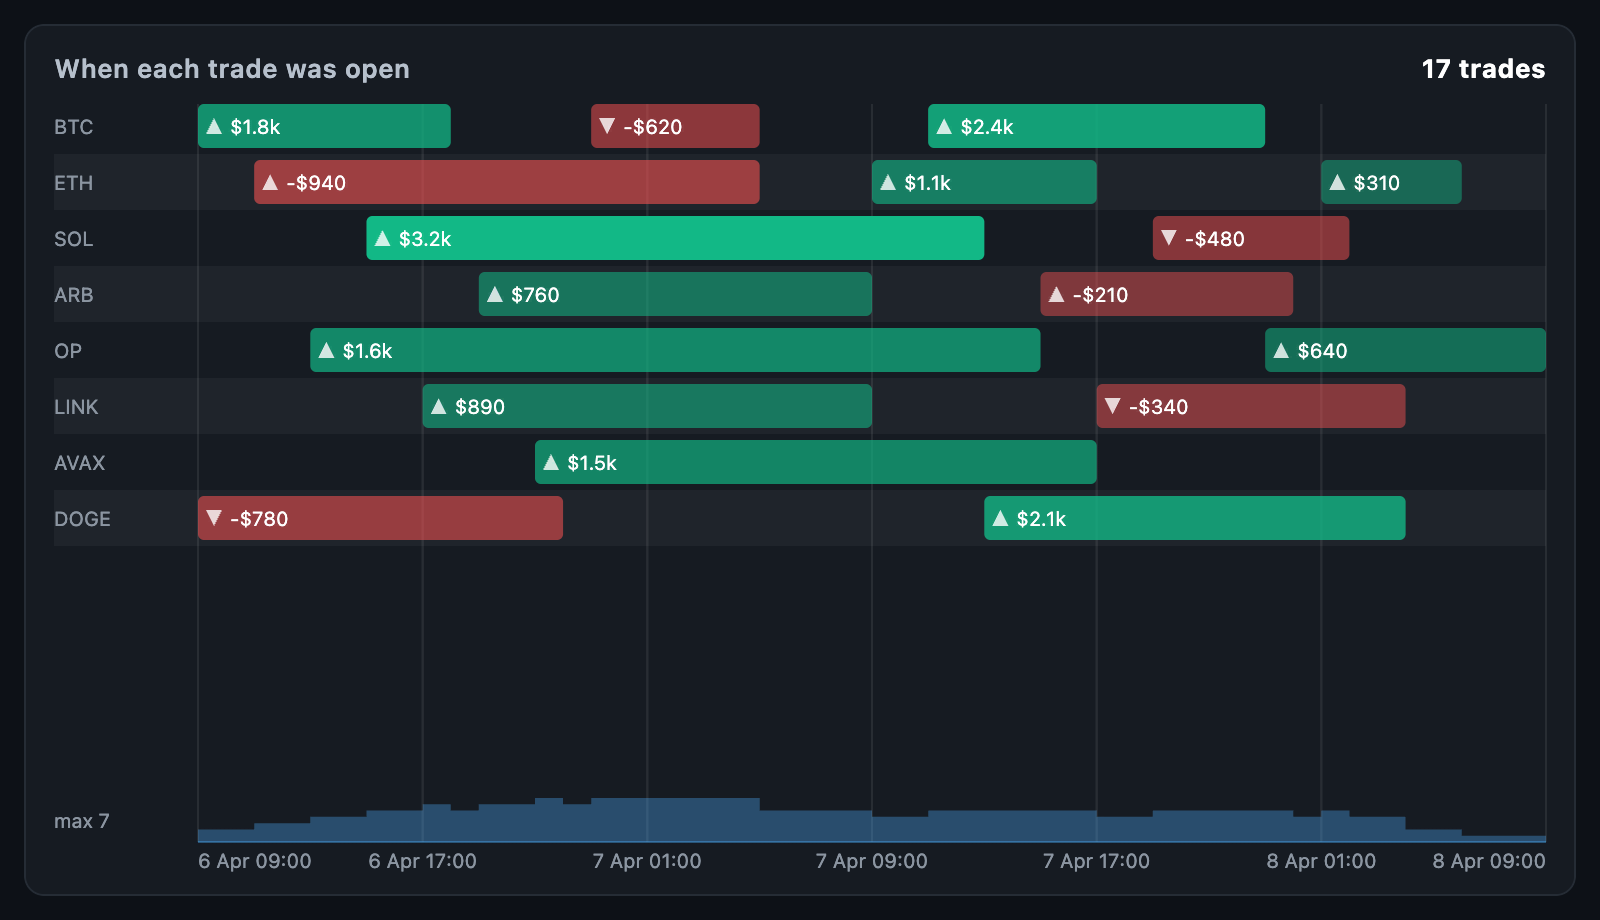 Trade timeline Every trade from entry to exit, a lane per symbol. |
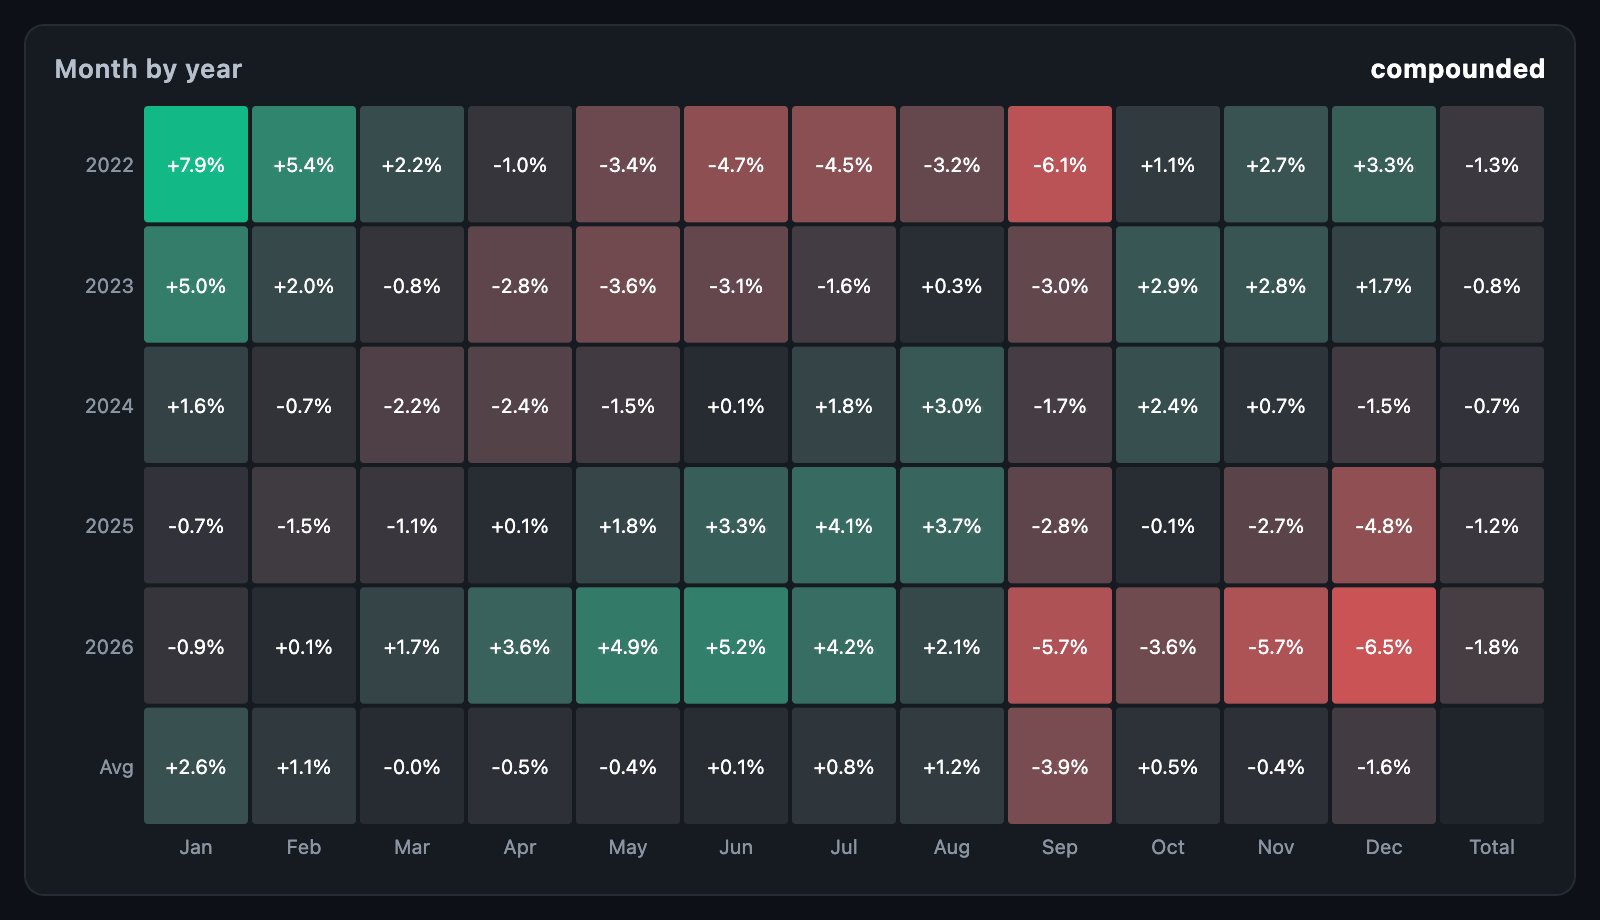 Seasonality Returns by month and year, compounded, with totals and averages. |
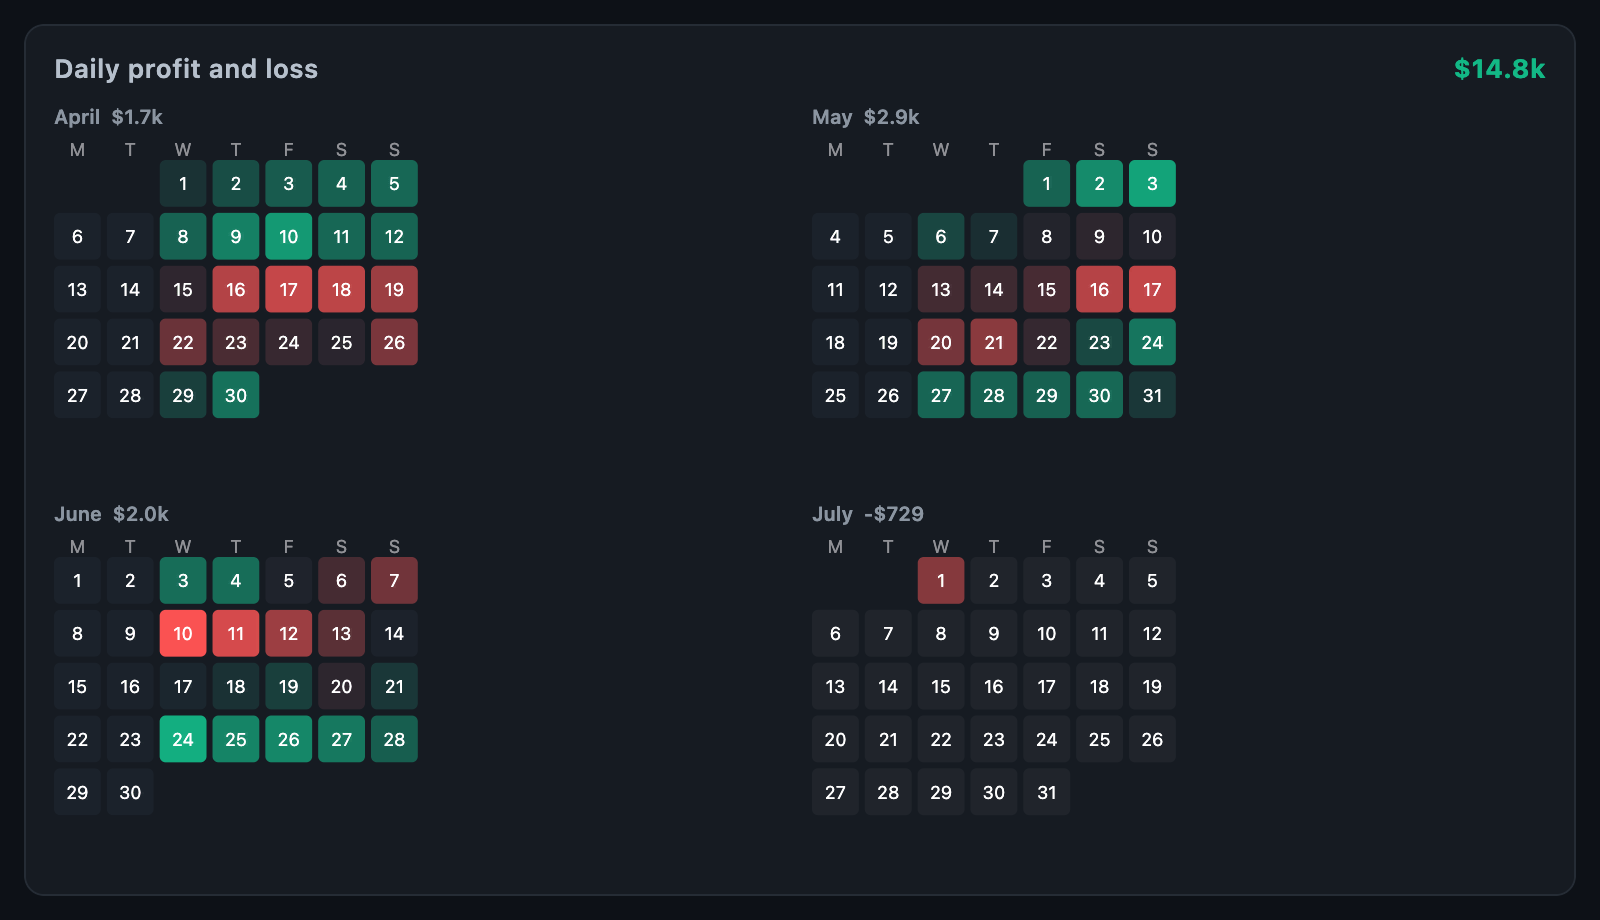 Calendar Daily profit and loss on real month panels. |
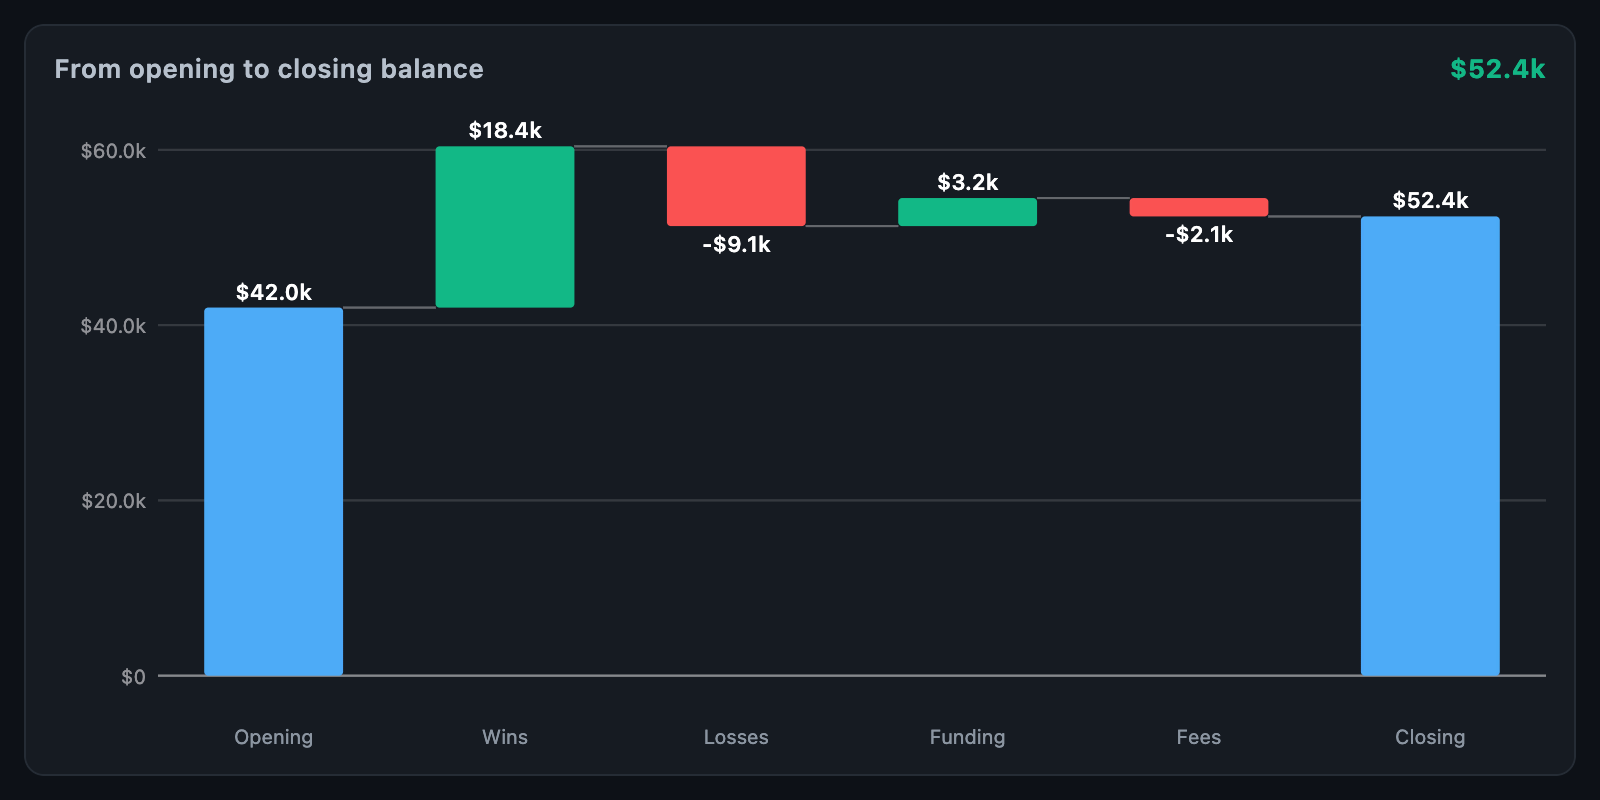 Waterfall A balance built up step by step, from opening to closing. |
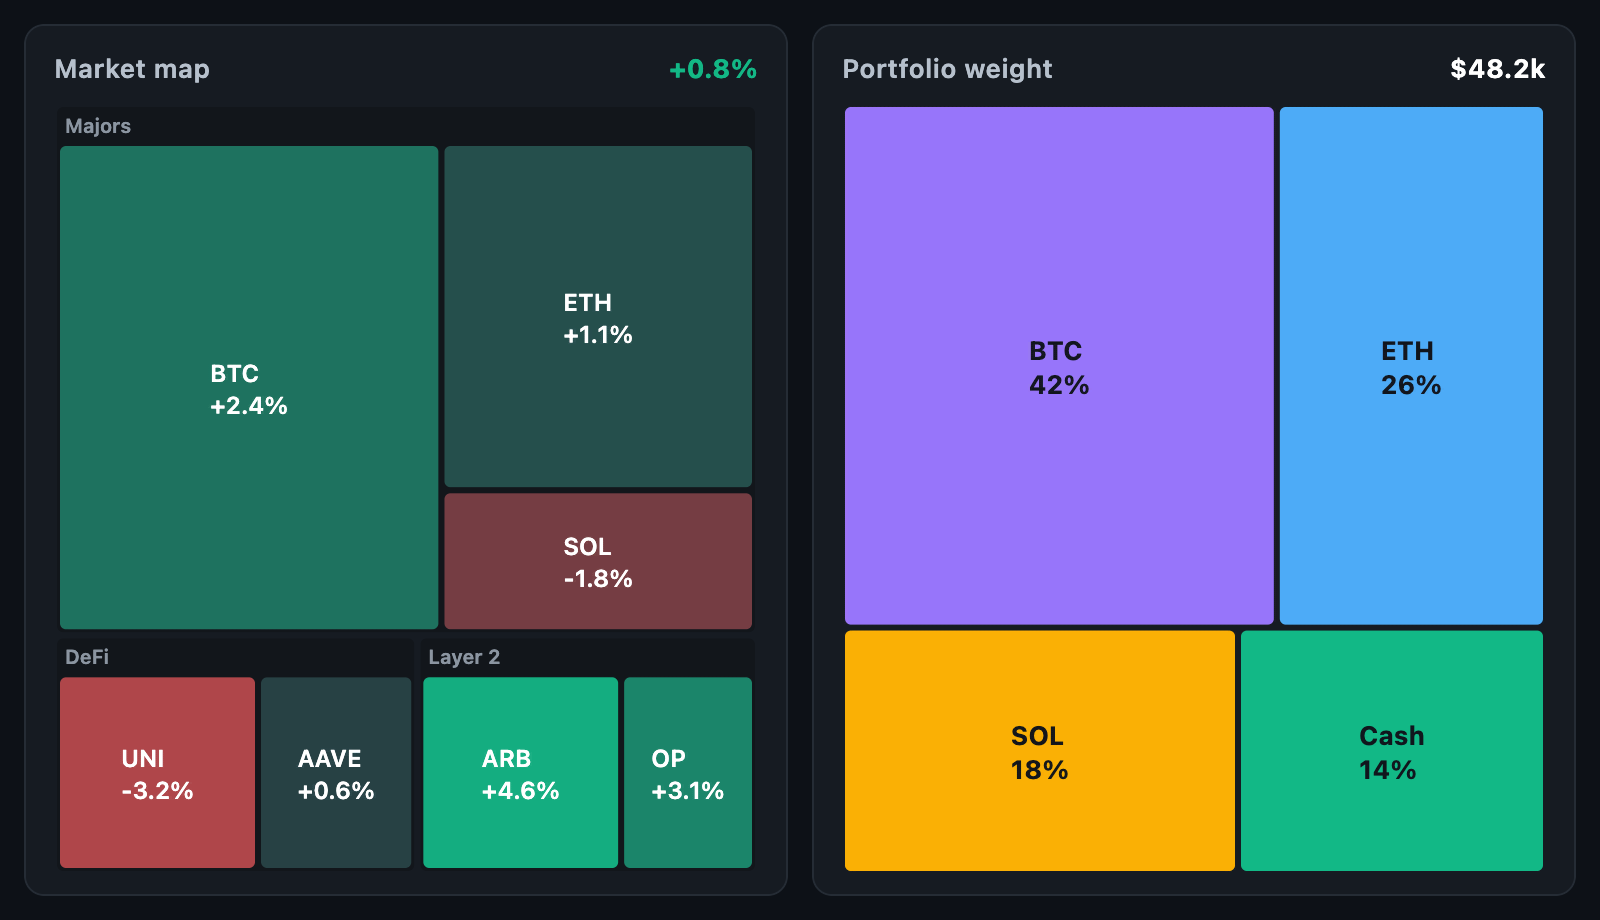 Treemap A market map of sectors and symbols, and portfolio weight. |
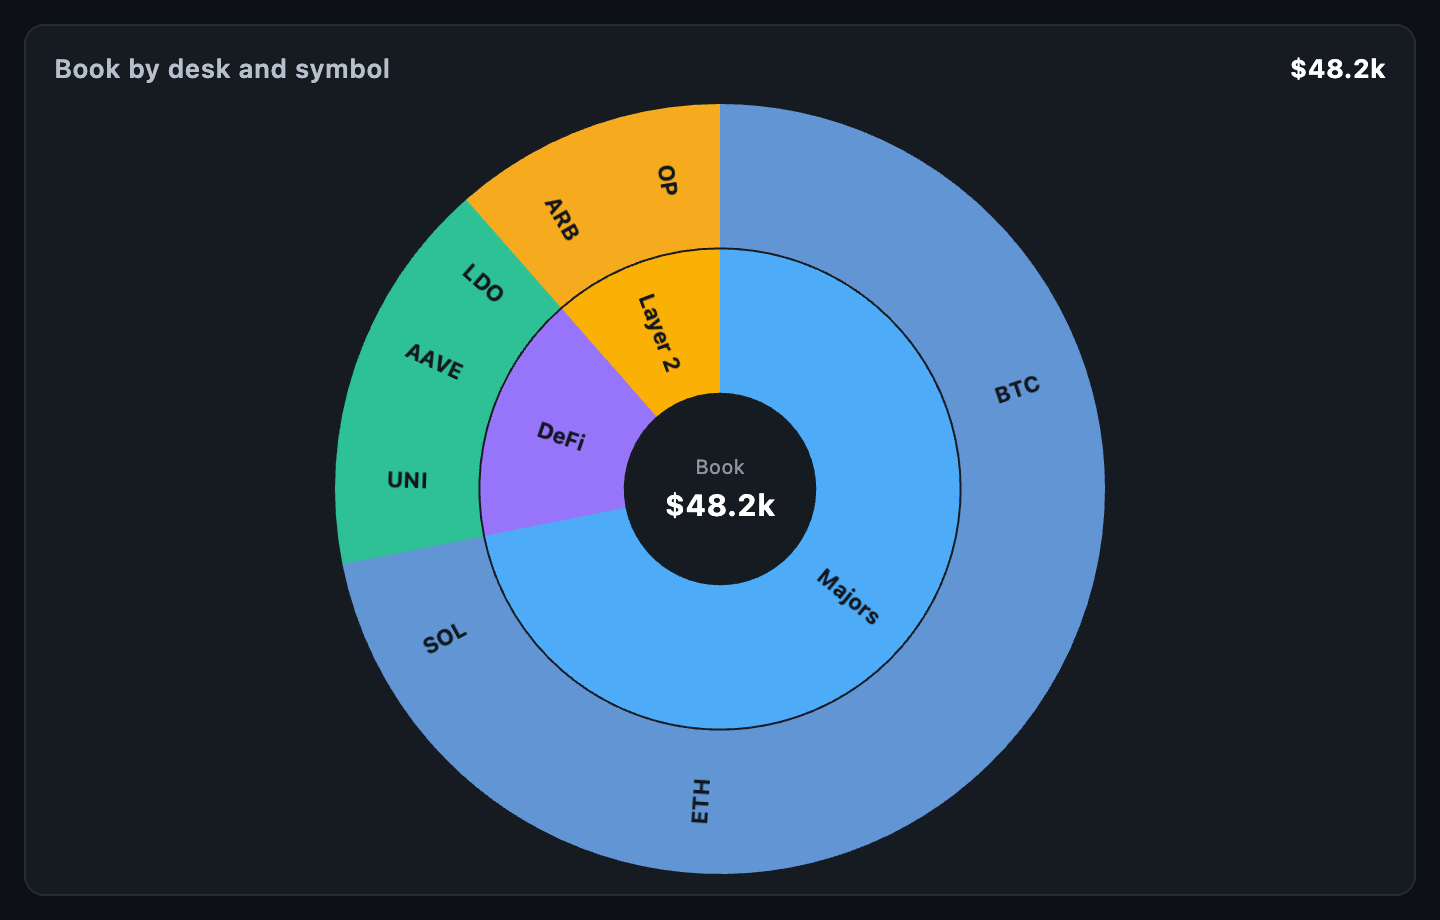 Sunburst A hierarchy as rings, with the total in the middle. |
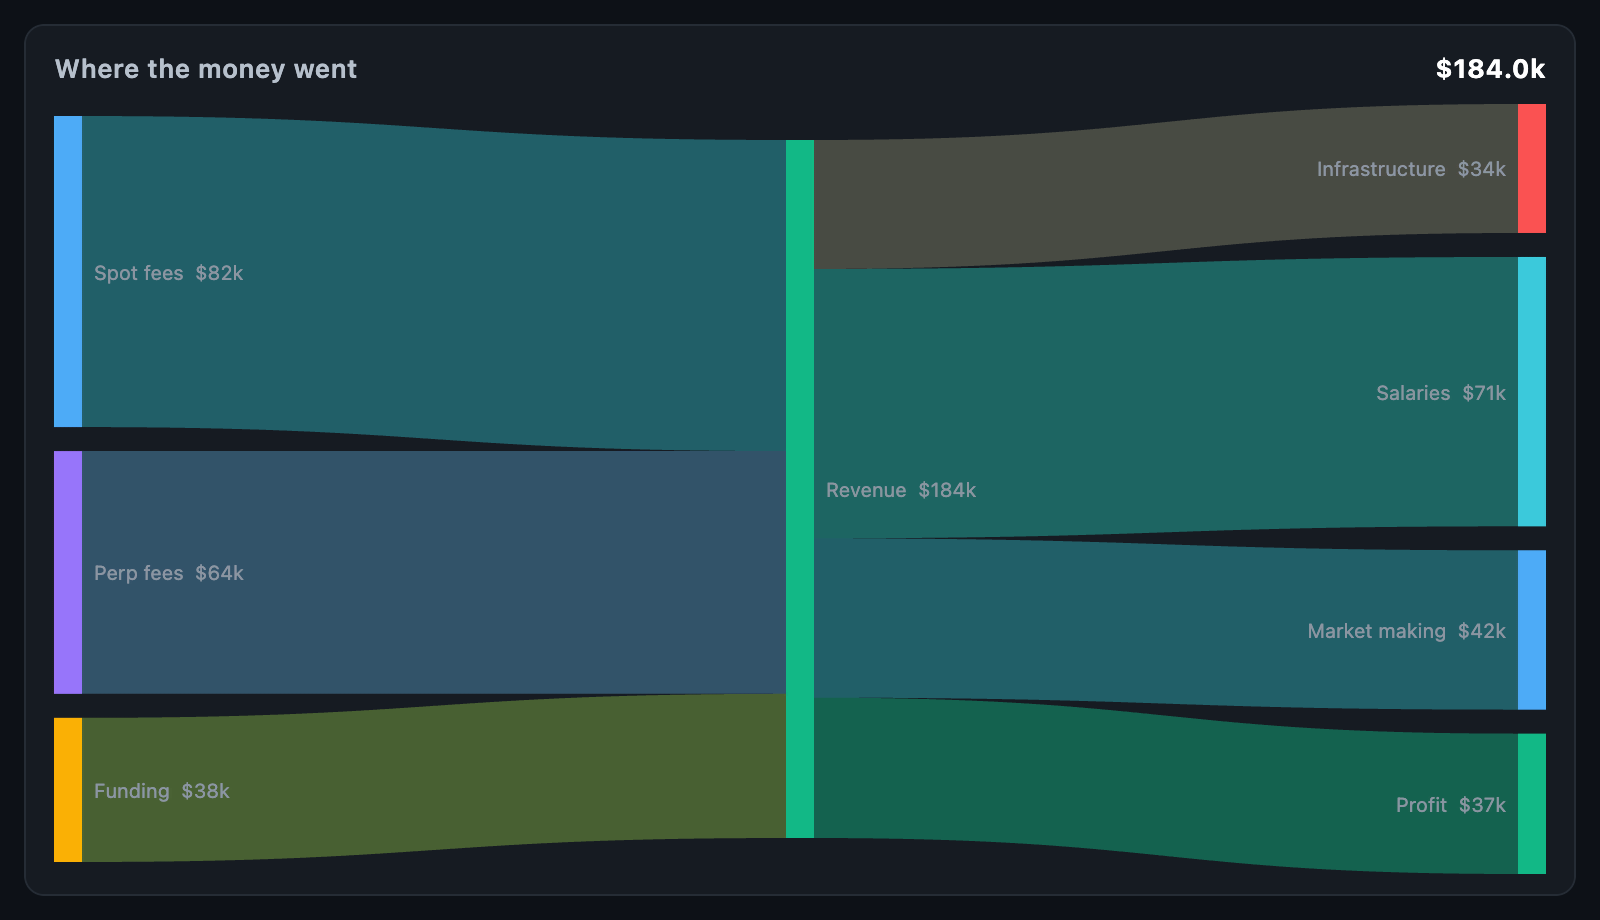 Sankey Fee income flowing through revenue into costs and profit. |
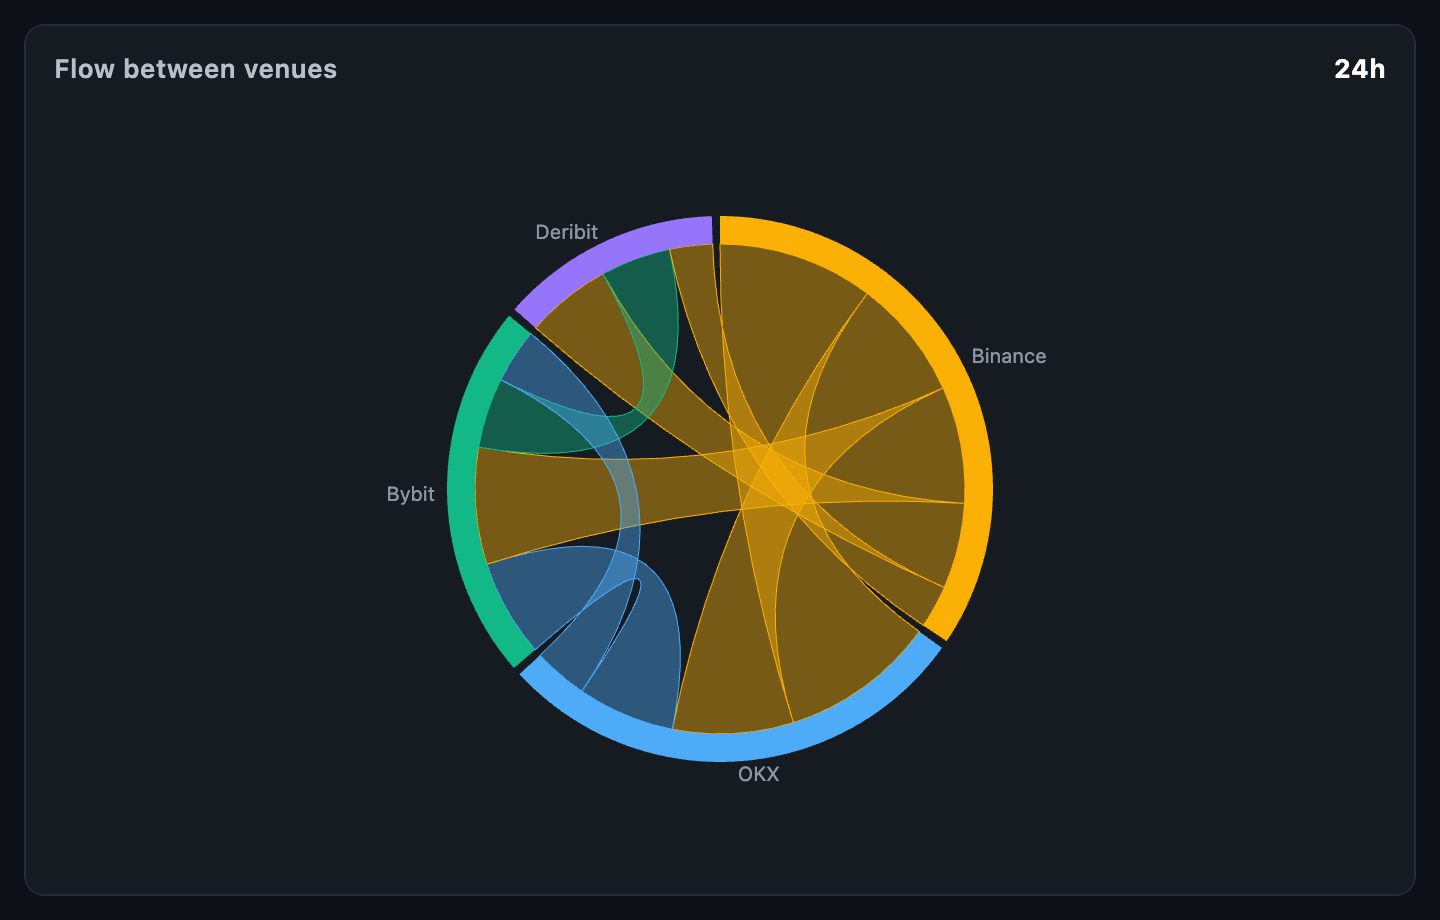 Chord Flow between venues, both ways round a ring. |
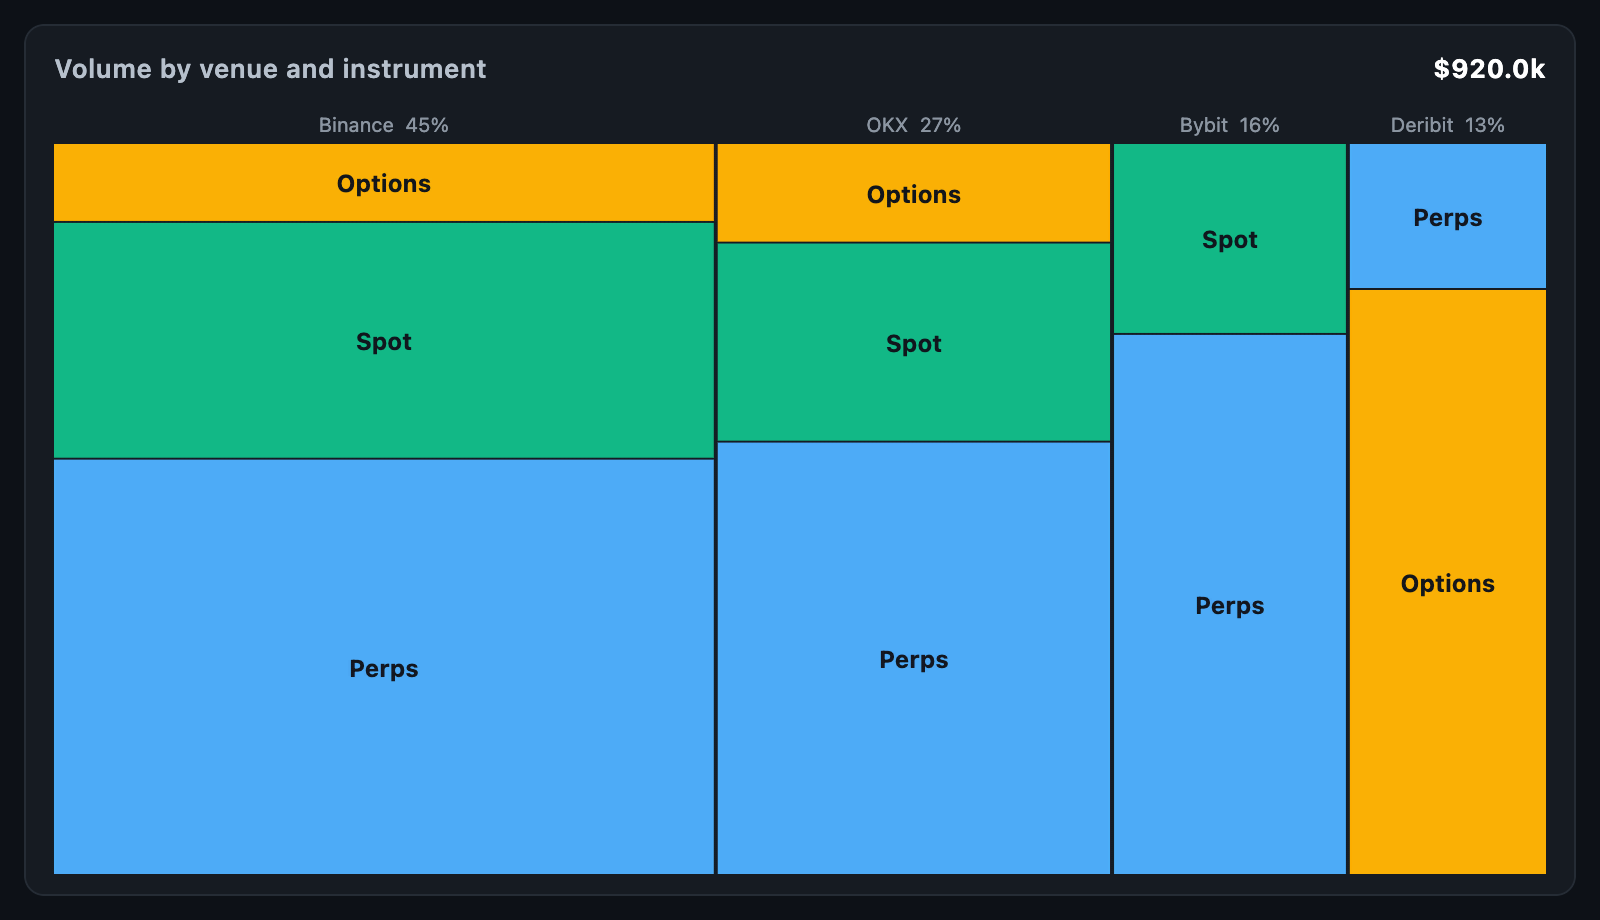 Marimekko Two dimensions at once: column width and cell height. |
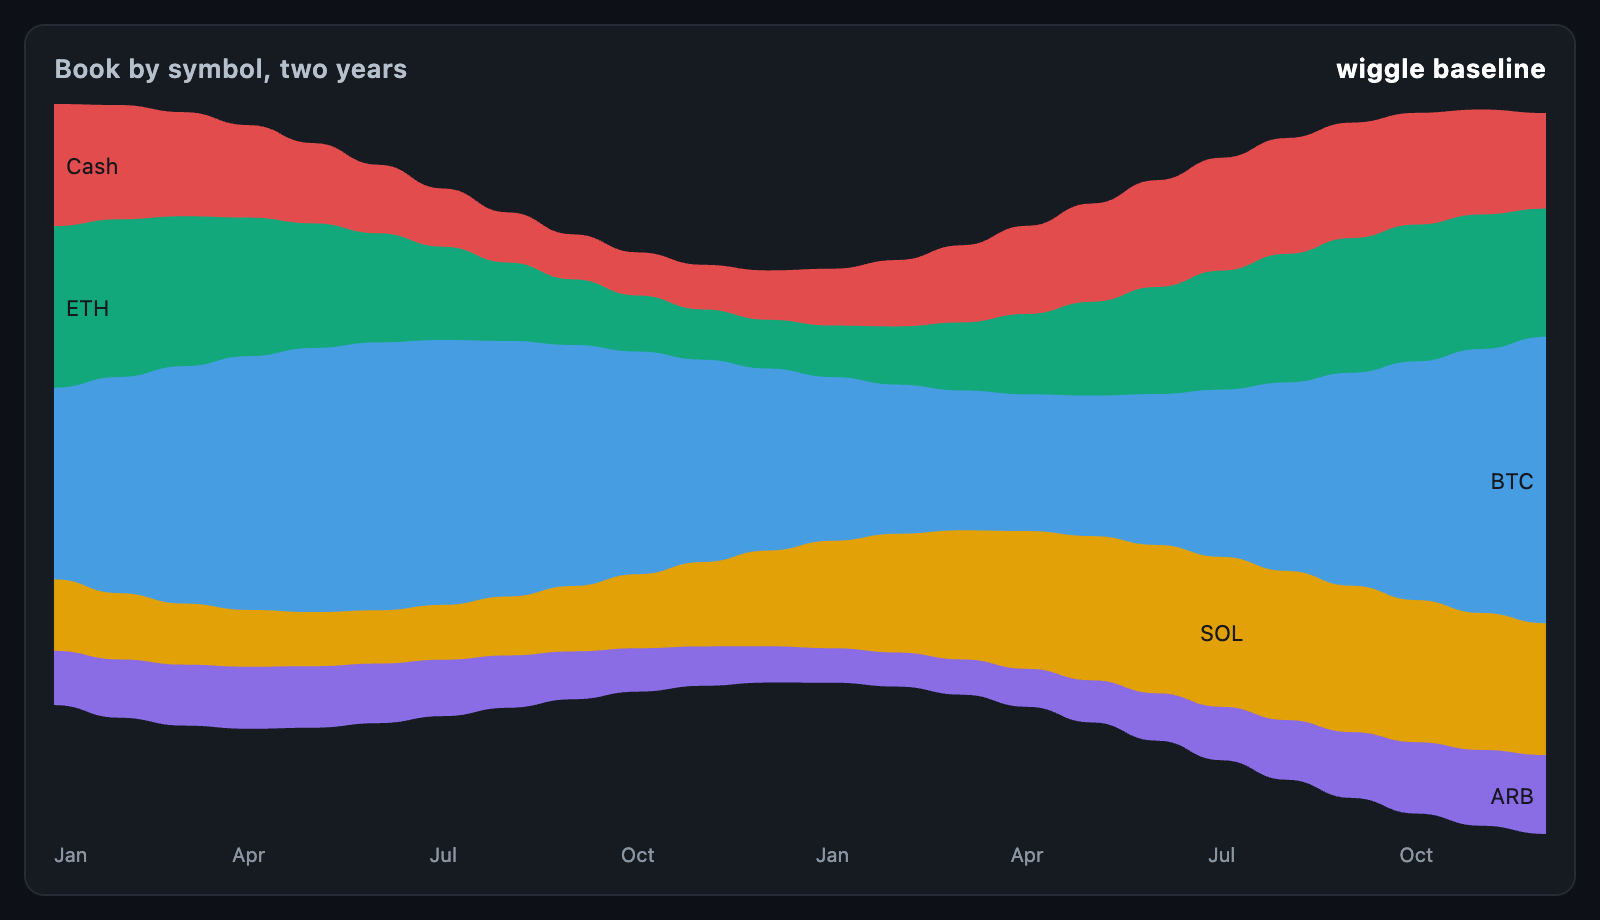 Stream graph Two years of composition, on a wiggle baseline. |
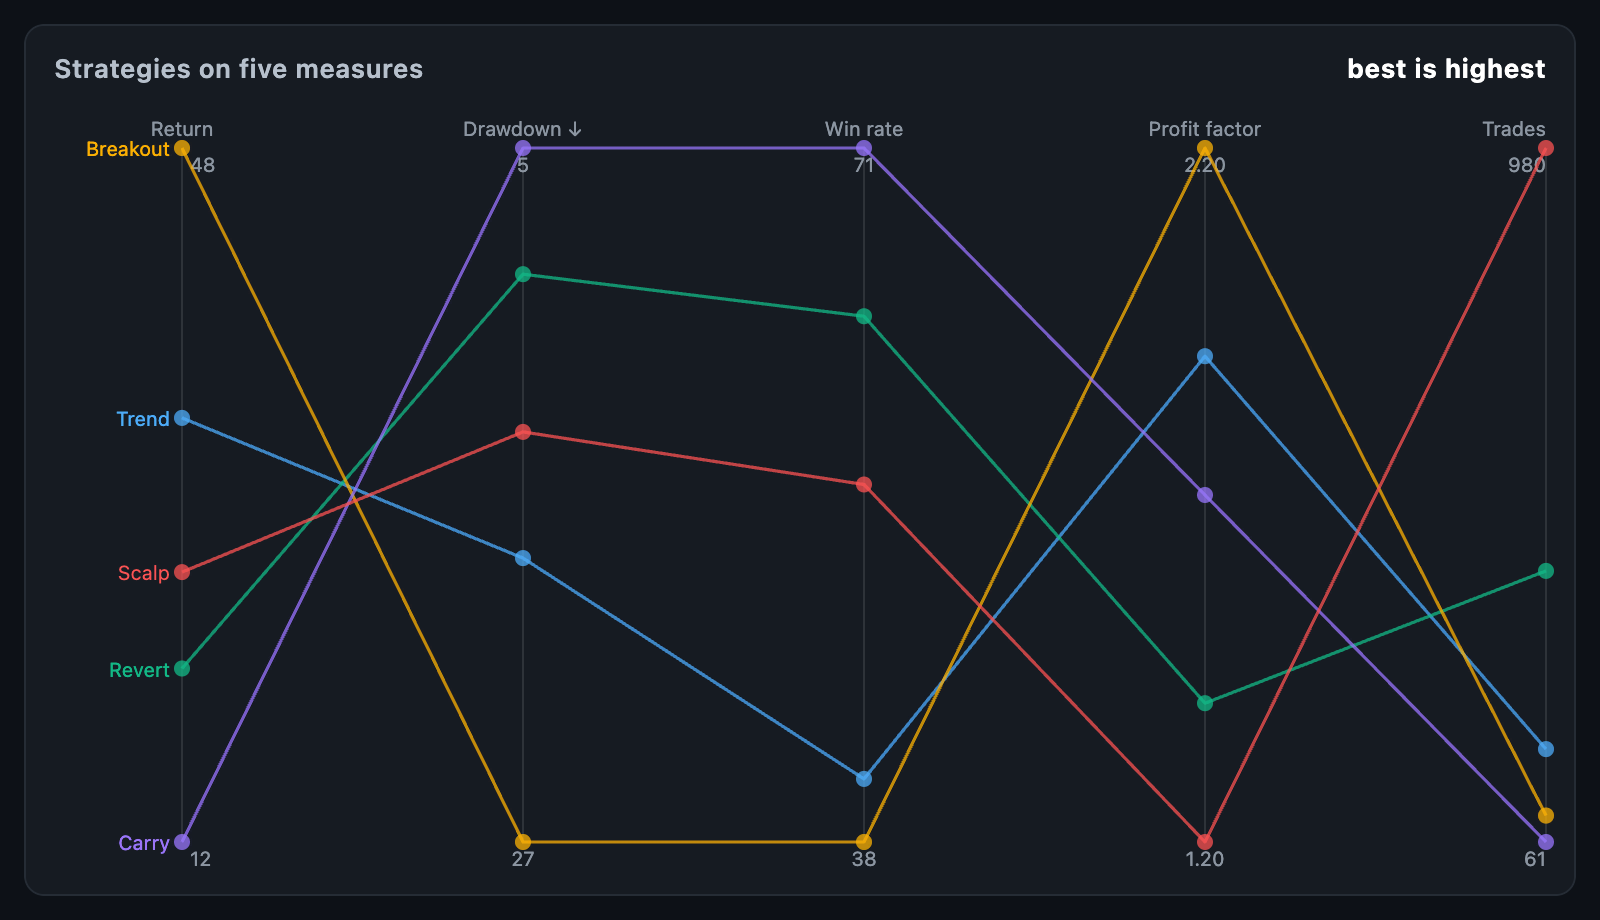 Parallel coordinates Five strategies compared on five measures at once. |
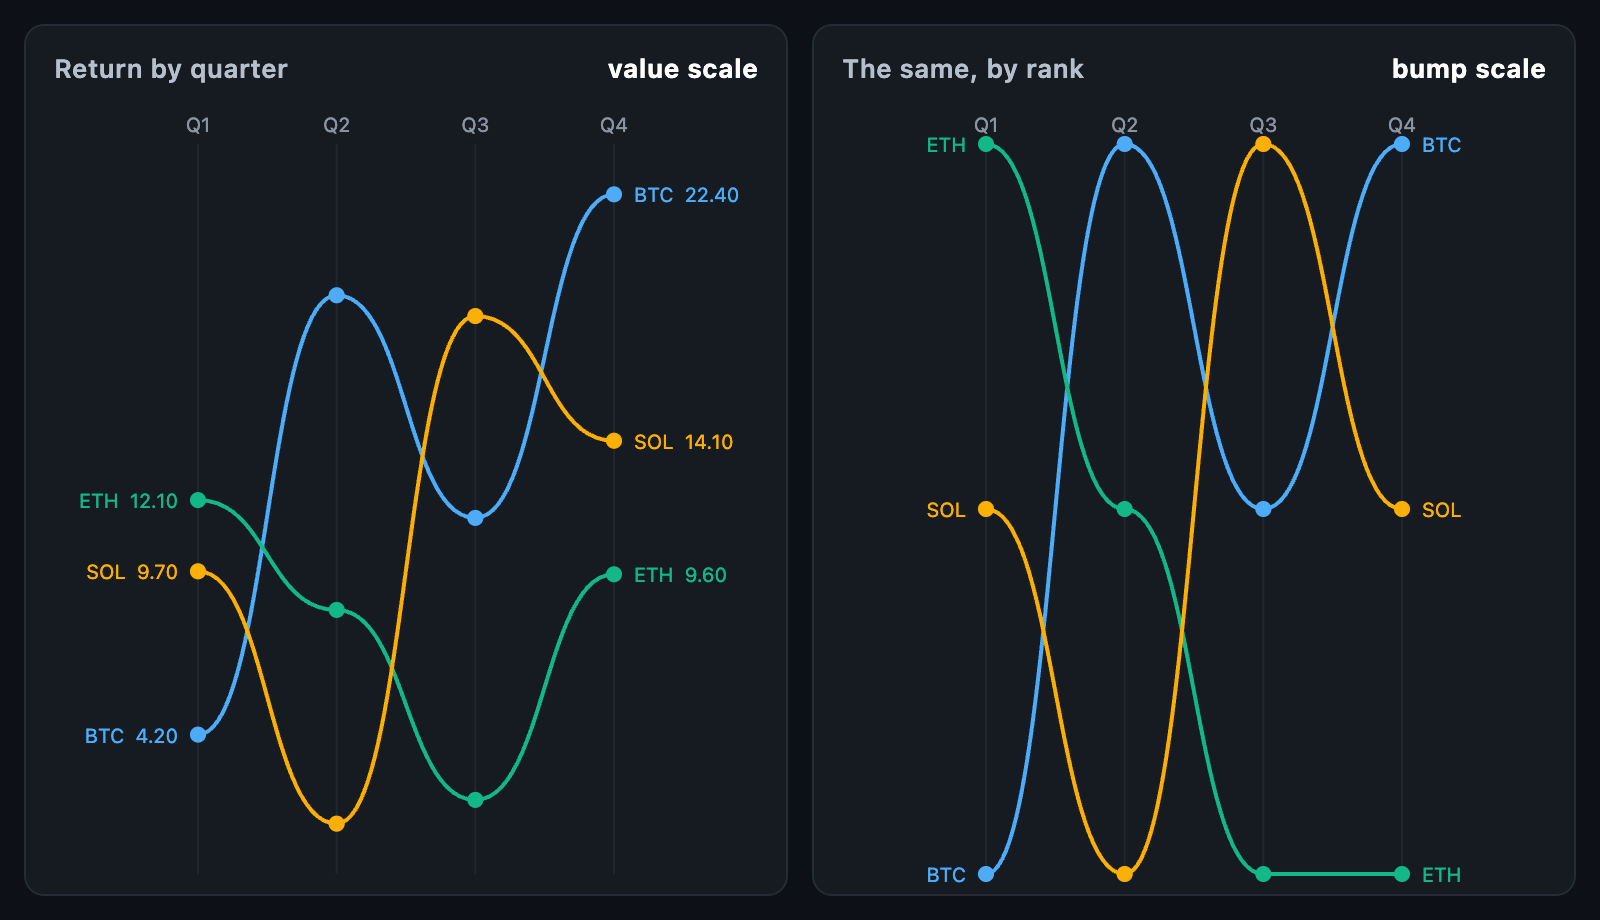 Slope and bump Returns by quarter, by value and by changing rank. |
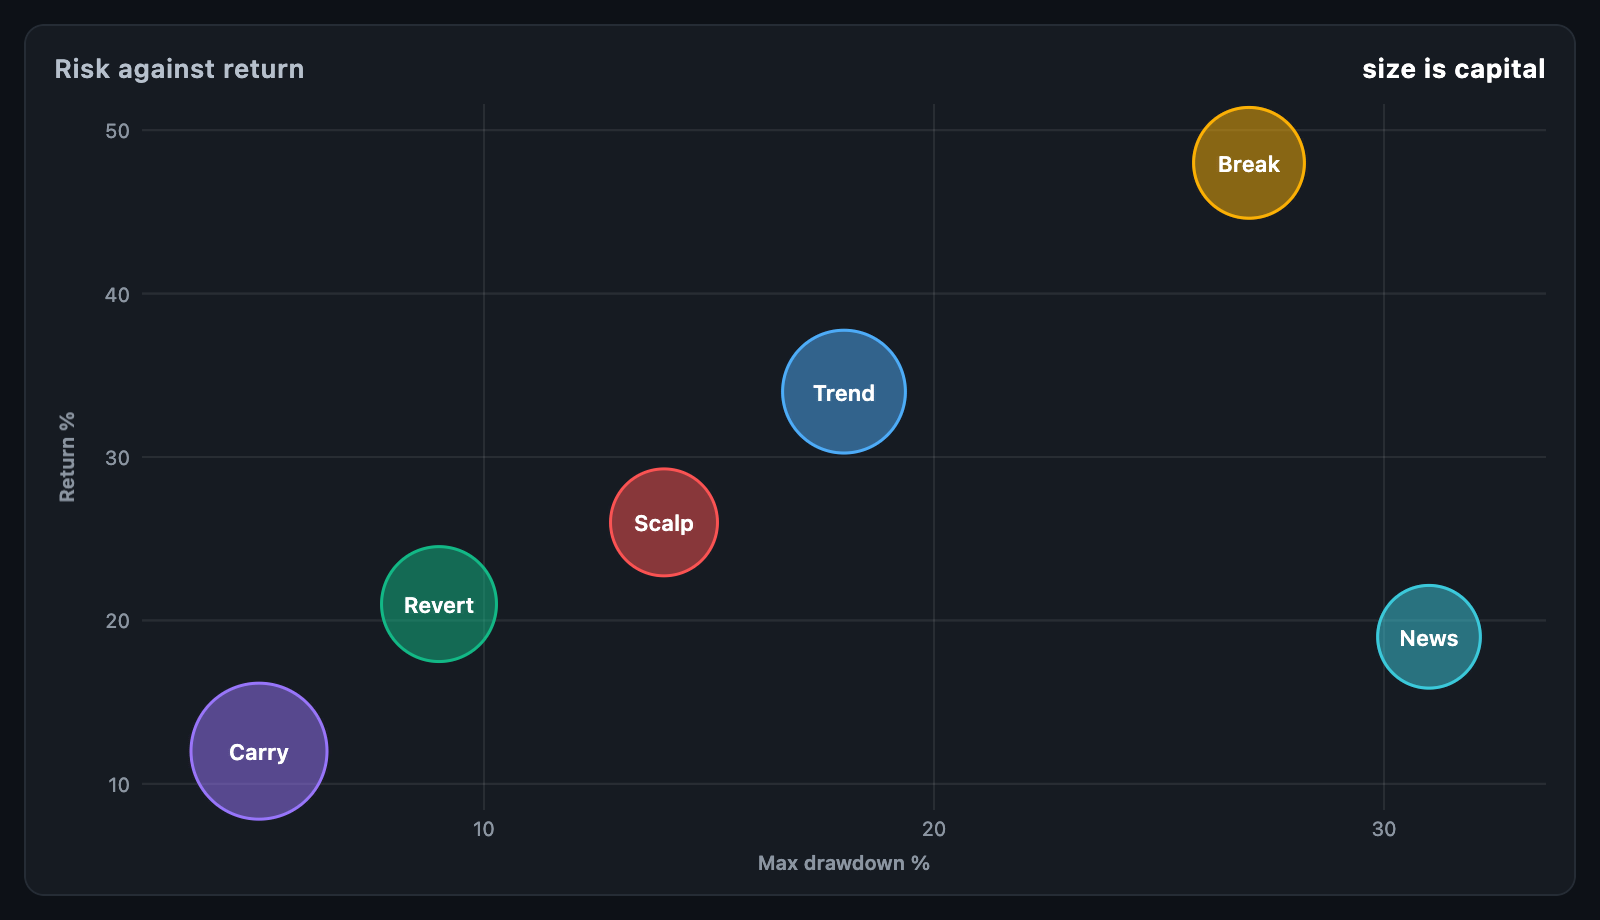 Bubble Risk against return, sized by capital. |
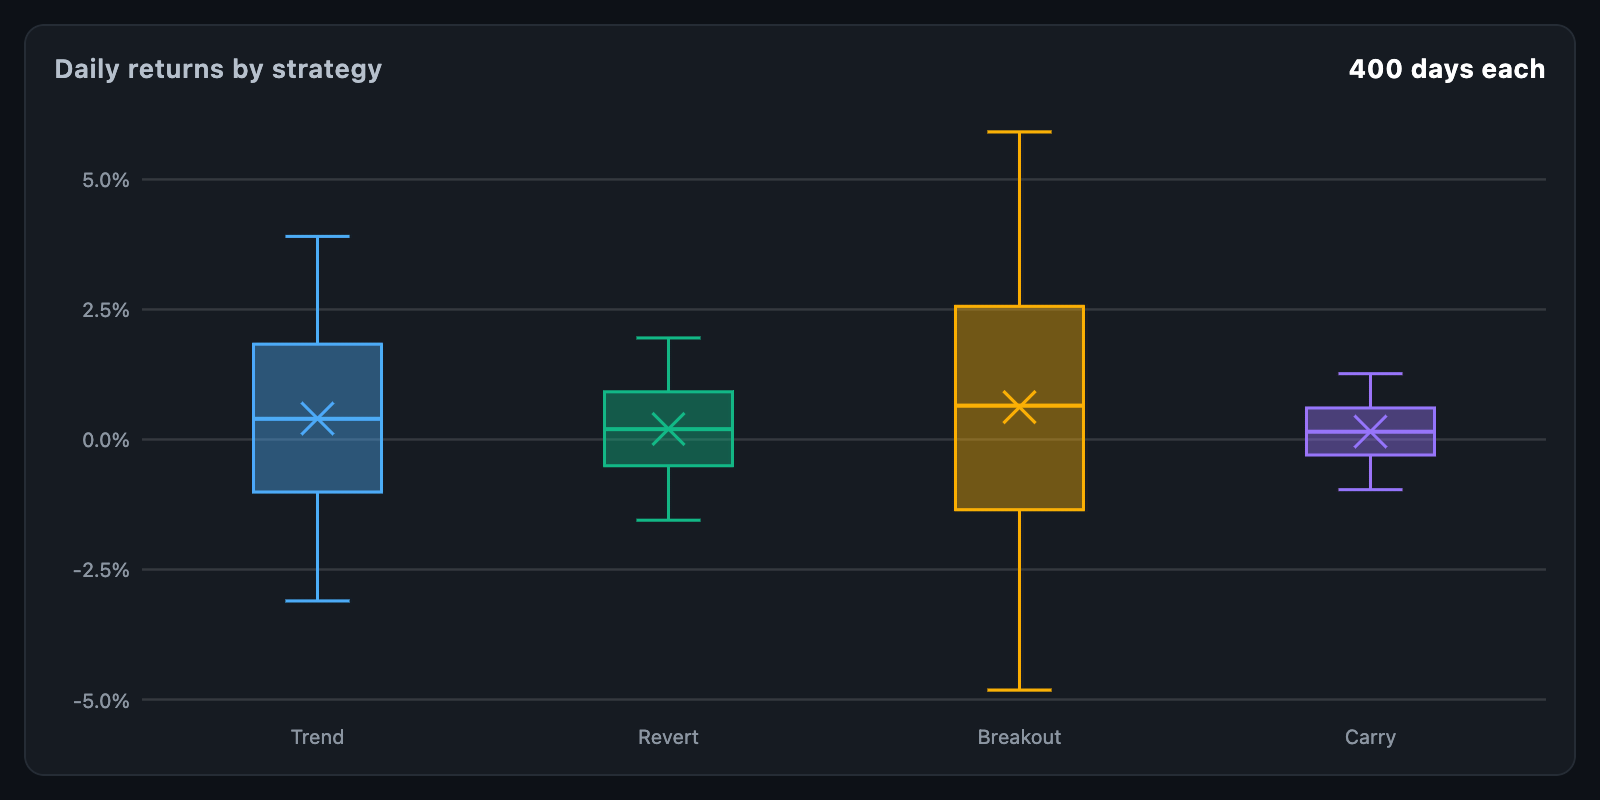 Box plot Quartiles, whiskers and outliers for four strategies. |
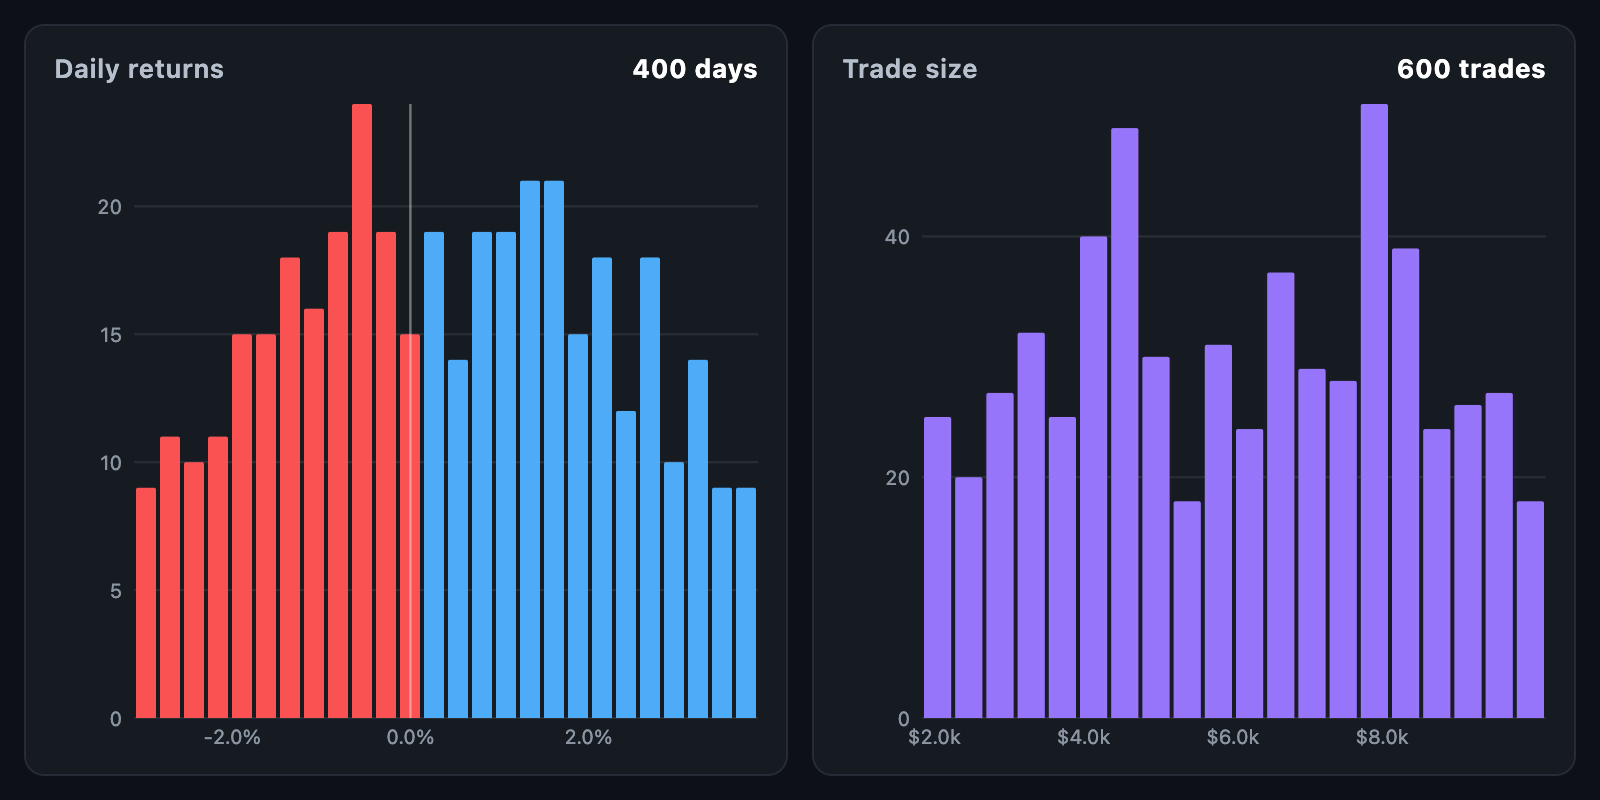 Histogram Daily returns split at zero, and a spread of trade sizes. |
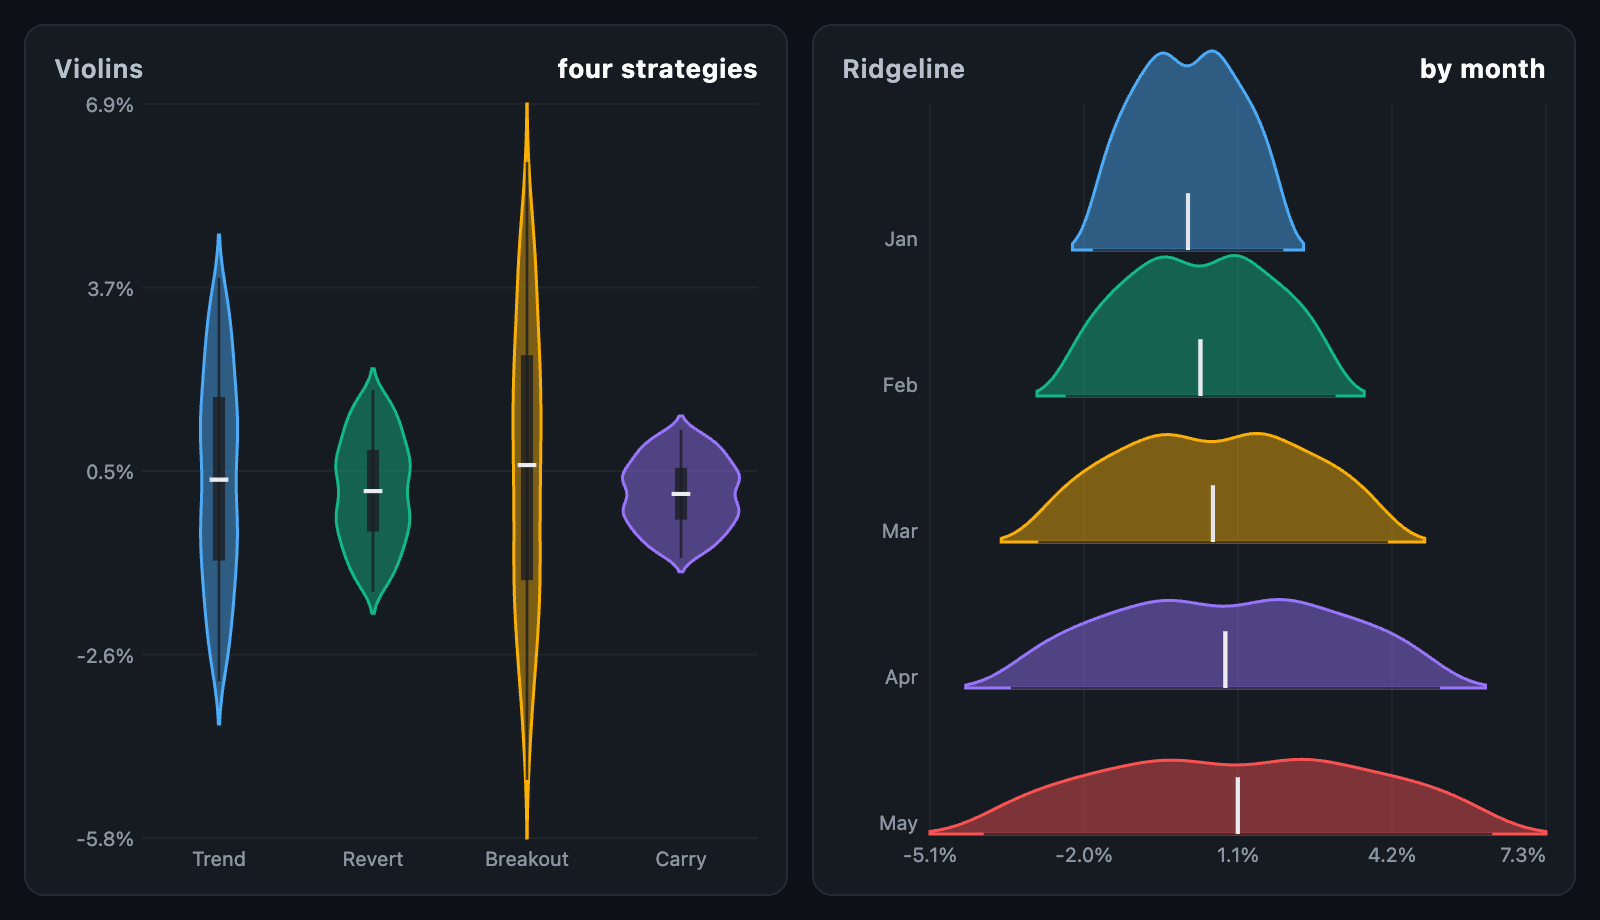 Violin and ridgeline The shape of a distribution, side by side or stacked. |
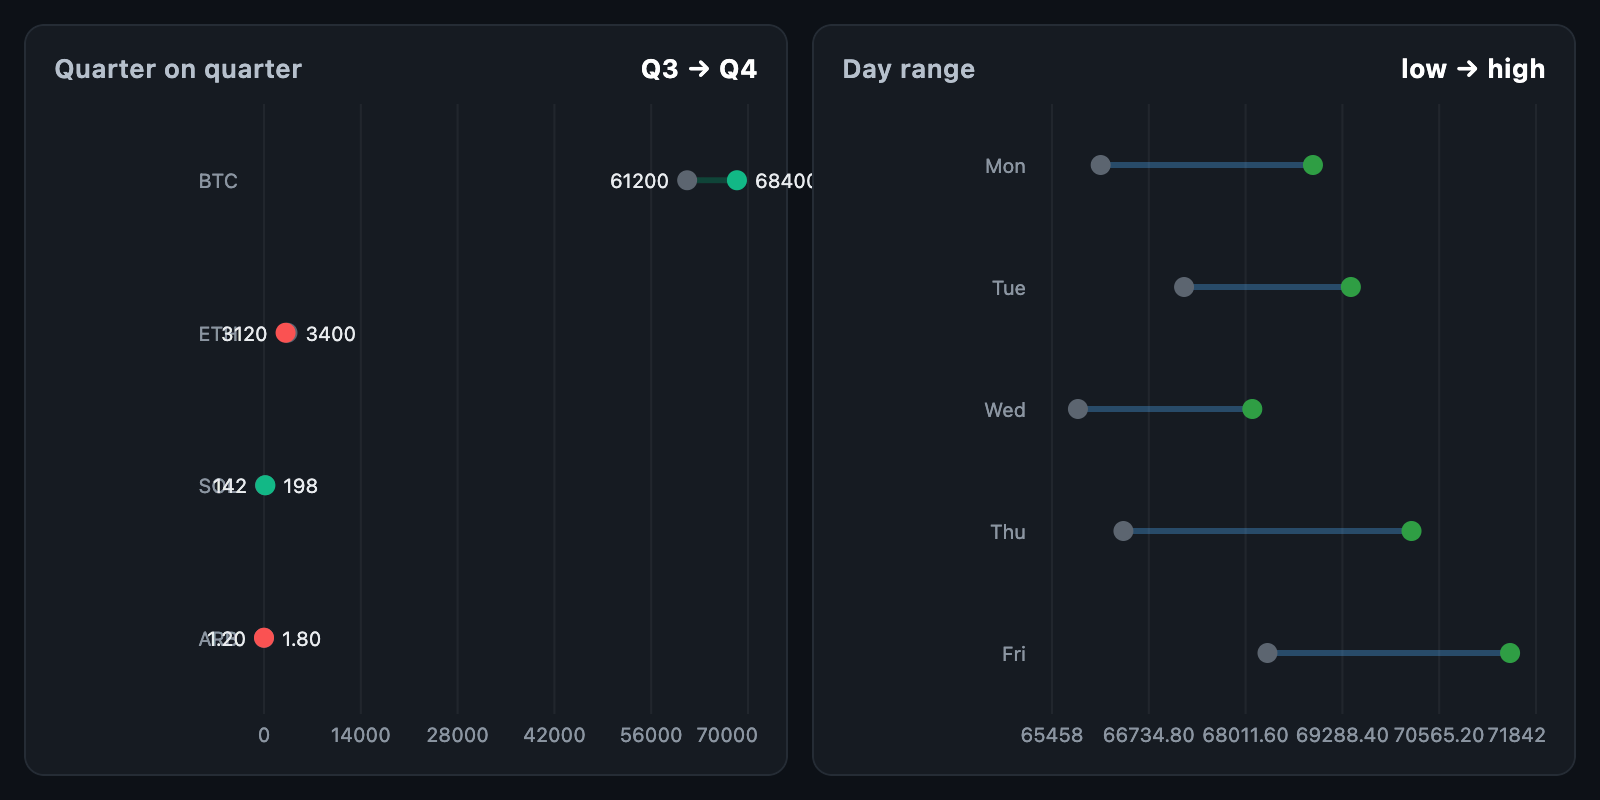 Dumbbell Two values a row, joined by a bar. |
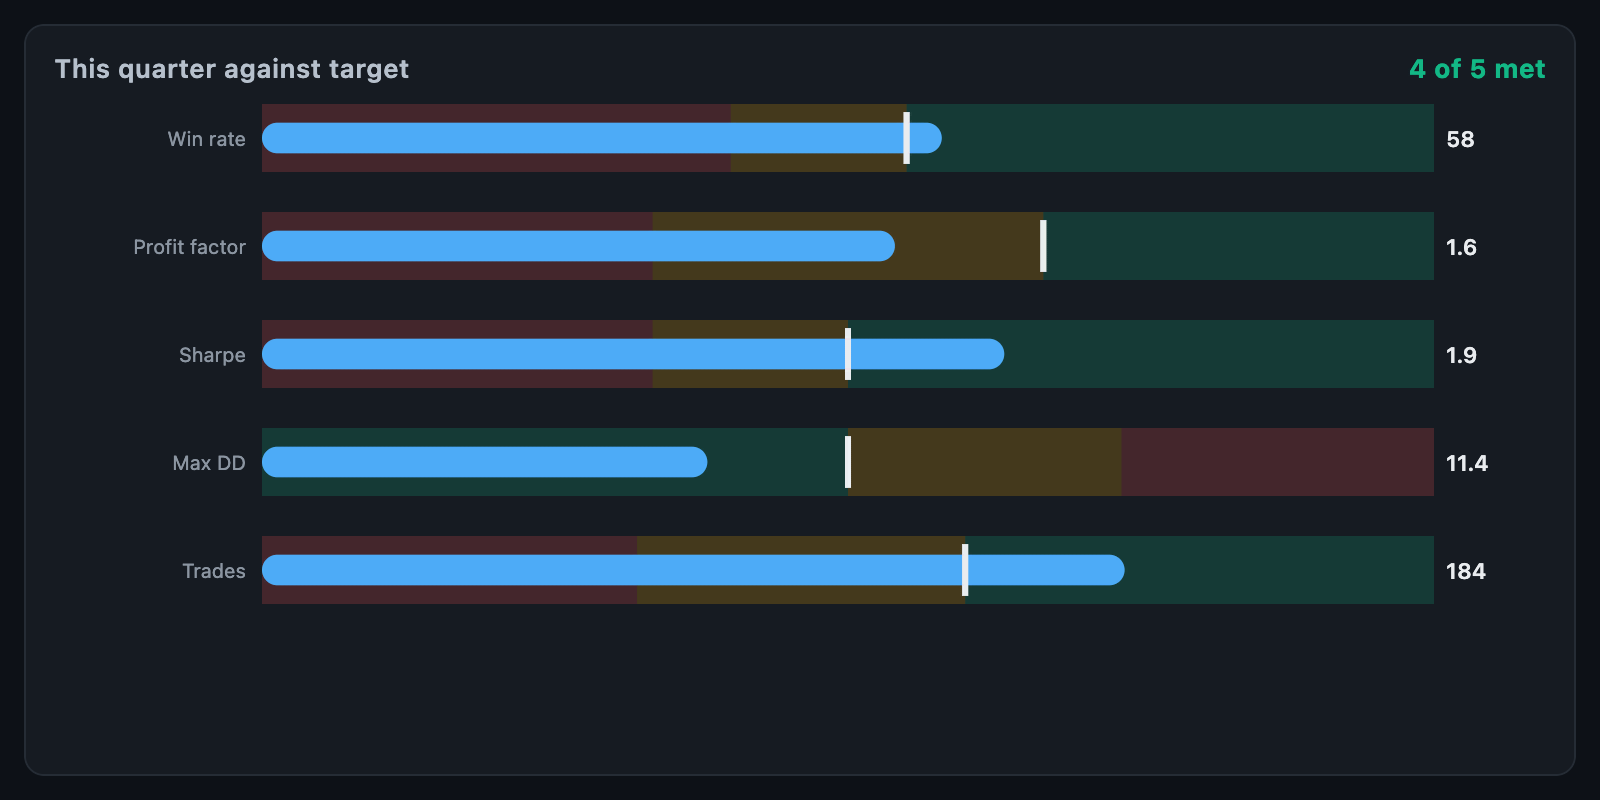 Bullet KPIs against their targets, on banded tracks. |
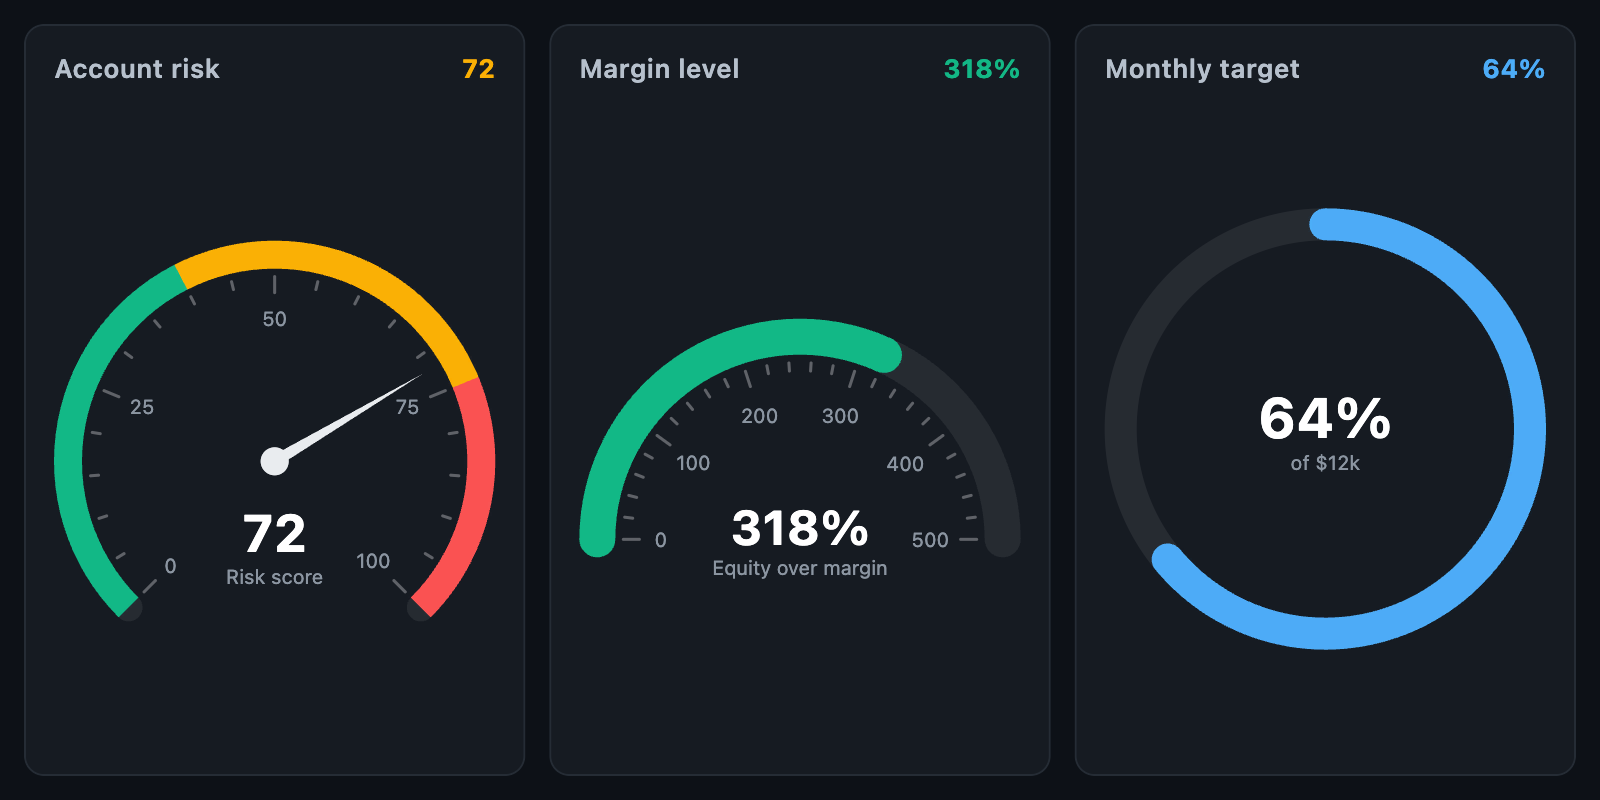 Gauge A dial with coloured ranges, a half circle and a progress ring. |
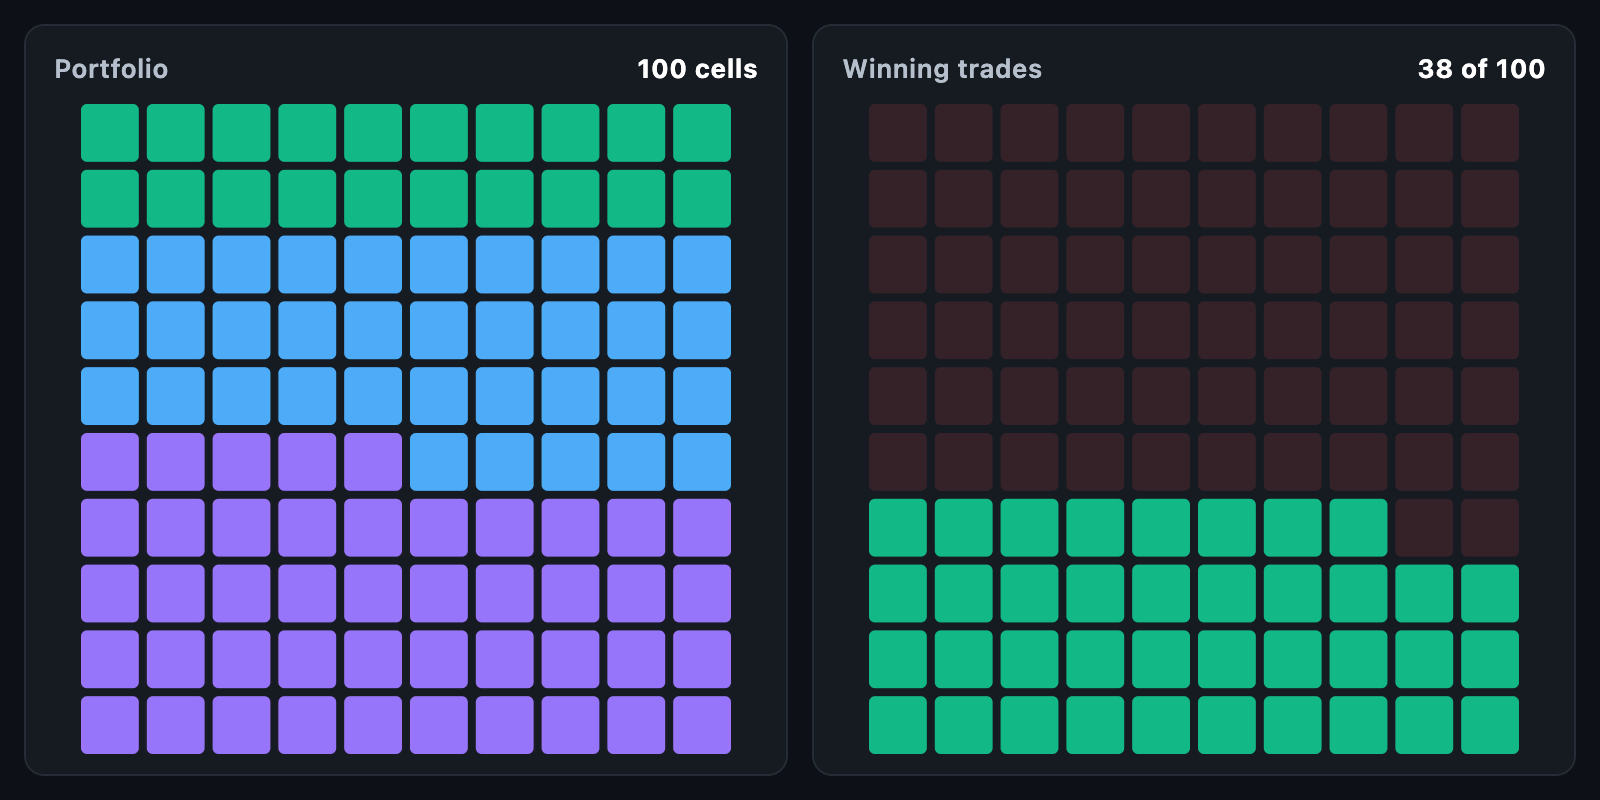 Waffle Shares as a hundred squares, counted rather than judged. |
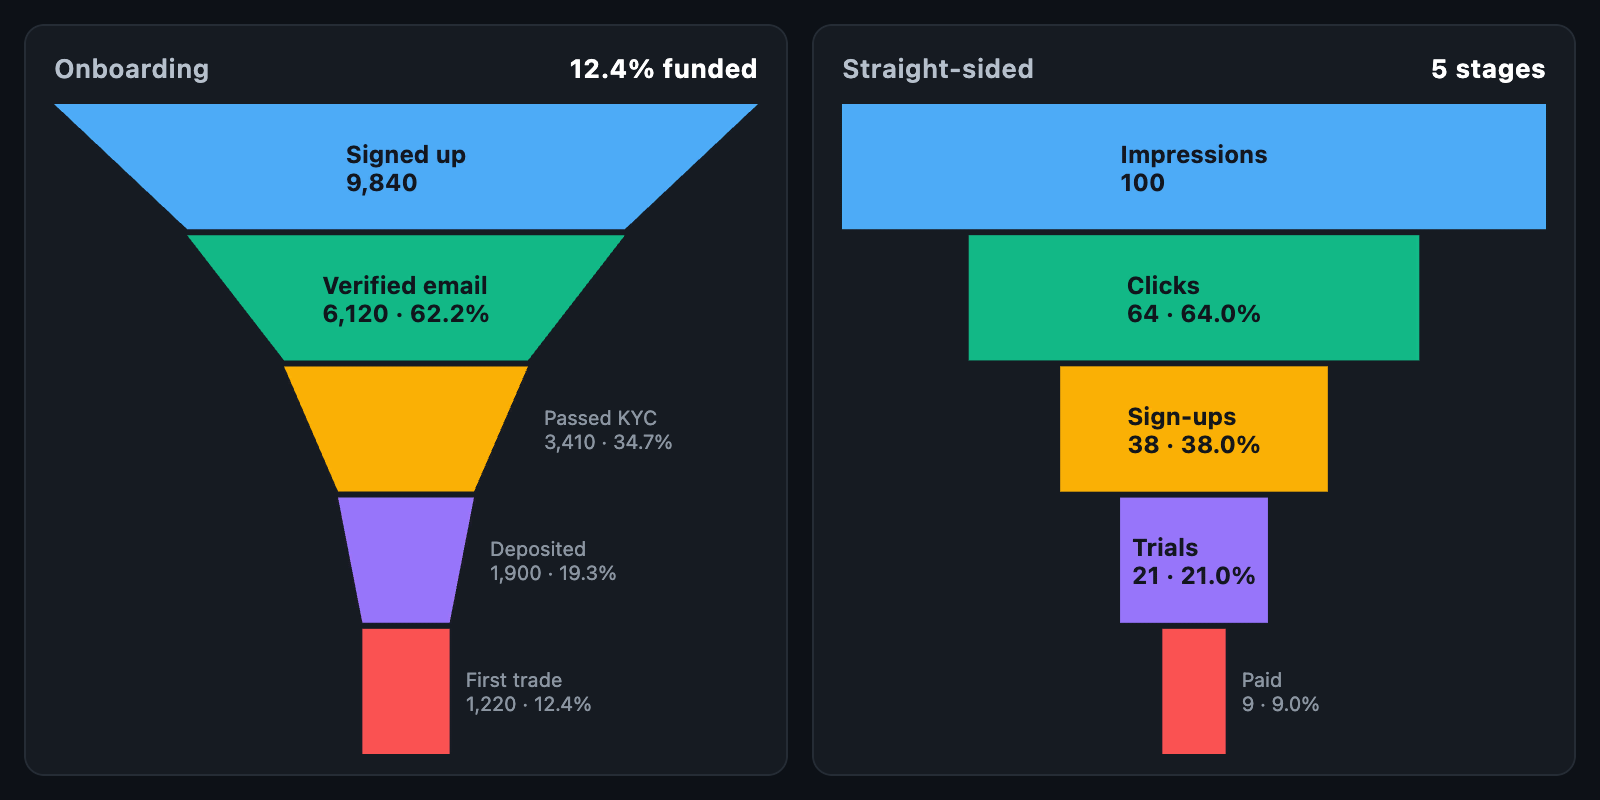 Funnel Where the people go, tapered or straight-sided. |
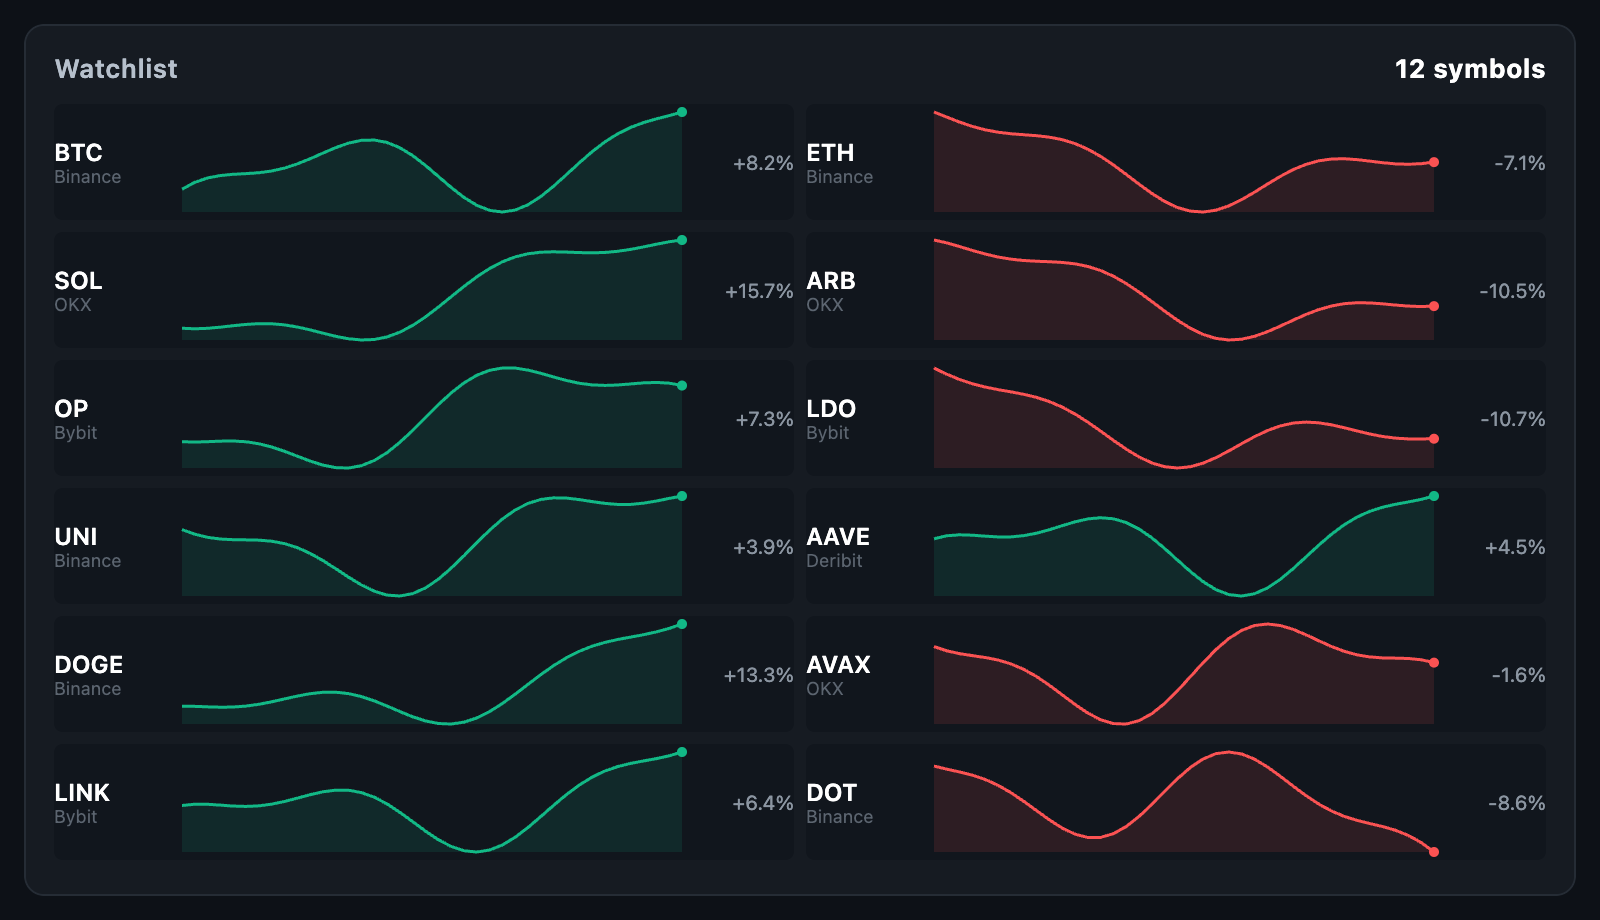 Sparkline grid A watchlist of small multiples, a name and a shape each. |
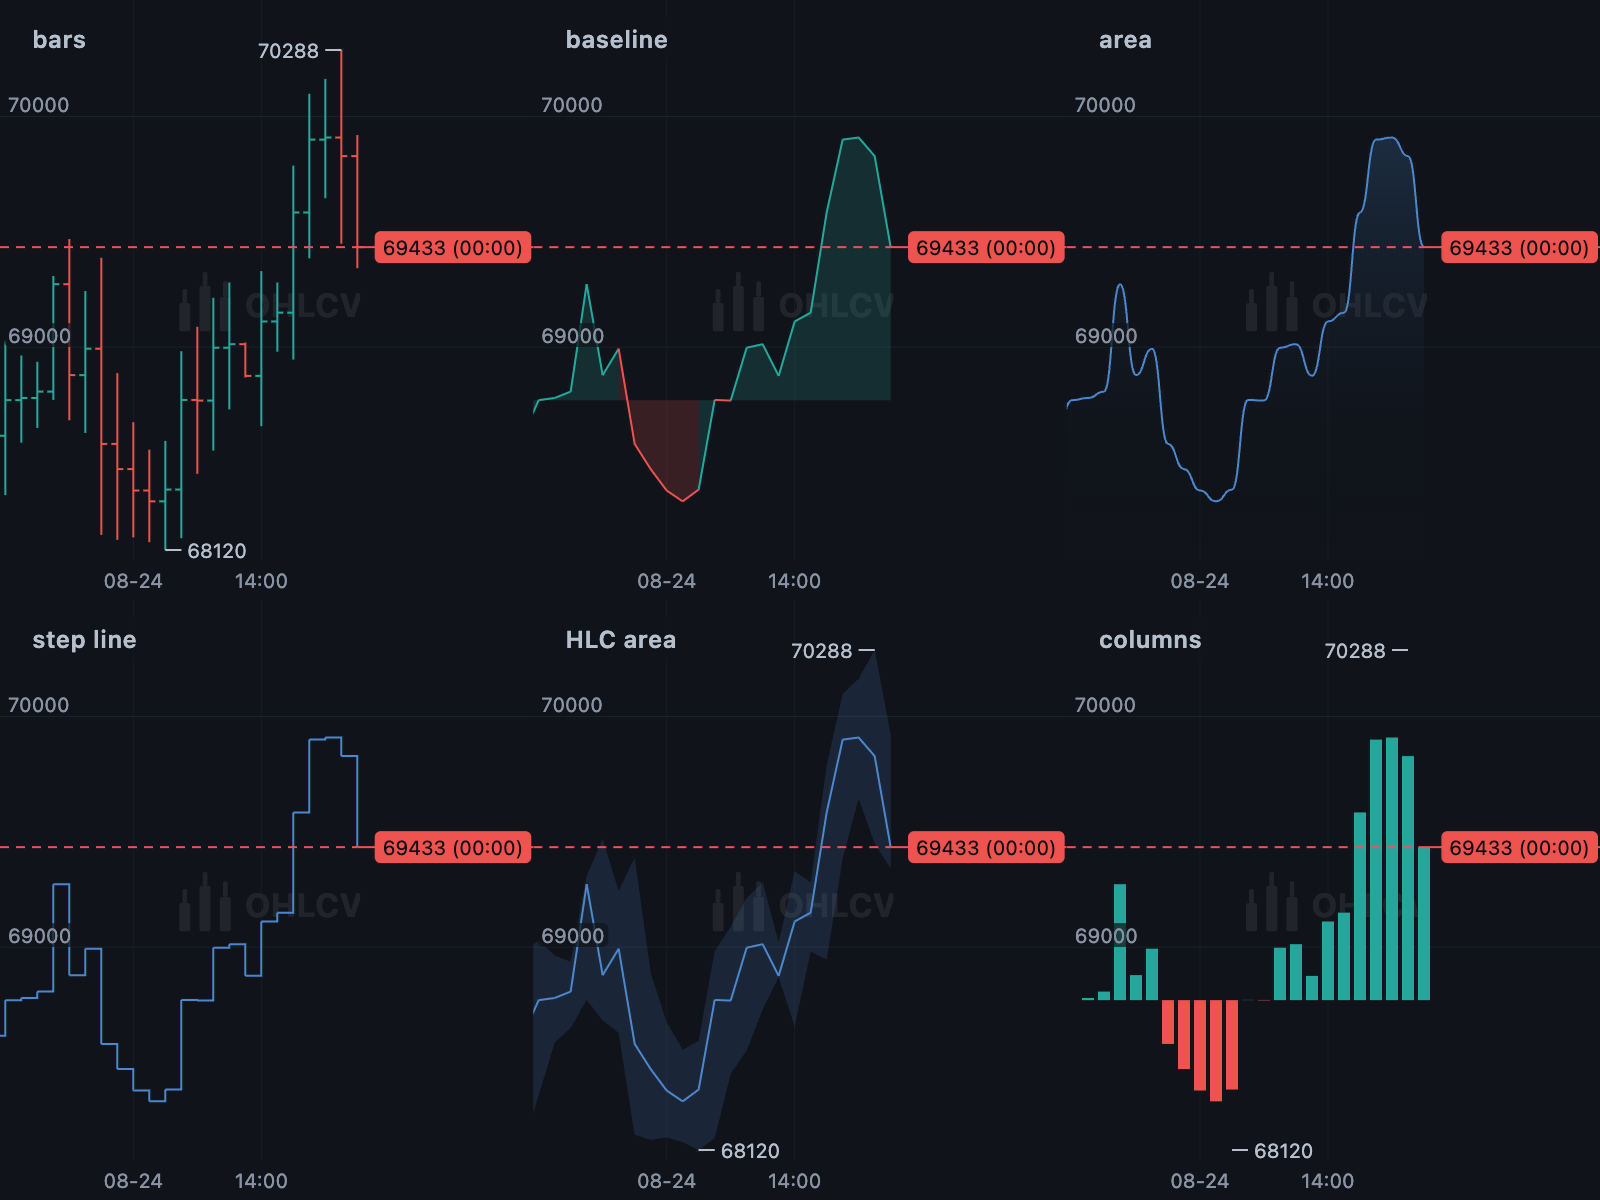 Eight chart types OHLC bars, baseline, area, step line, HLC area and columns. |
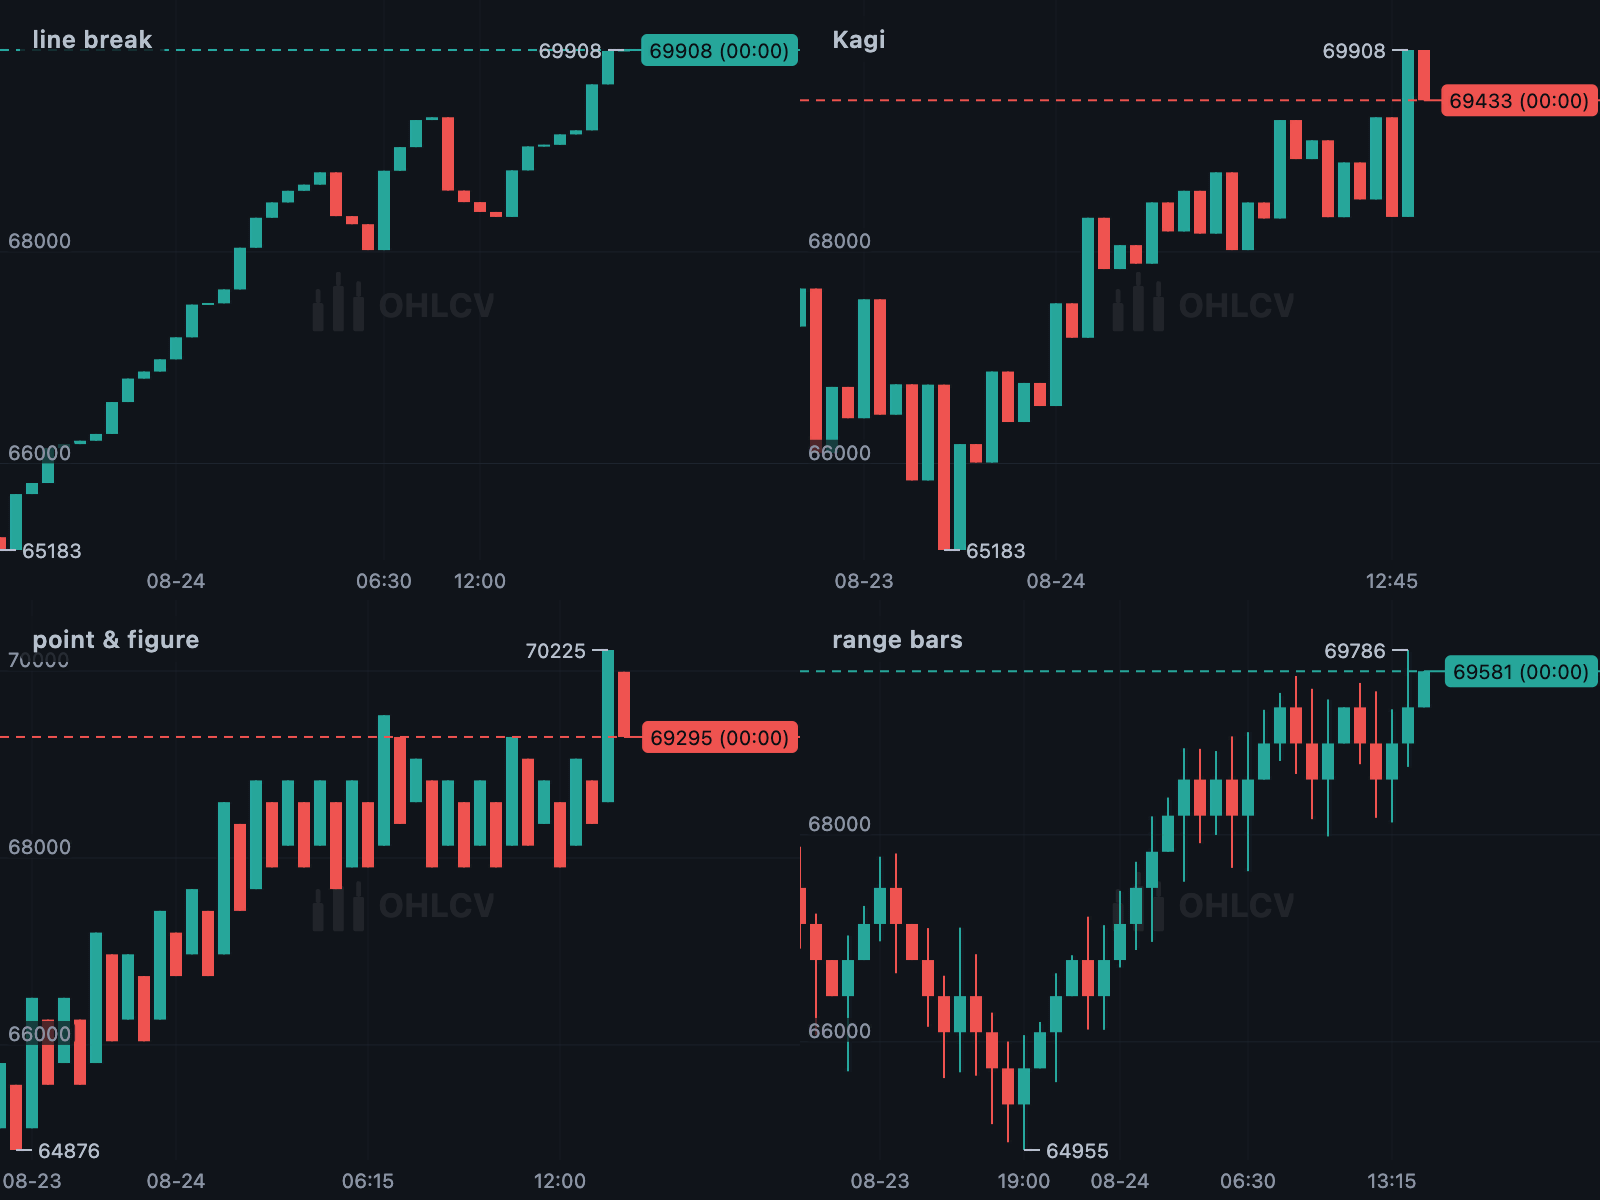 Four bar transforms Line break, Kagi, point & figure and range bars. |
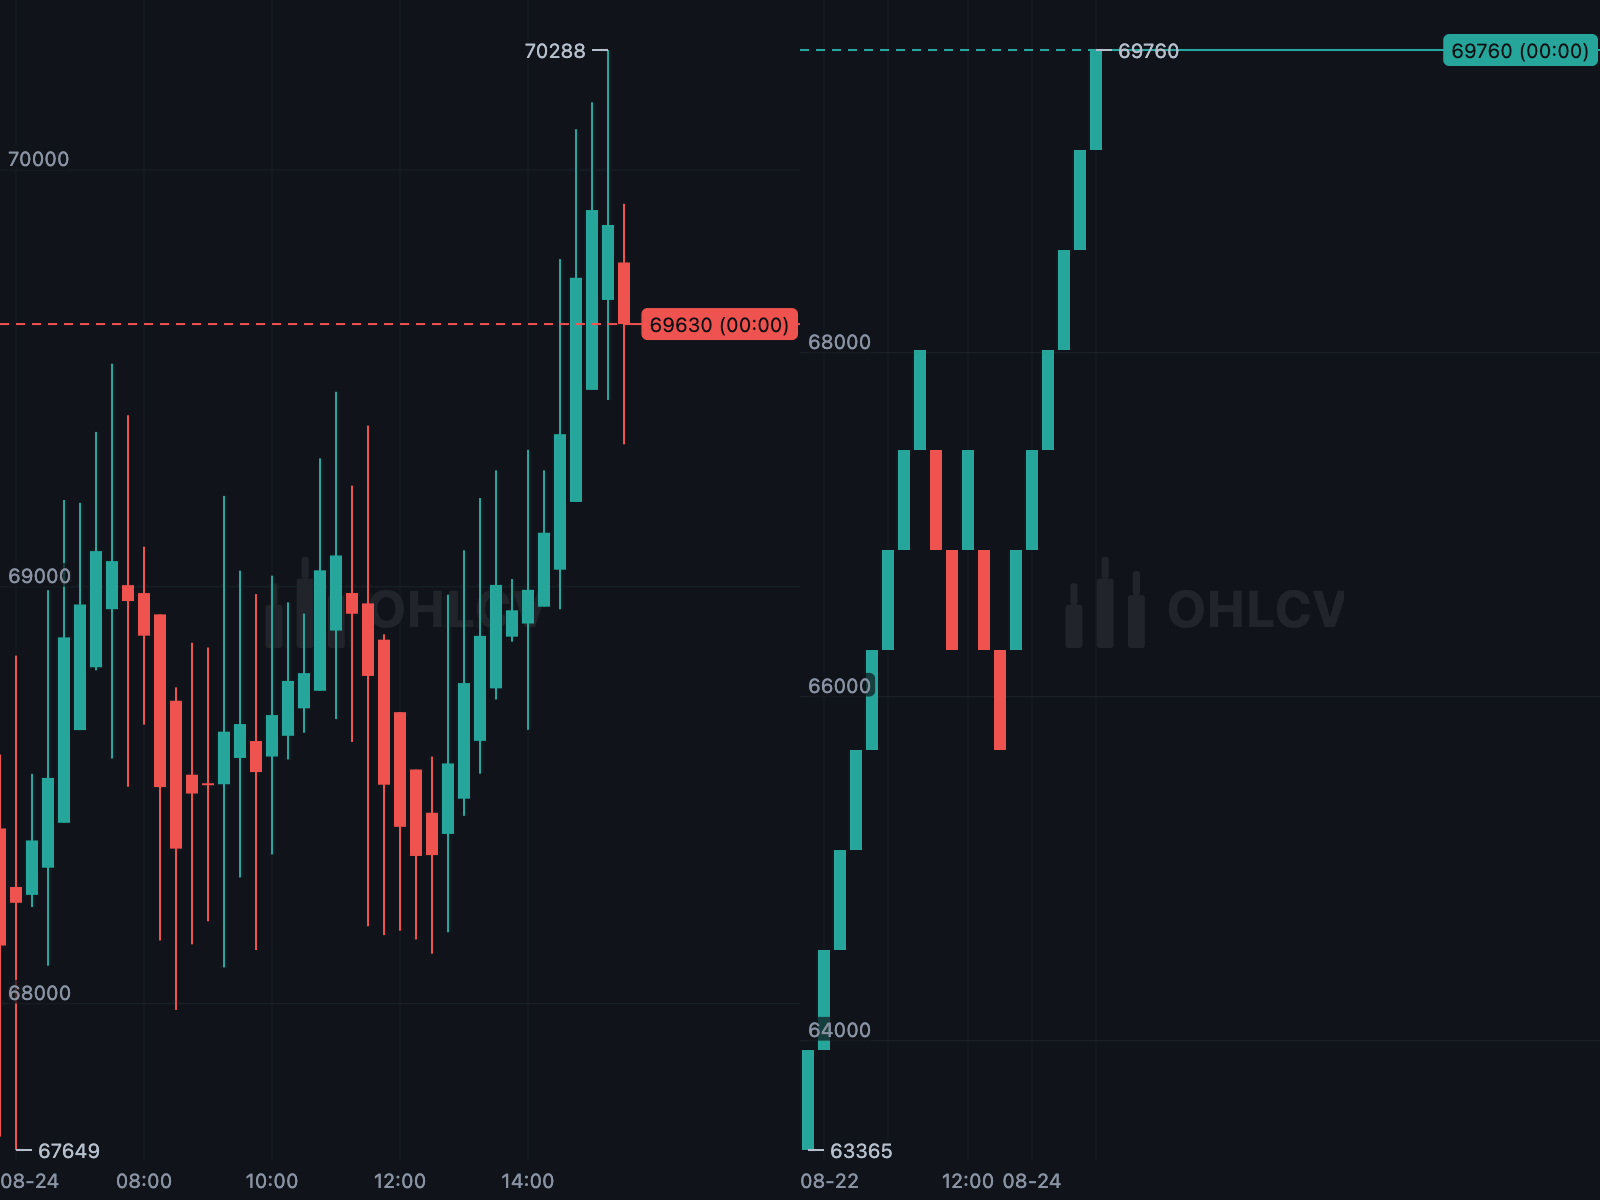 Heikin-Ashi and Renko Candles re-aggregated before rendering. |
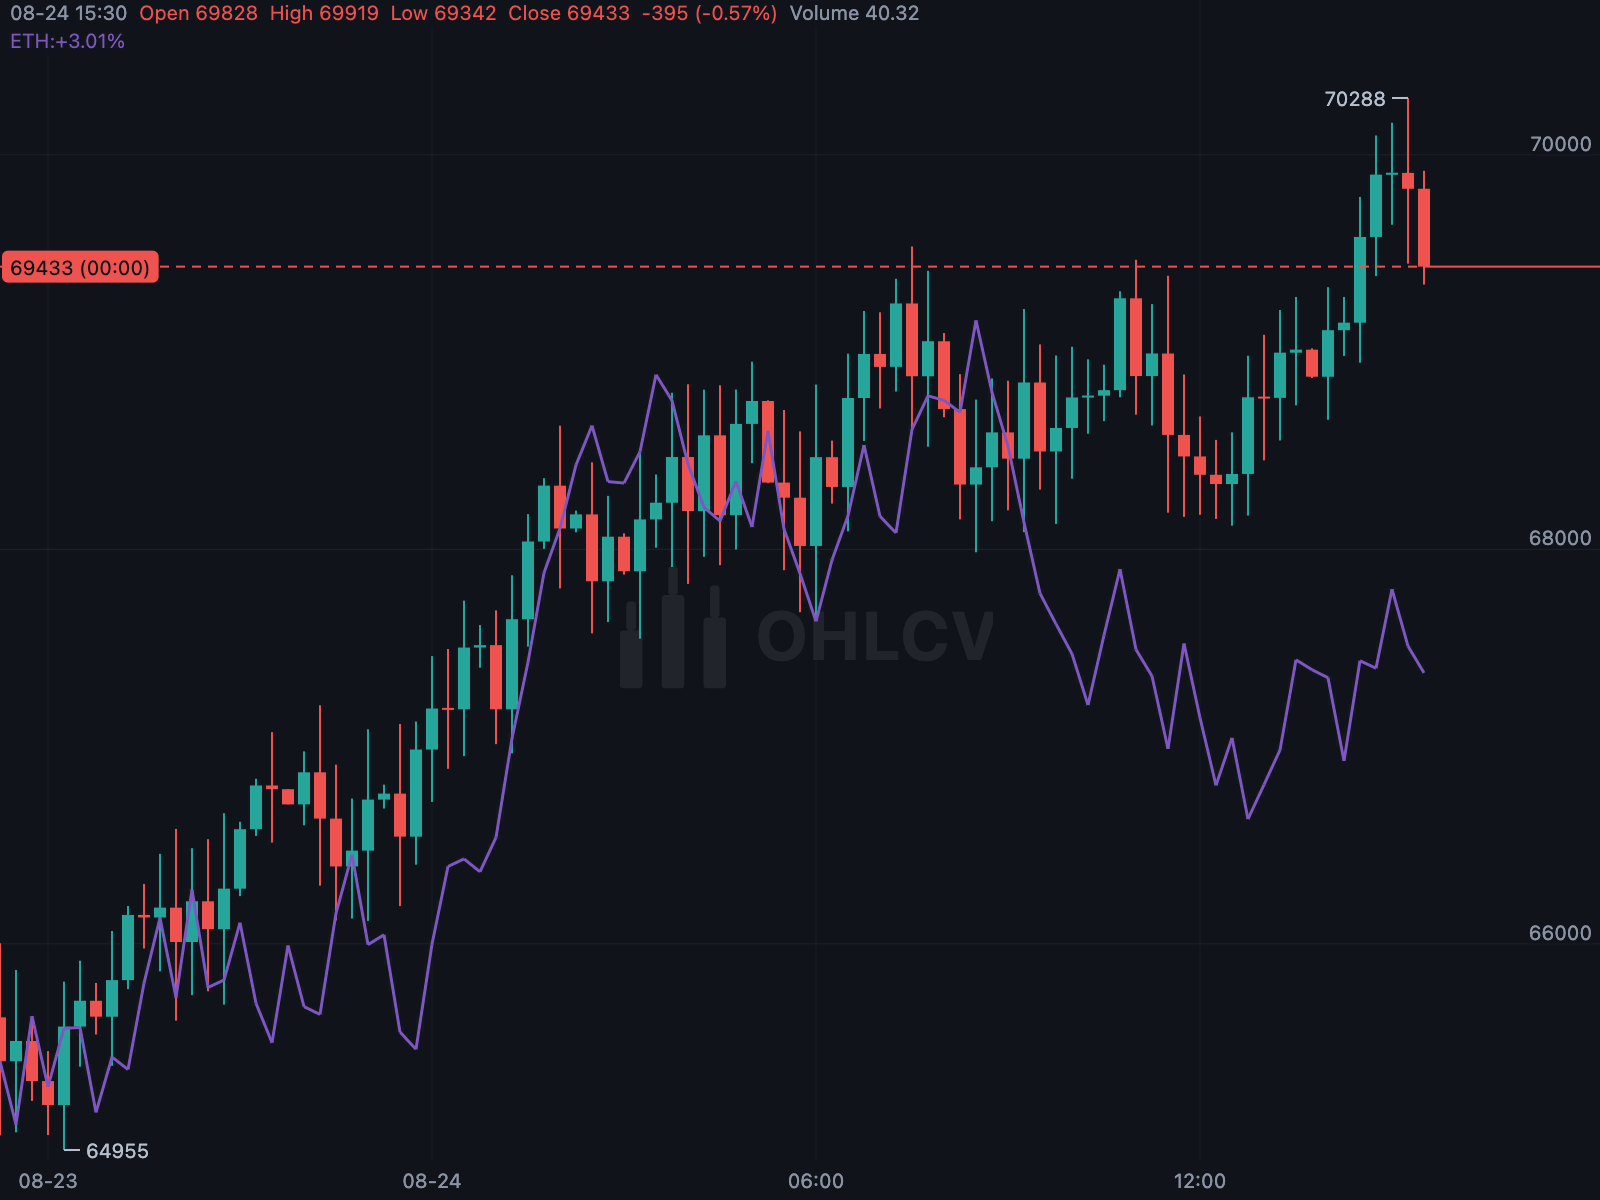 Symbol comparison Another instrument on the same axis, rebased or at actual prices. |
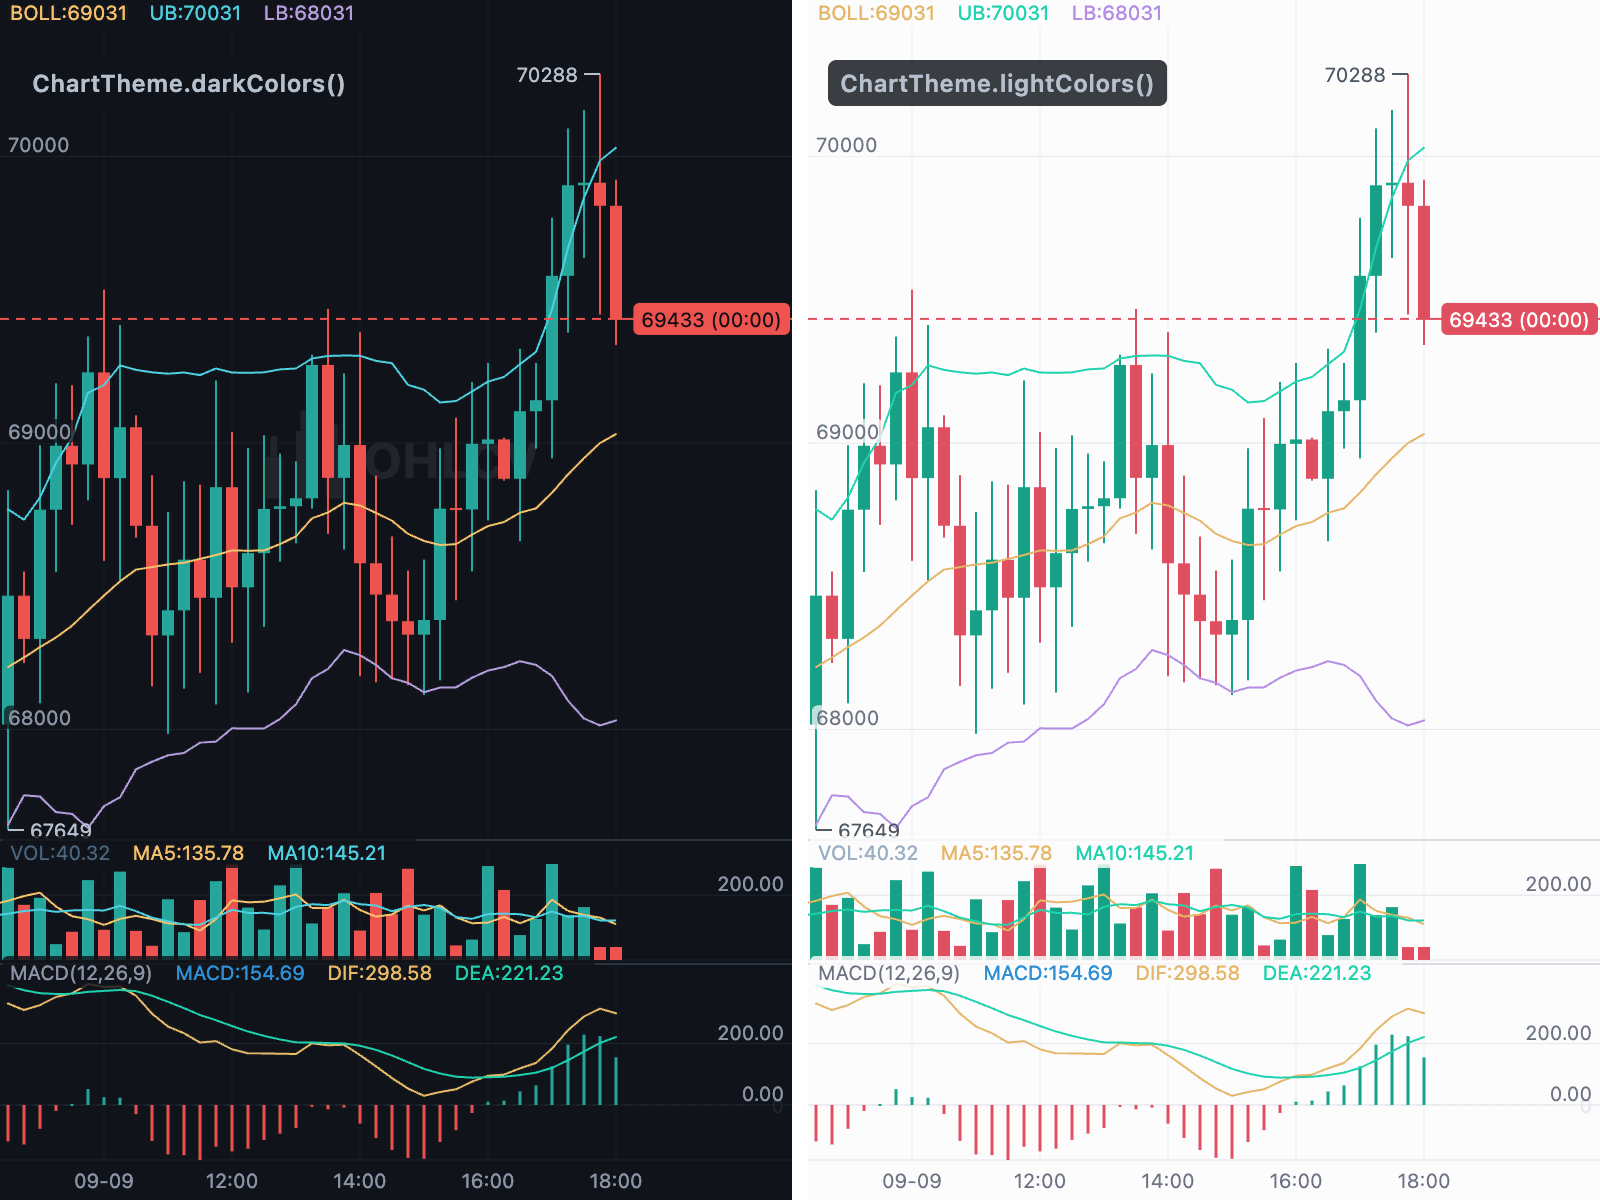 Dark and light The same chart in both themes, with every colour configurable. |
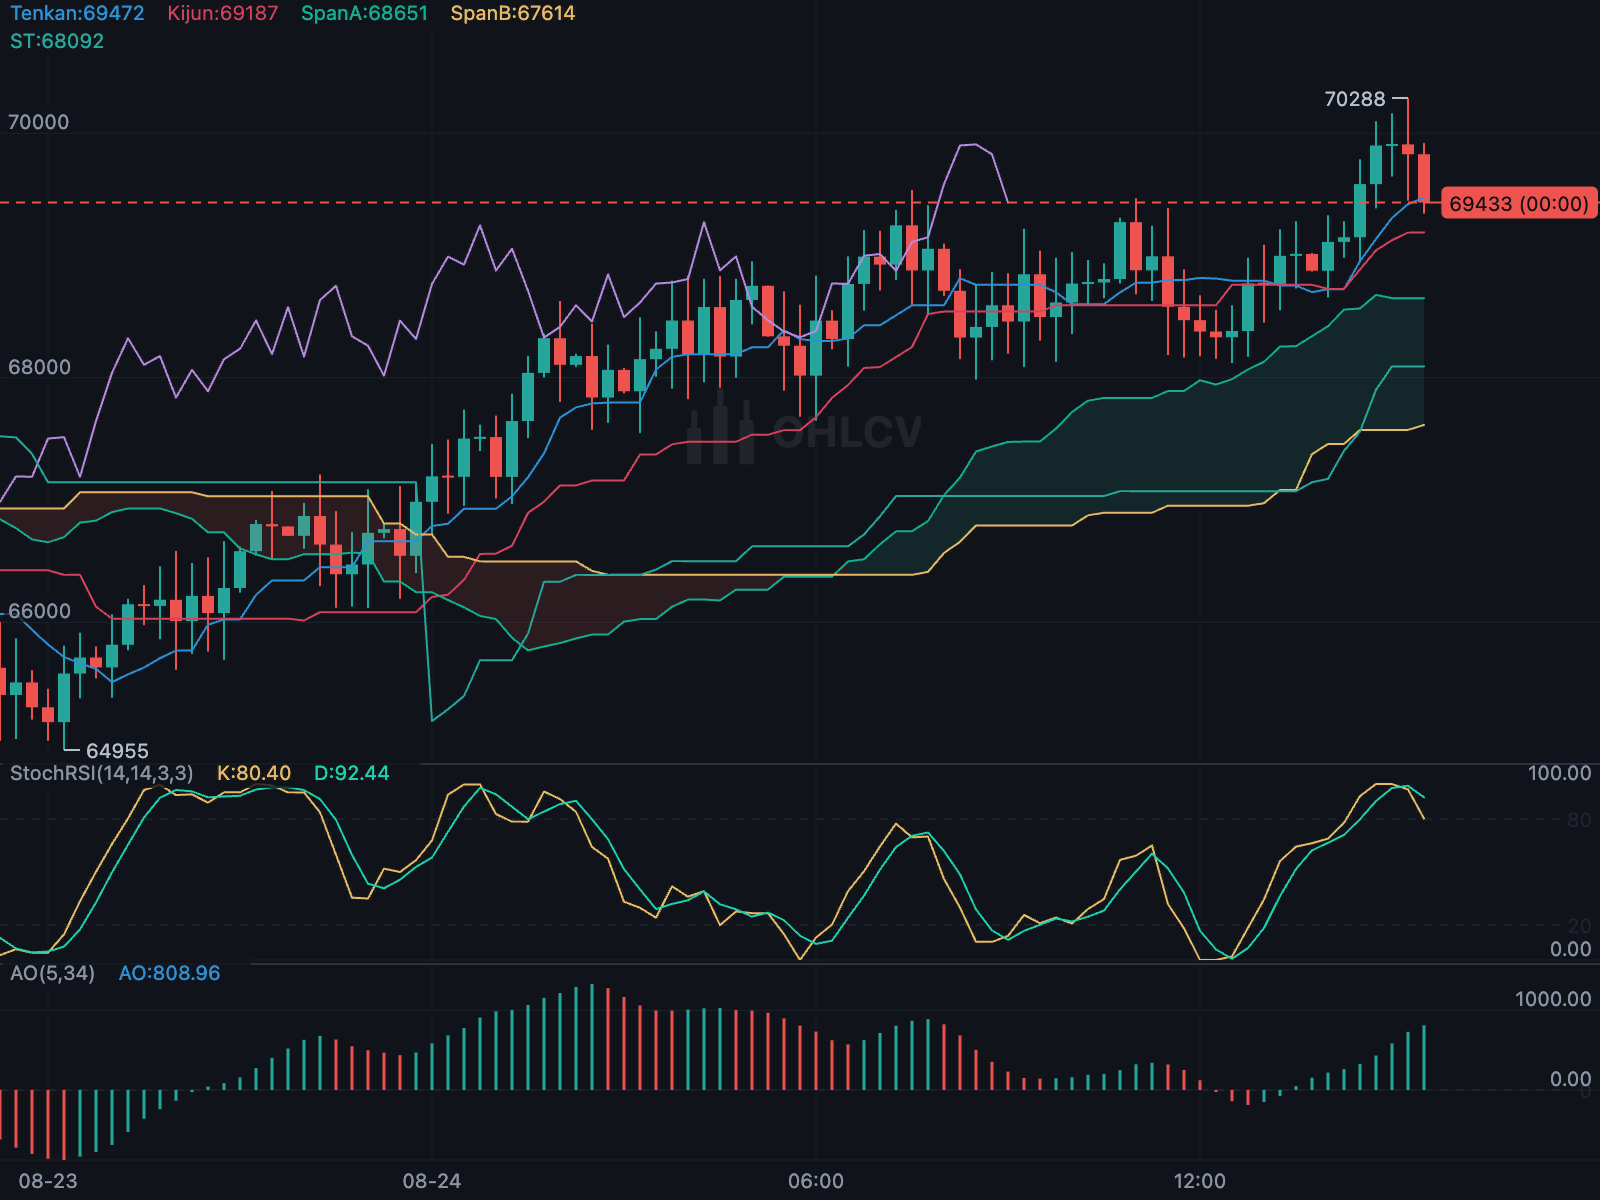 Main-chart overlays Ichimoku Cloud and Supertrend, with Stochastic RSI and Awesome Oscillator panes. |
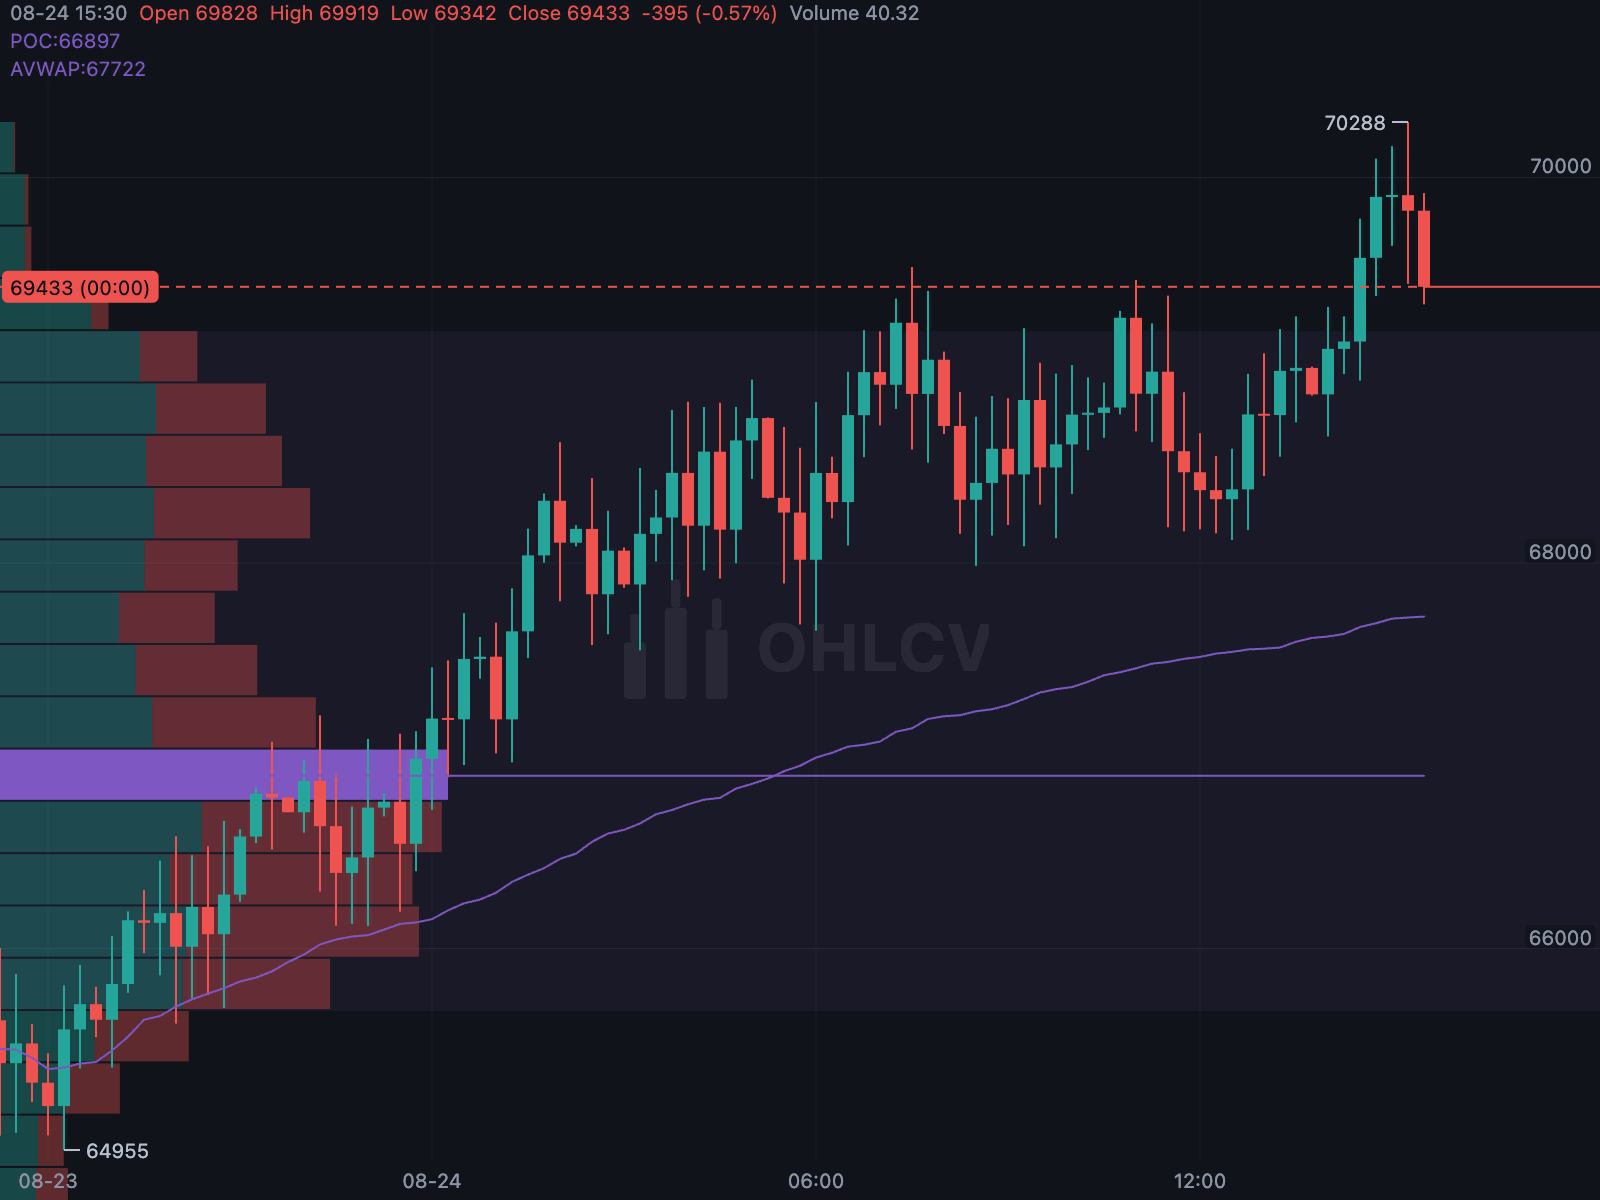 Profile and anchored VWAP A volume profile and a VWAP anchored to a candle. |
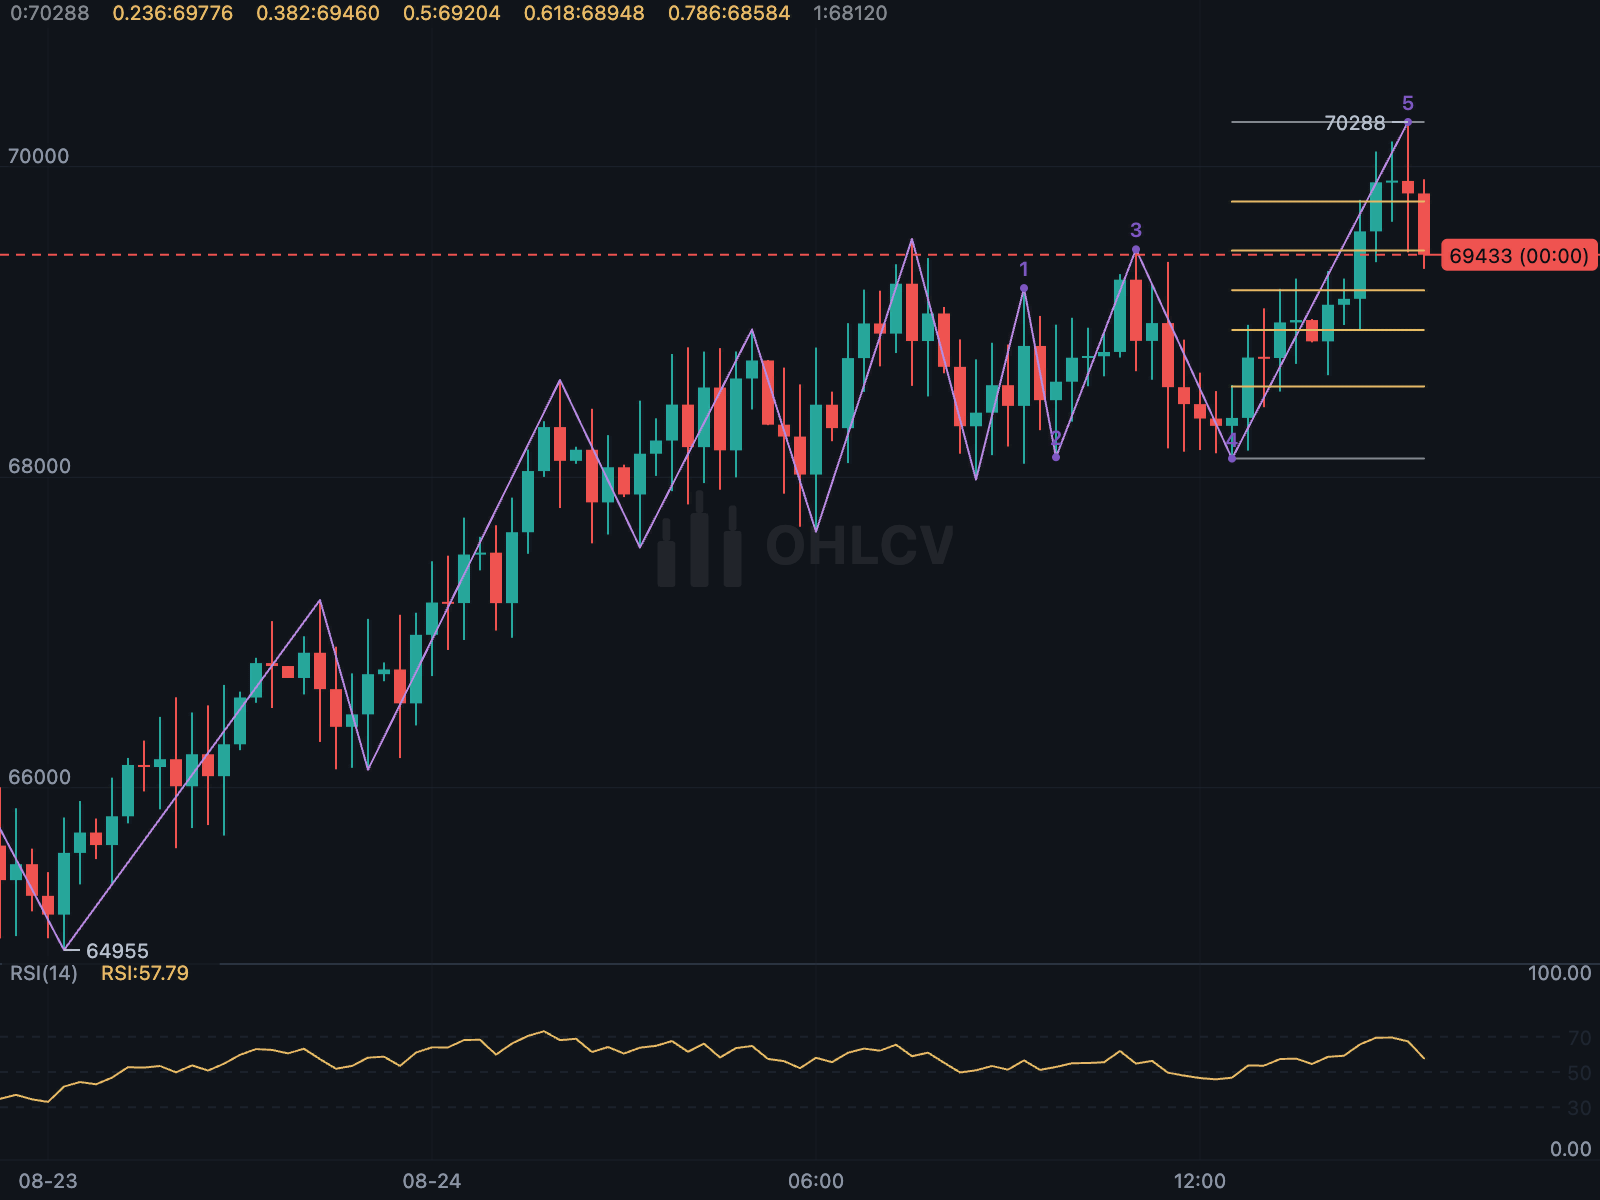 Swing analysis ZigZag, Fibonacci retracement and Elliott wave labels. |
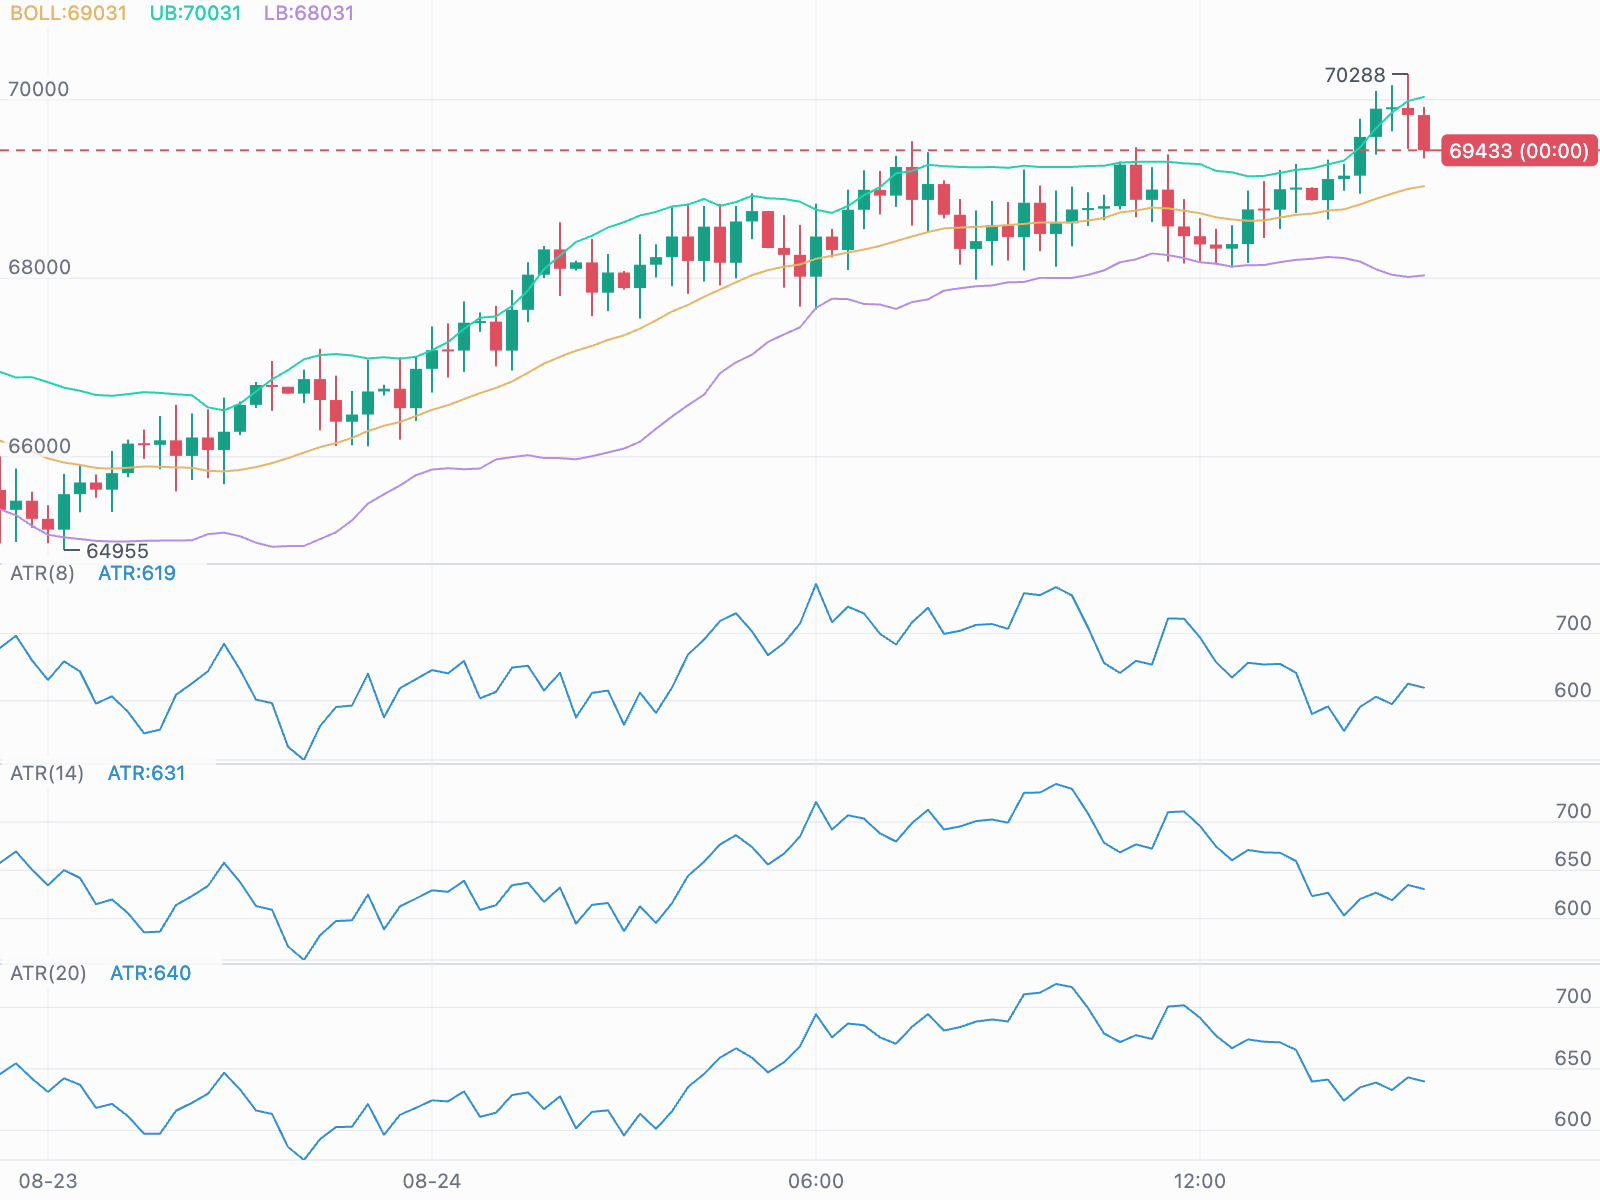 Stacked panes Three ATR periods, each in its own resizable pane. |
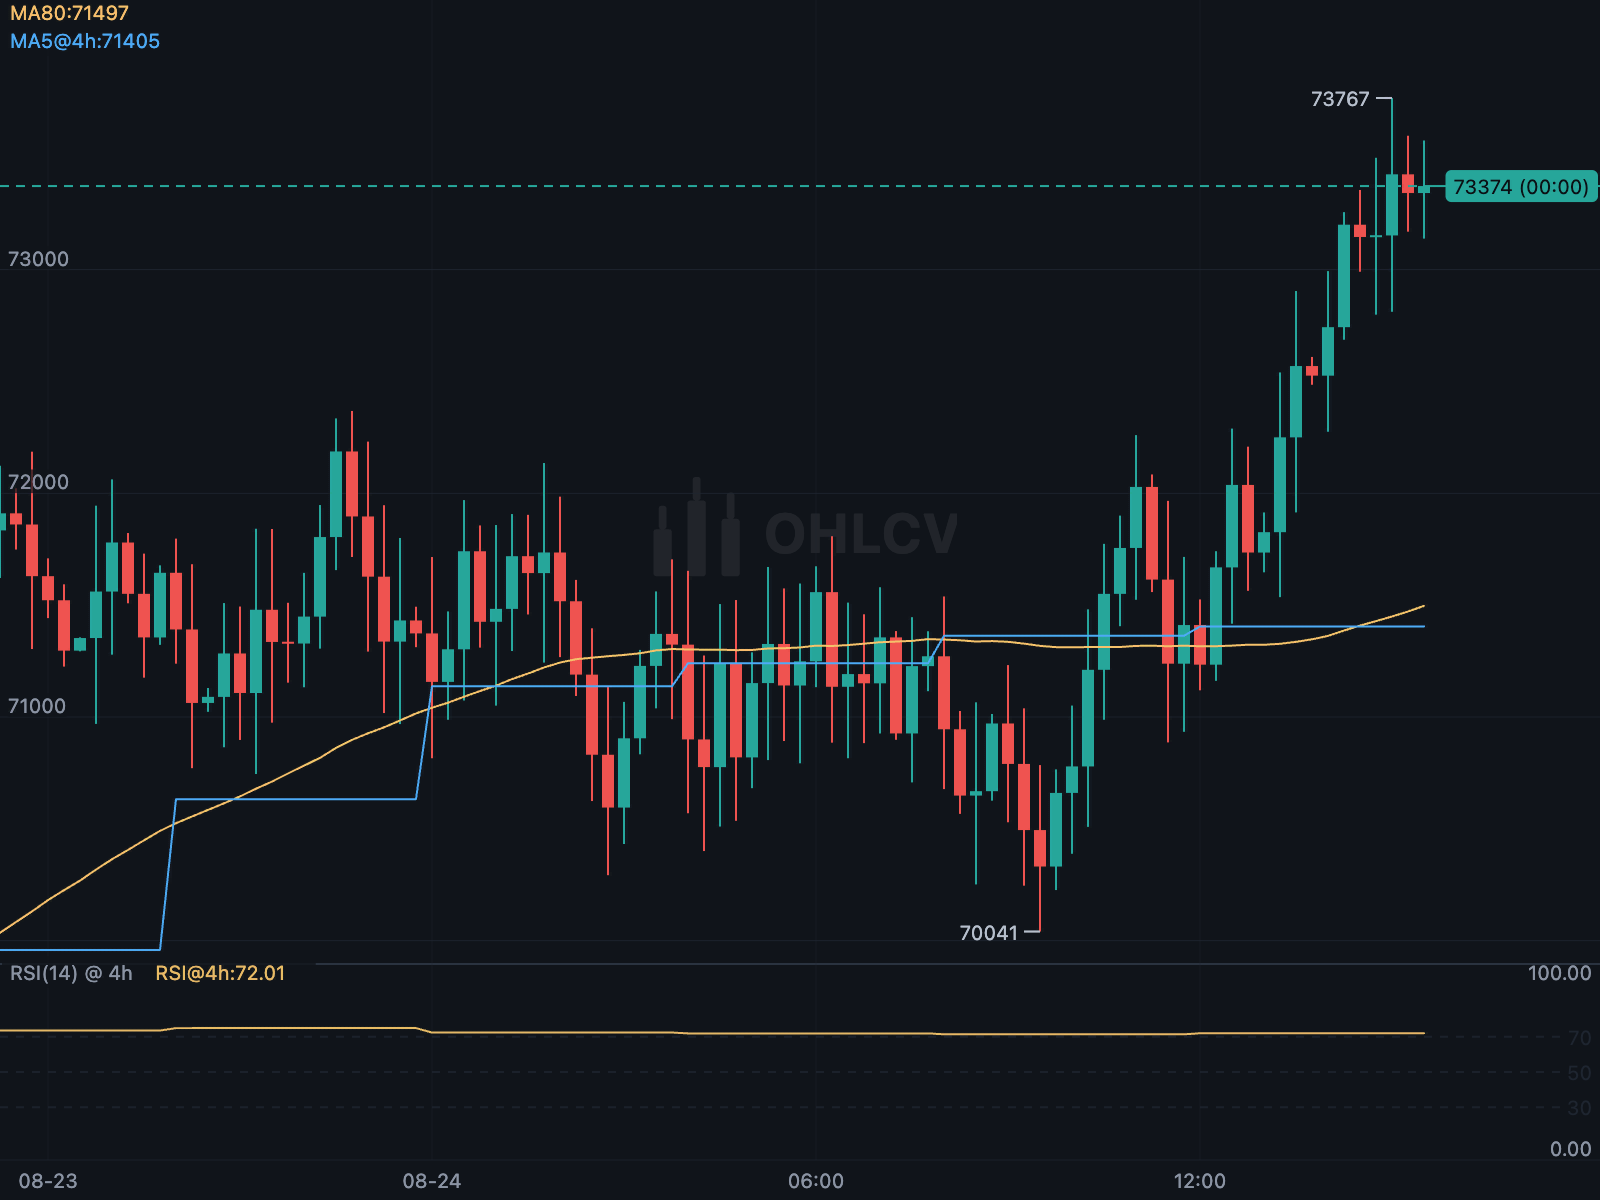 Higher timeframes A four-hour moving average and RSI on 15-minute candles. |
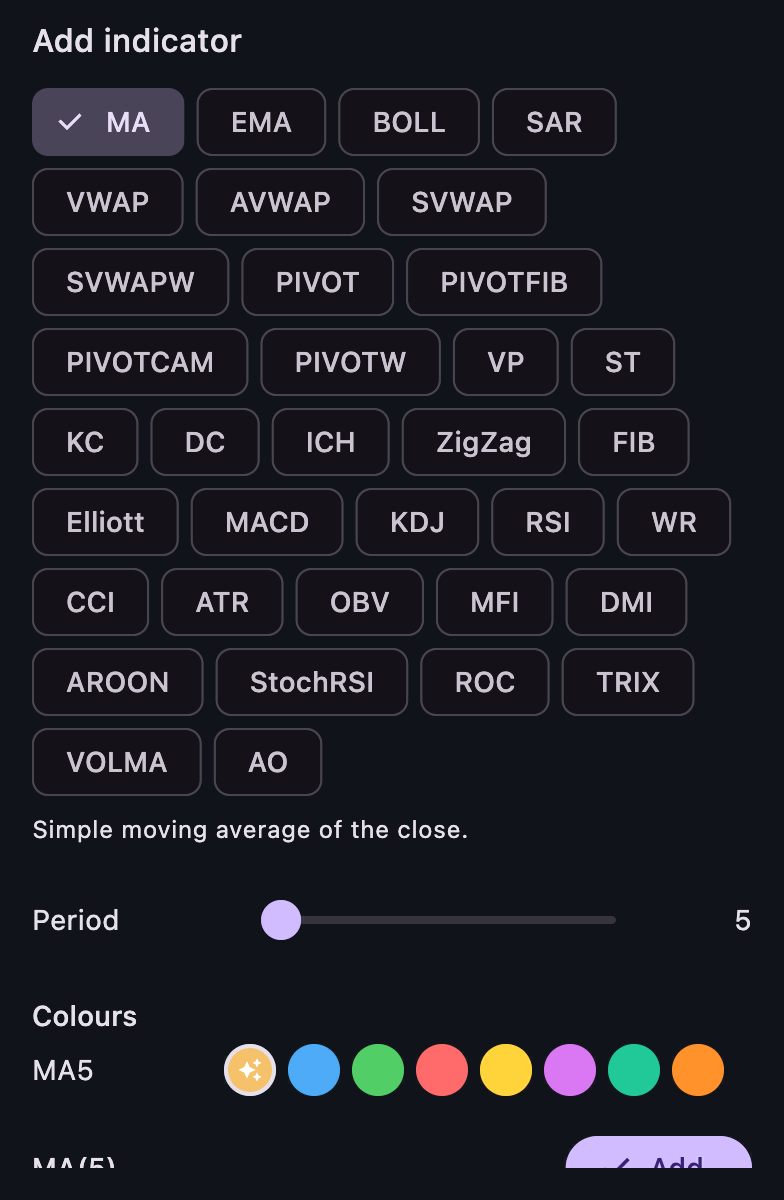 Indicator catalogue The example app's indicator picker, generated from the catalogue. |
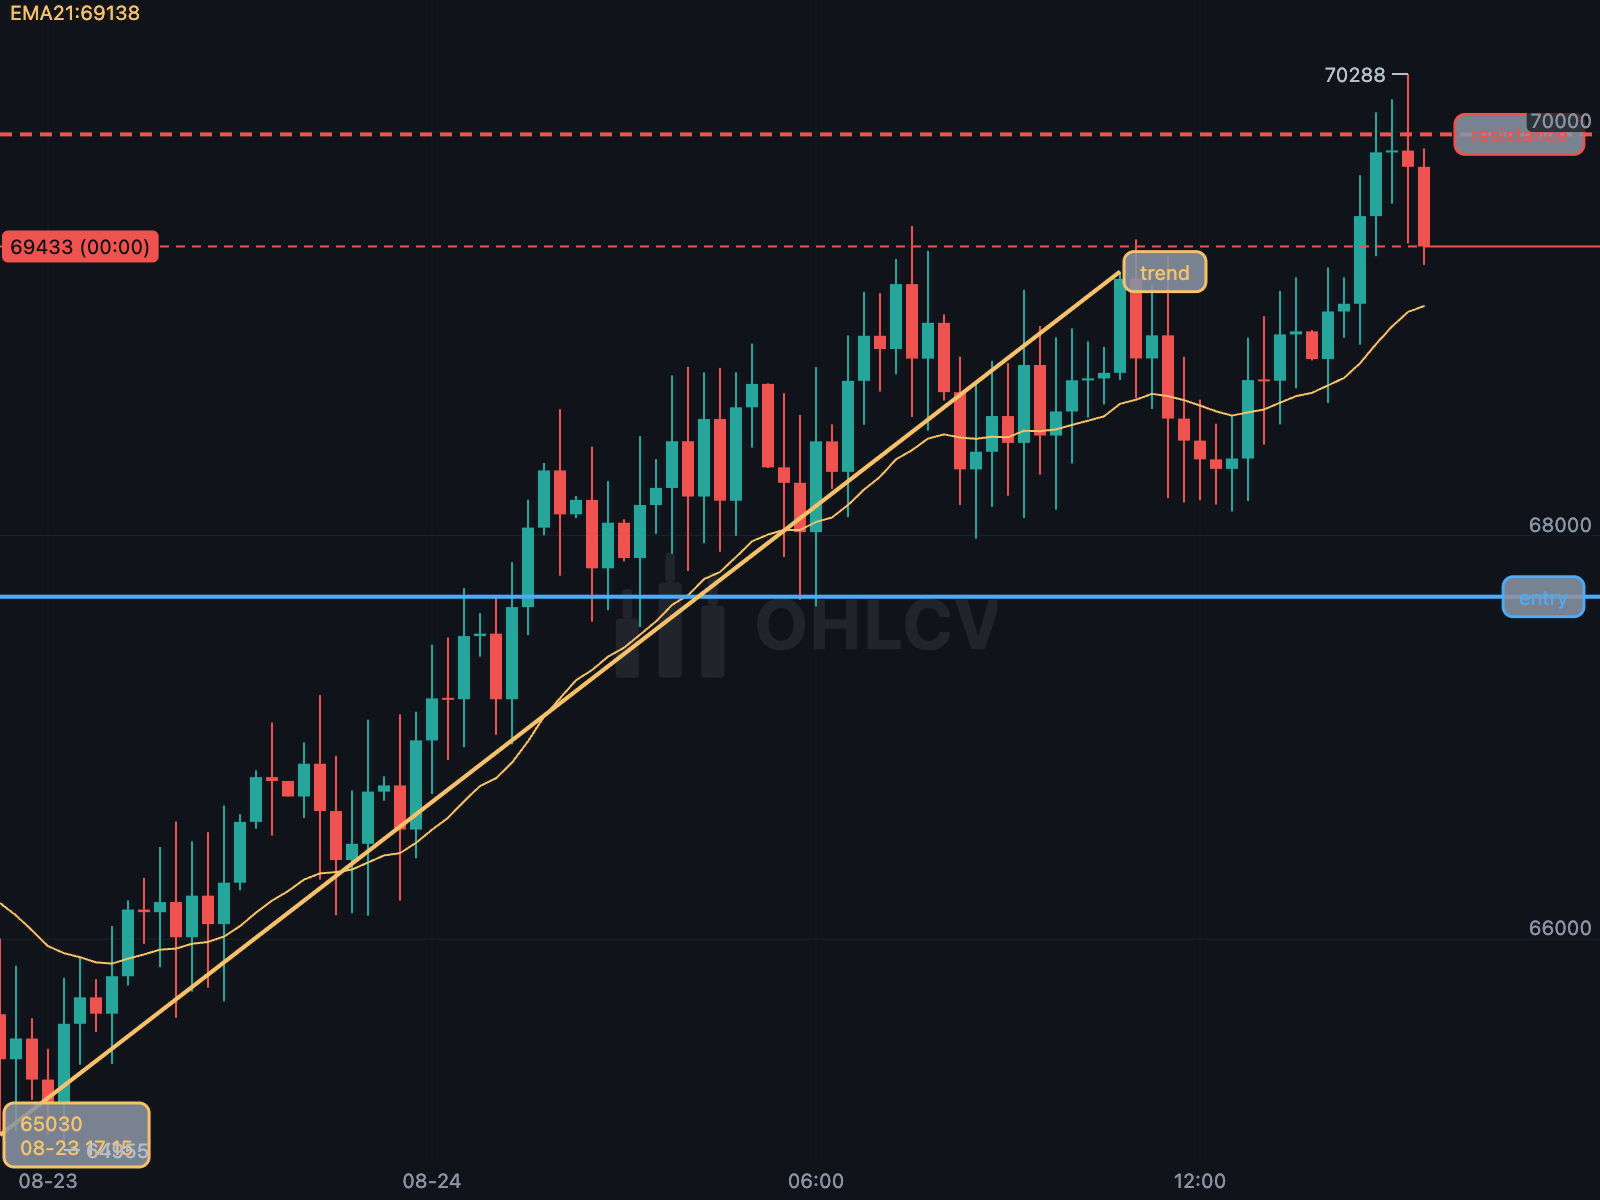 29 drawing tools Labelled trend and horizontal lines, with snapping and persistence. |
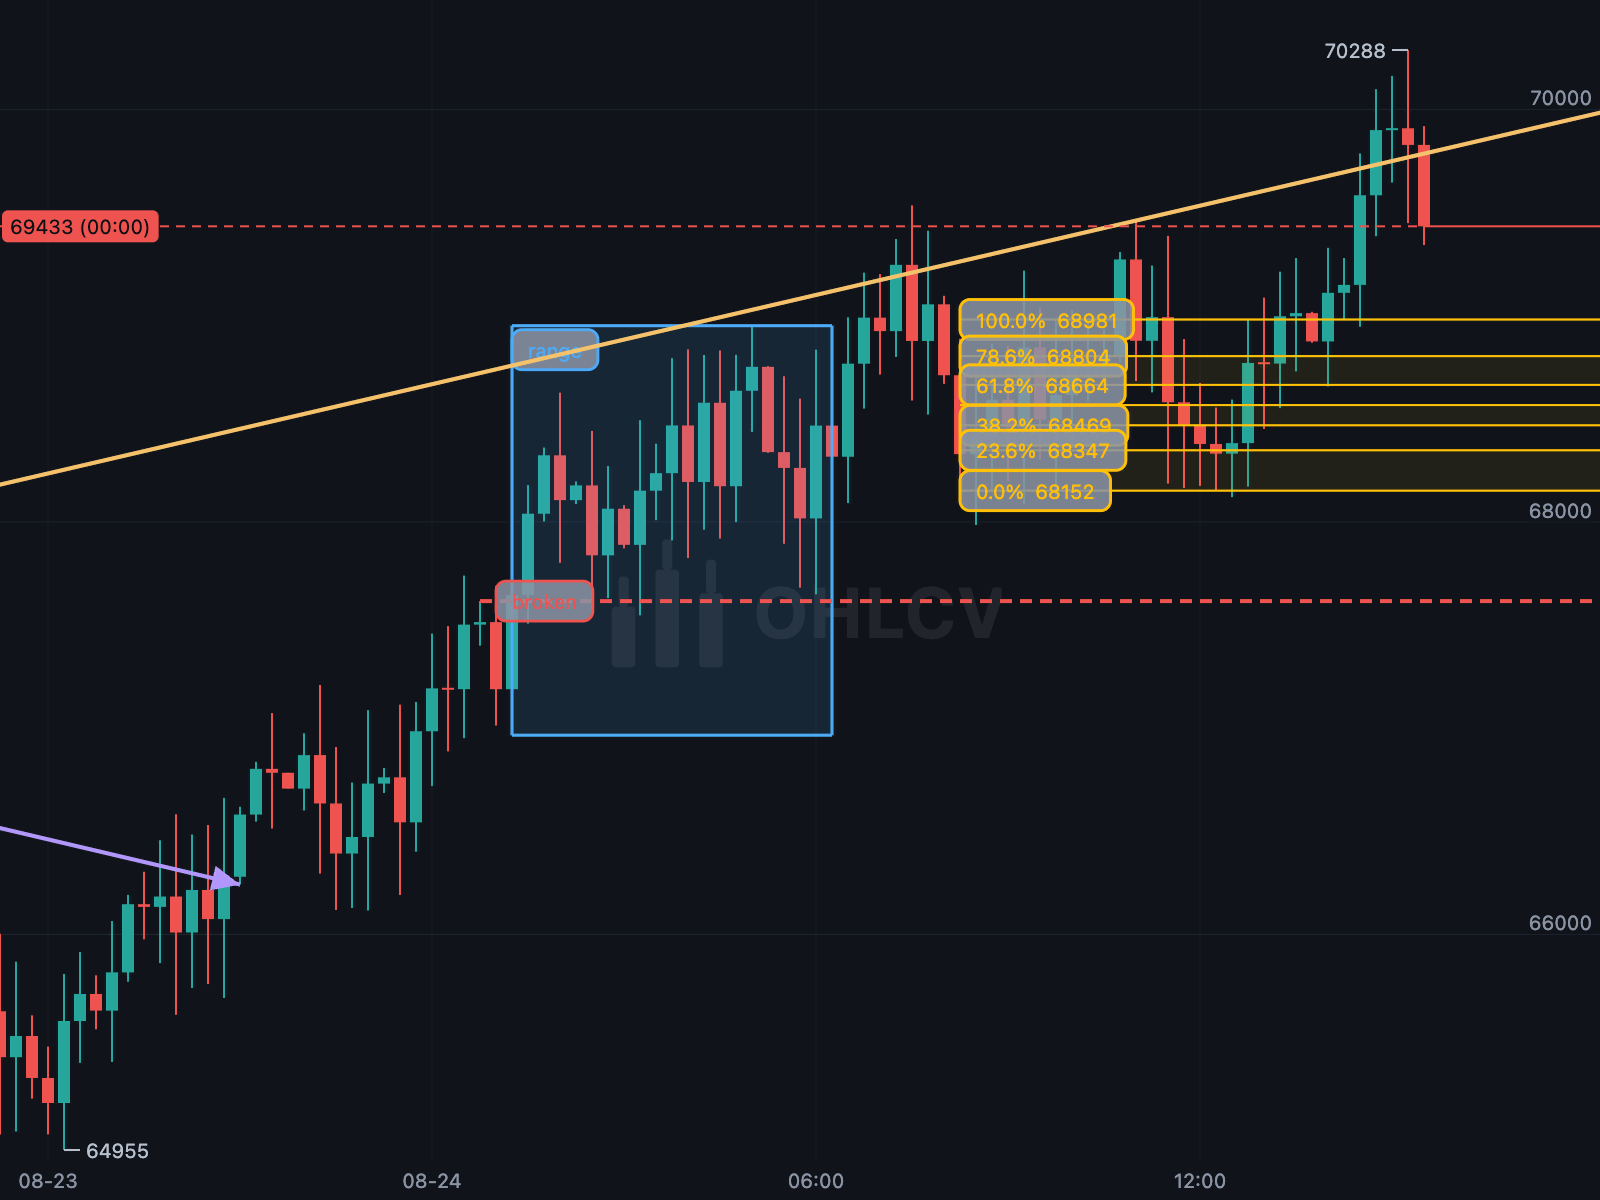 Rays, boxes and Fibonacci A ray, an arrow, a horizontal ray, a range box and a Fibonacci retracement. |
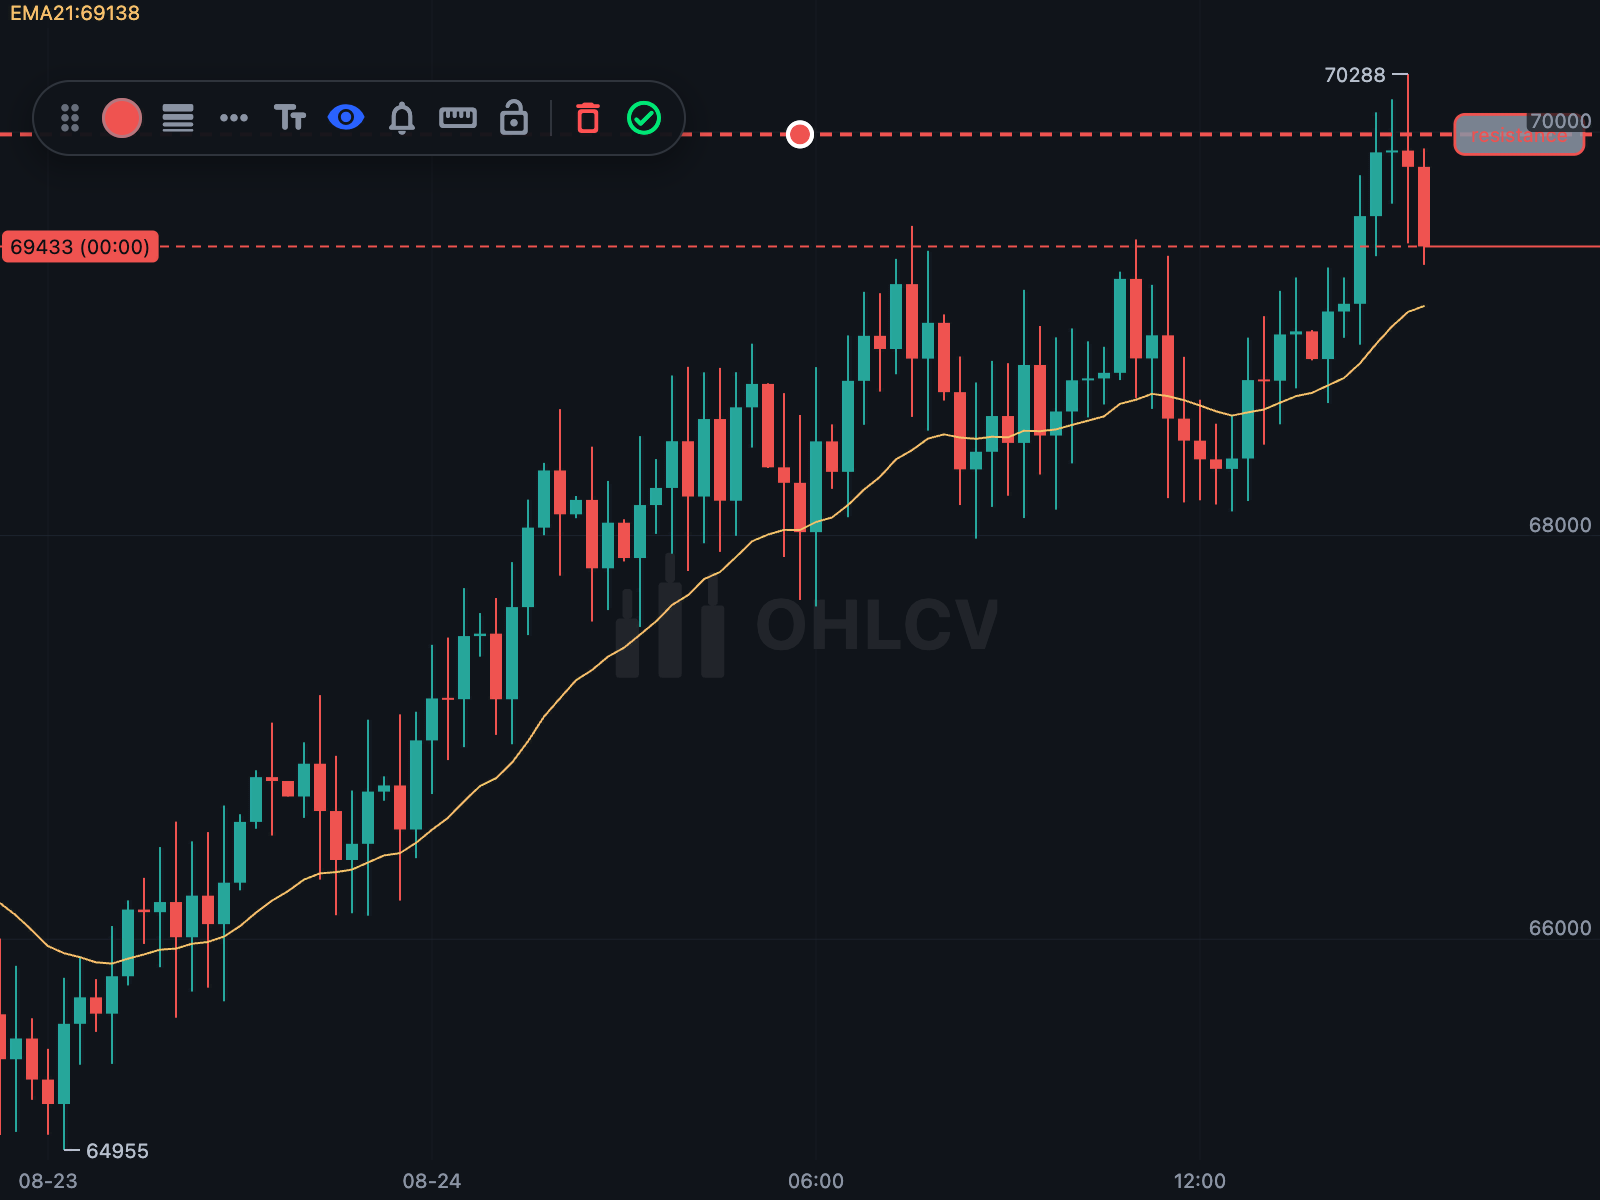 The line editor Controls for the selected drawing, customisable through DrawingStyle. |
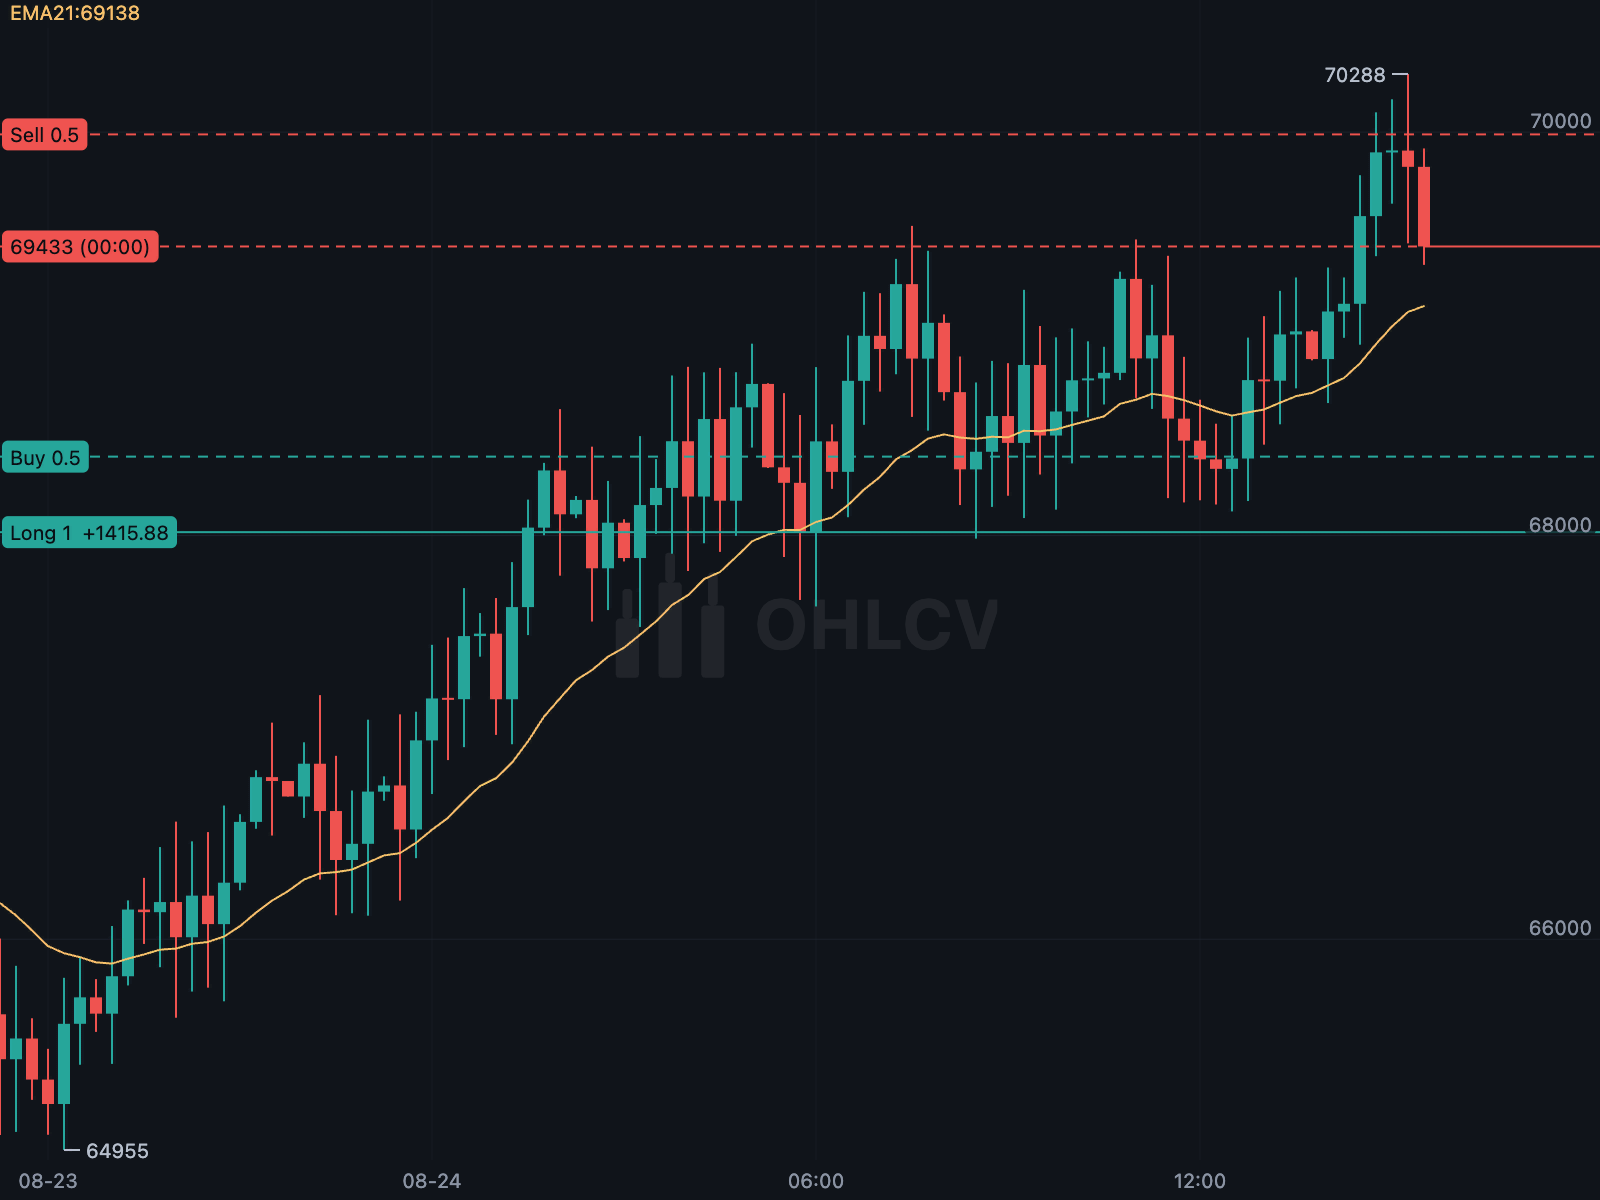 Orders and positions A working order and an open position, each labelled on the axis. |
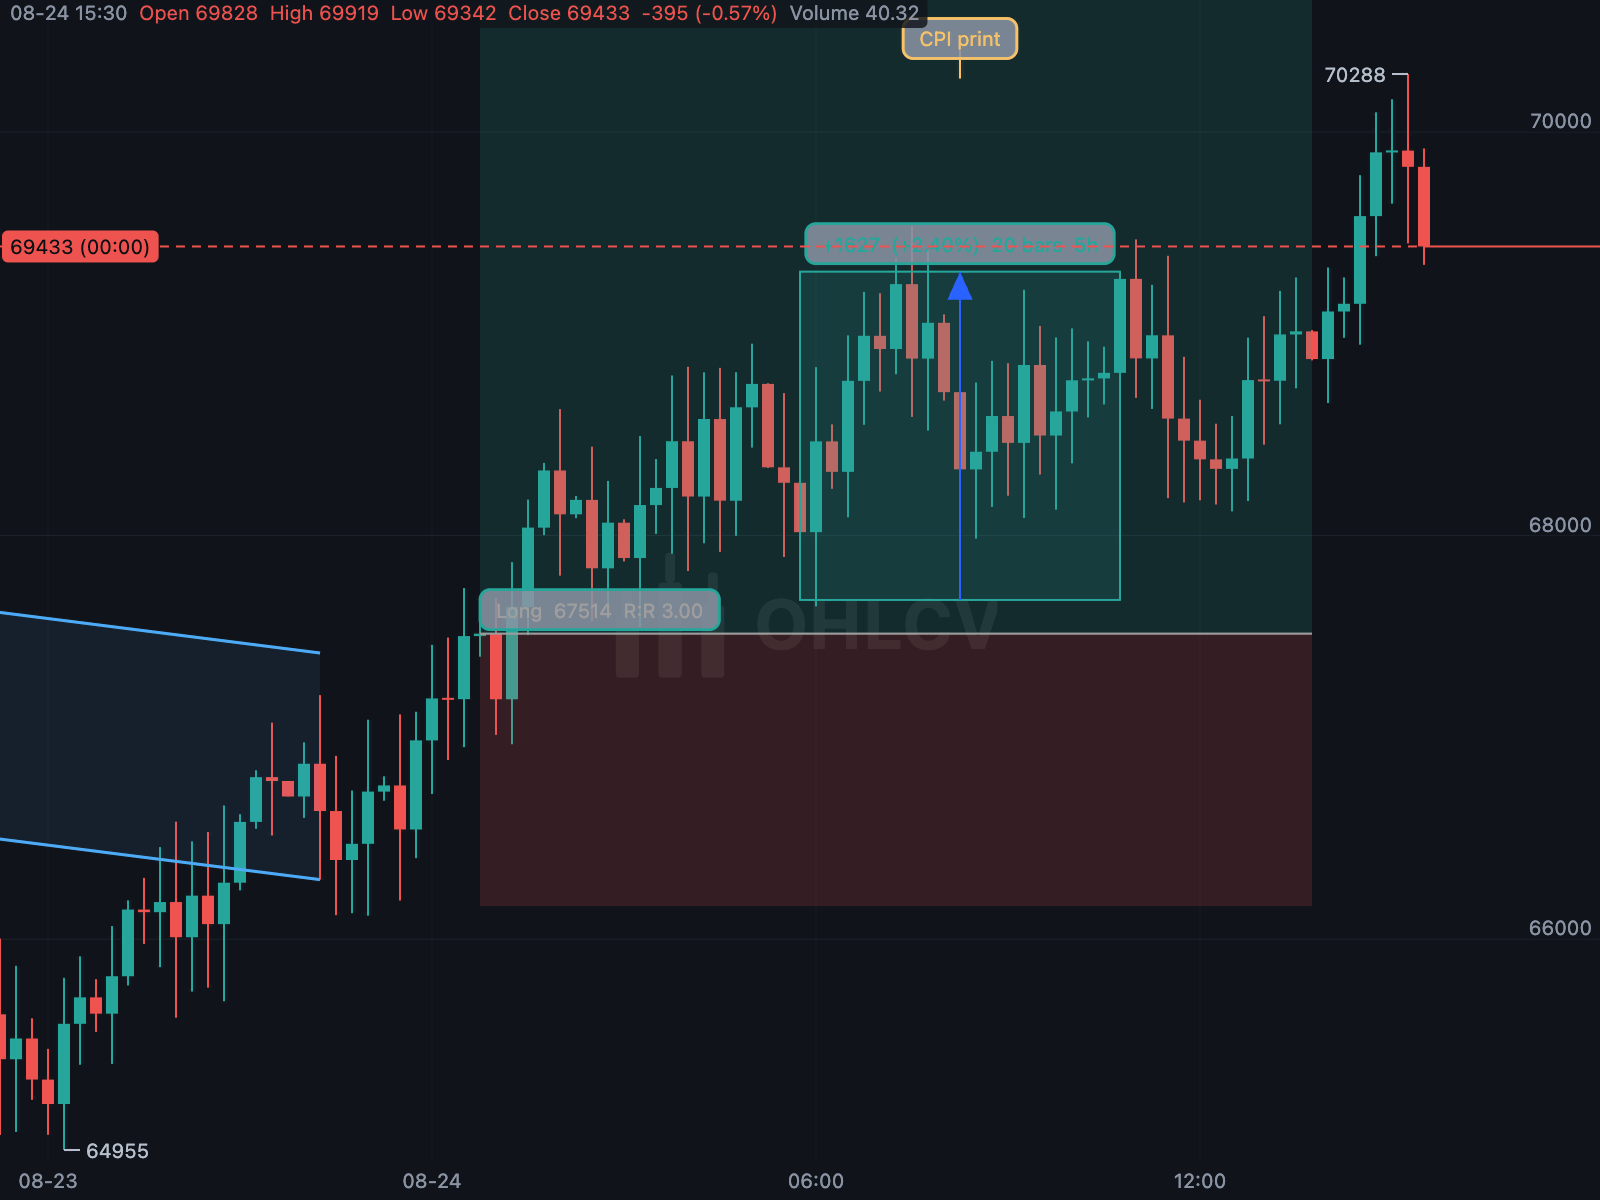 Planning a trade A planned position with risk-to-reward, inside a channel. |
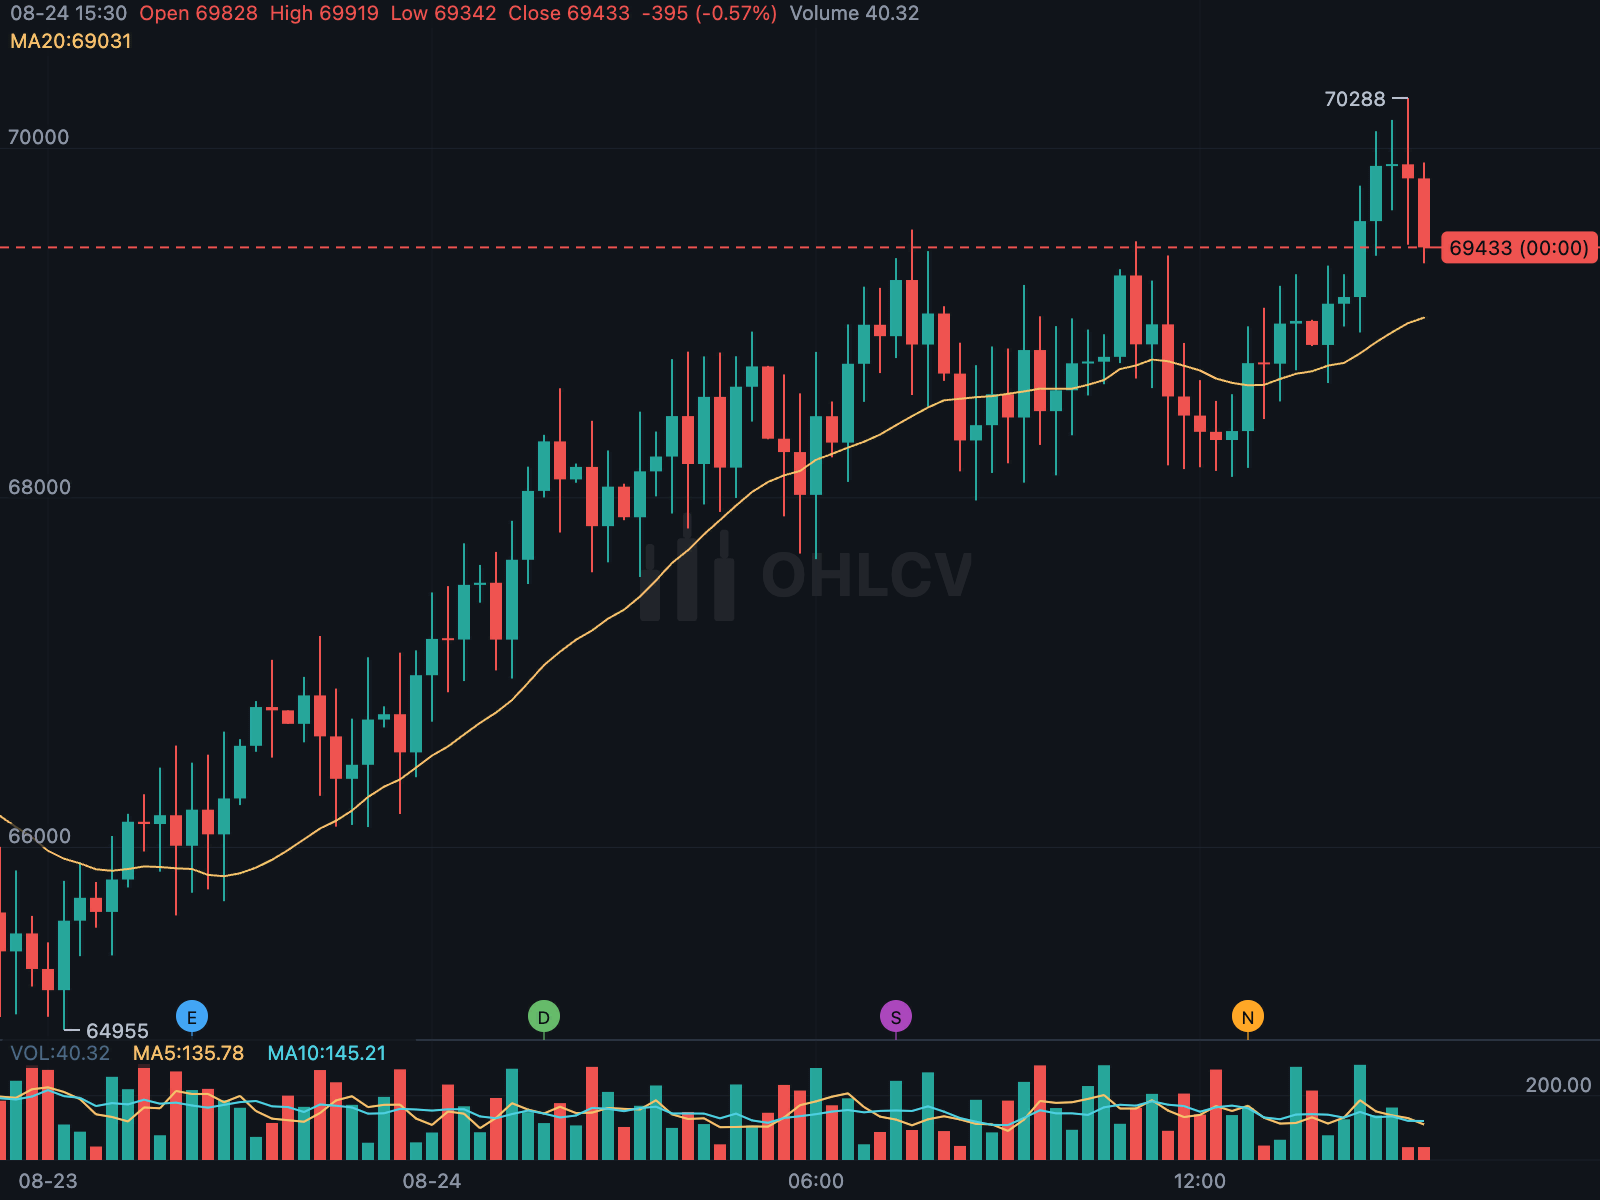 Event marks Earnings, dividend, split and news markers below the candles. |
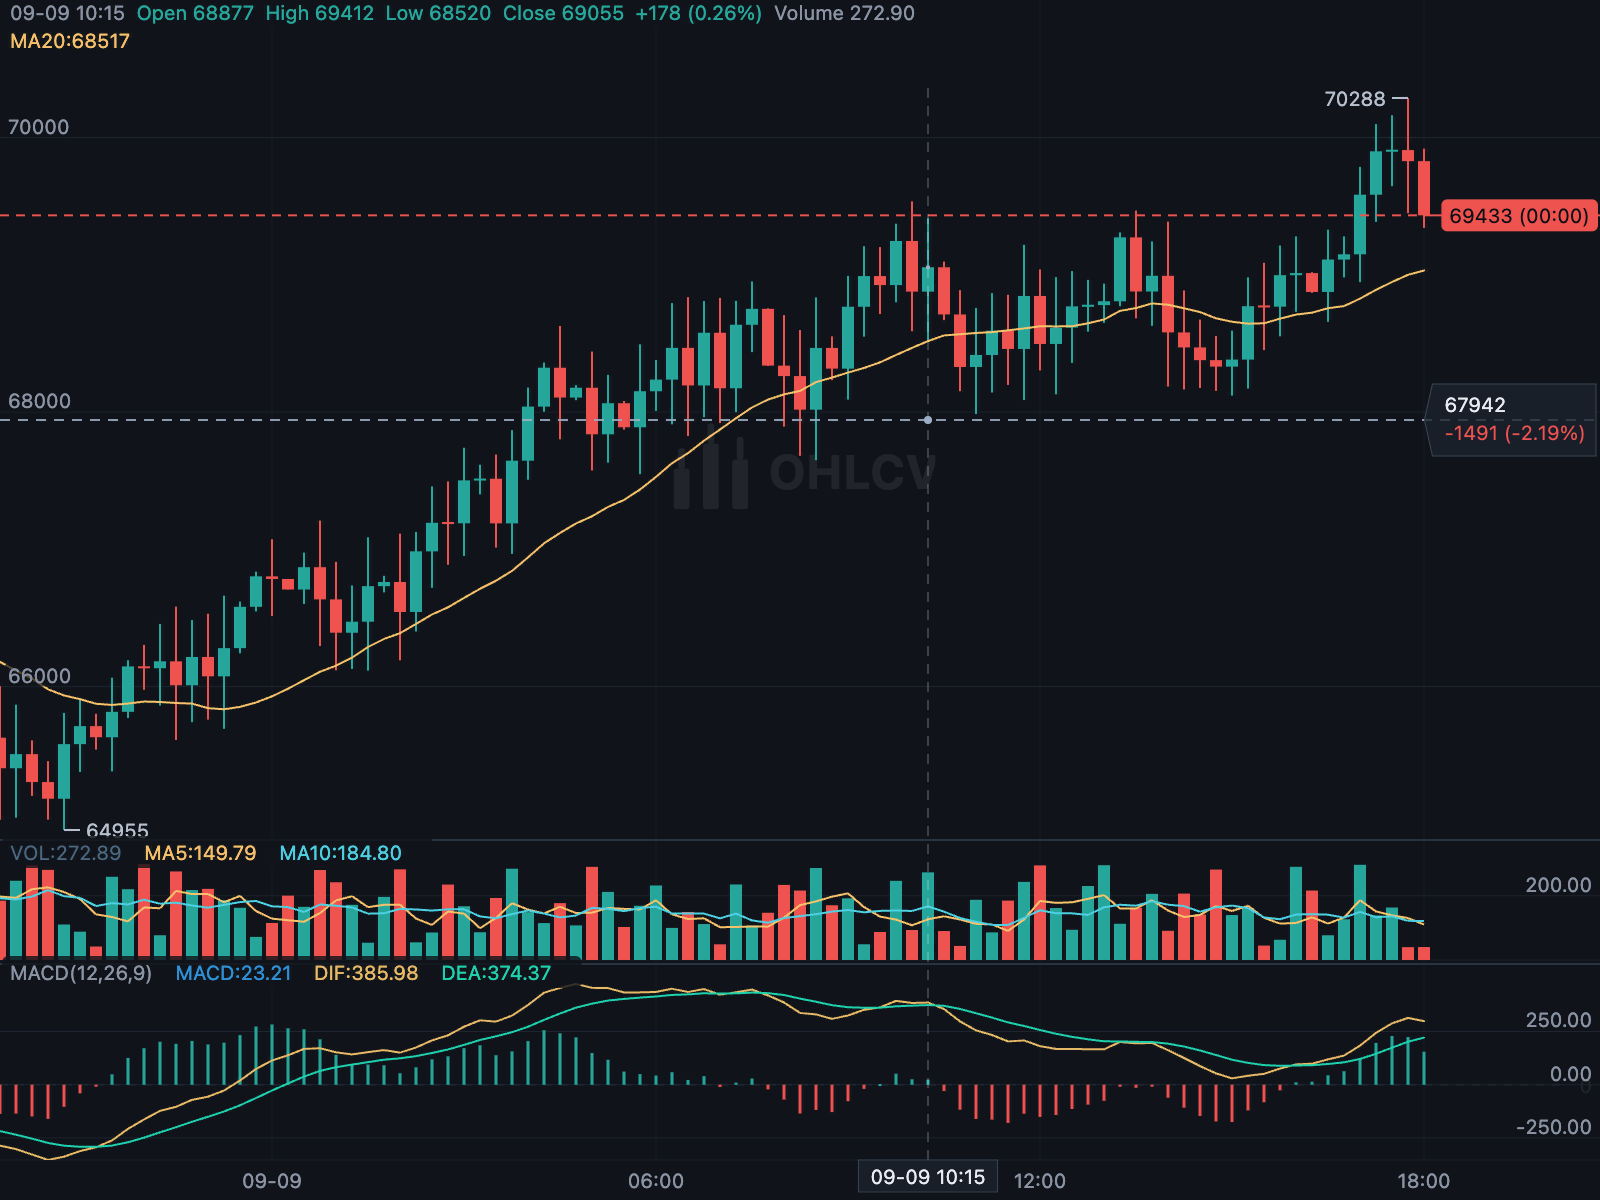 Legend and crosshair The OHLC legend, updated from the crosshair position. |
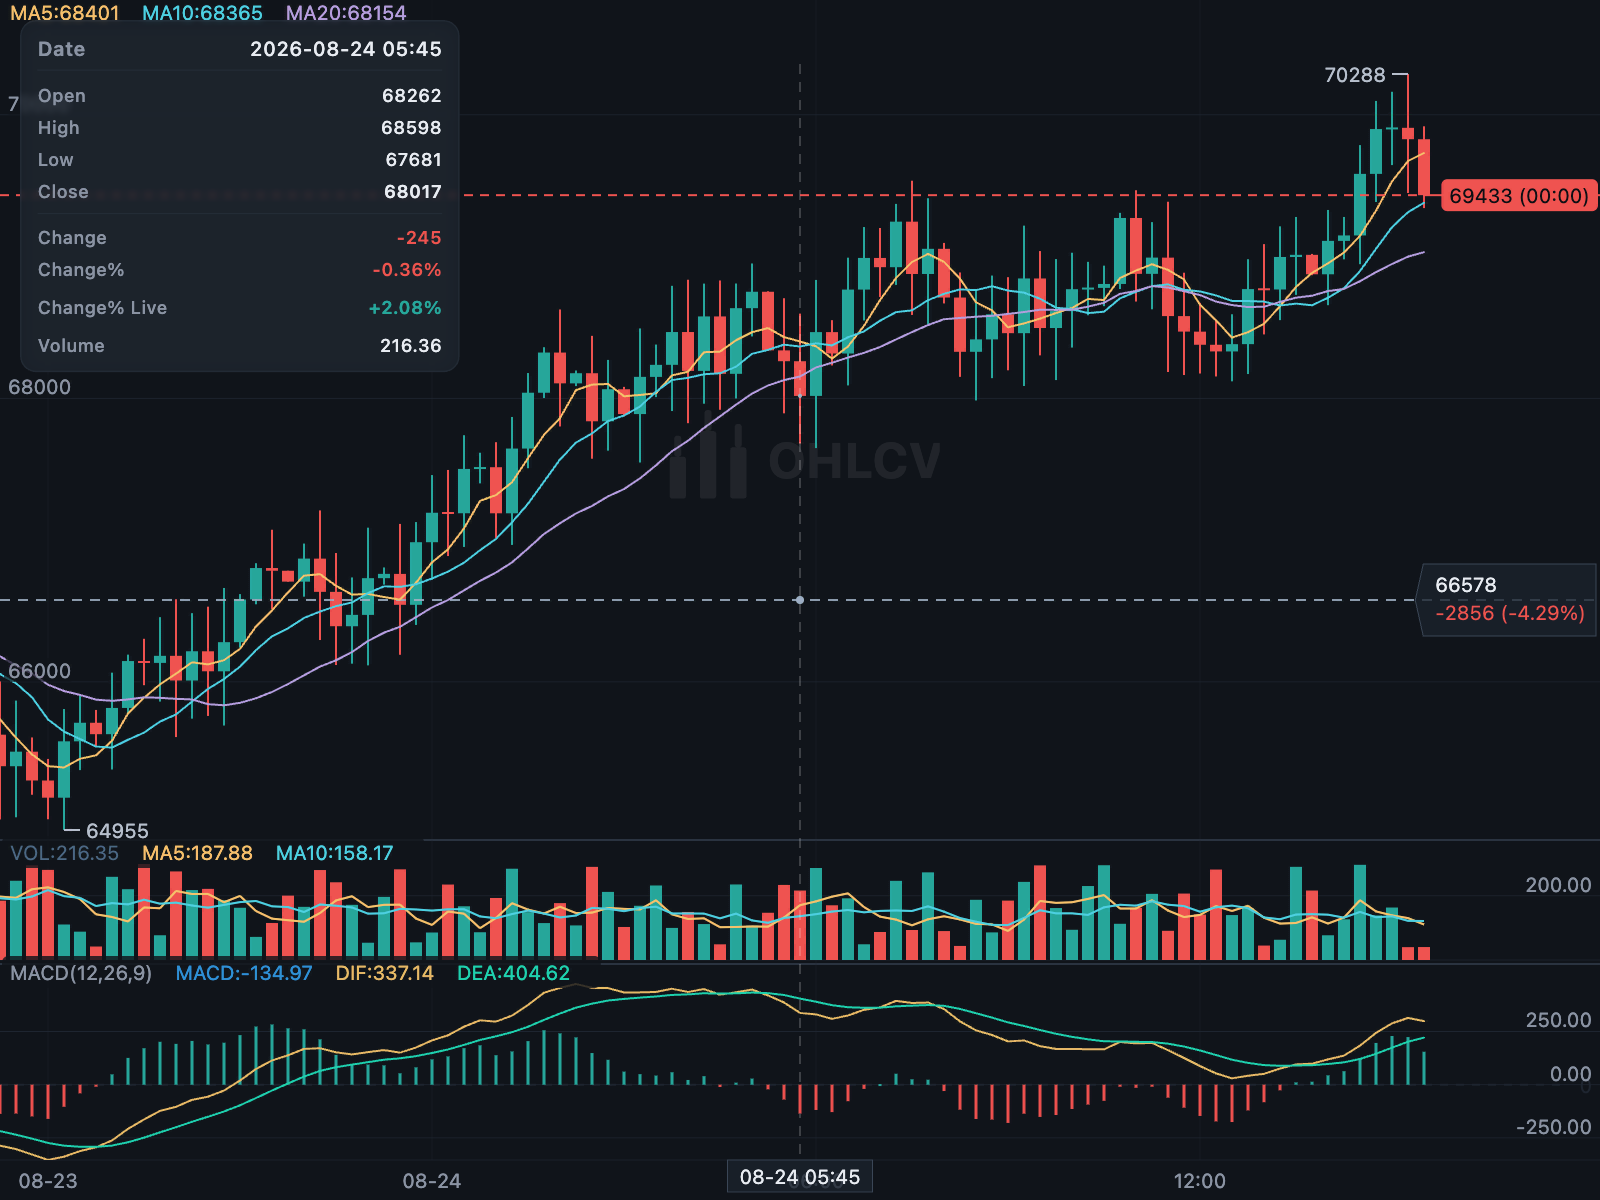 The long-press readout The built-in candle details card, or a custom builder. |
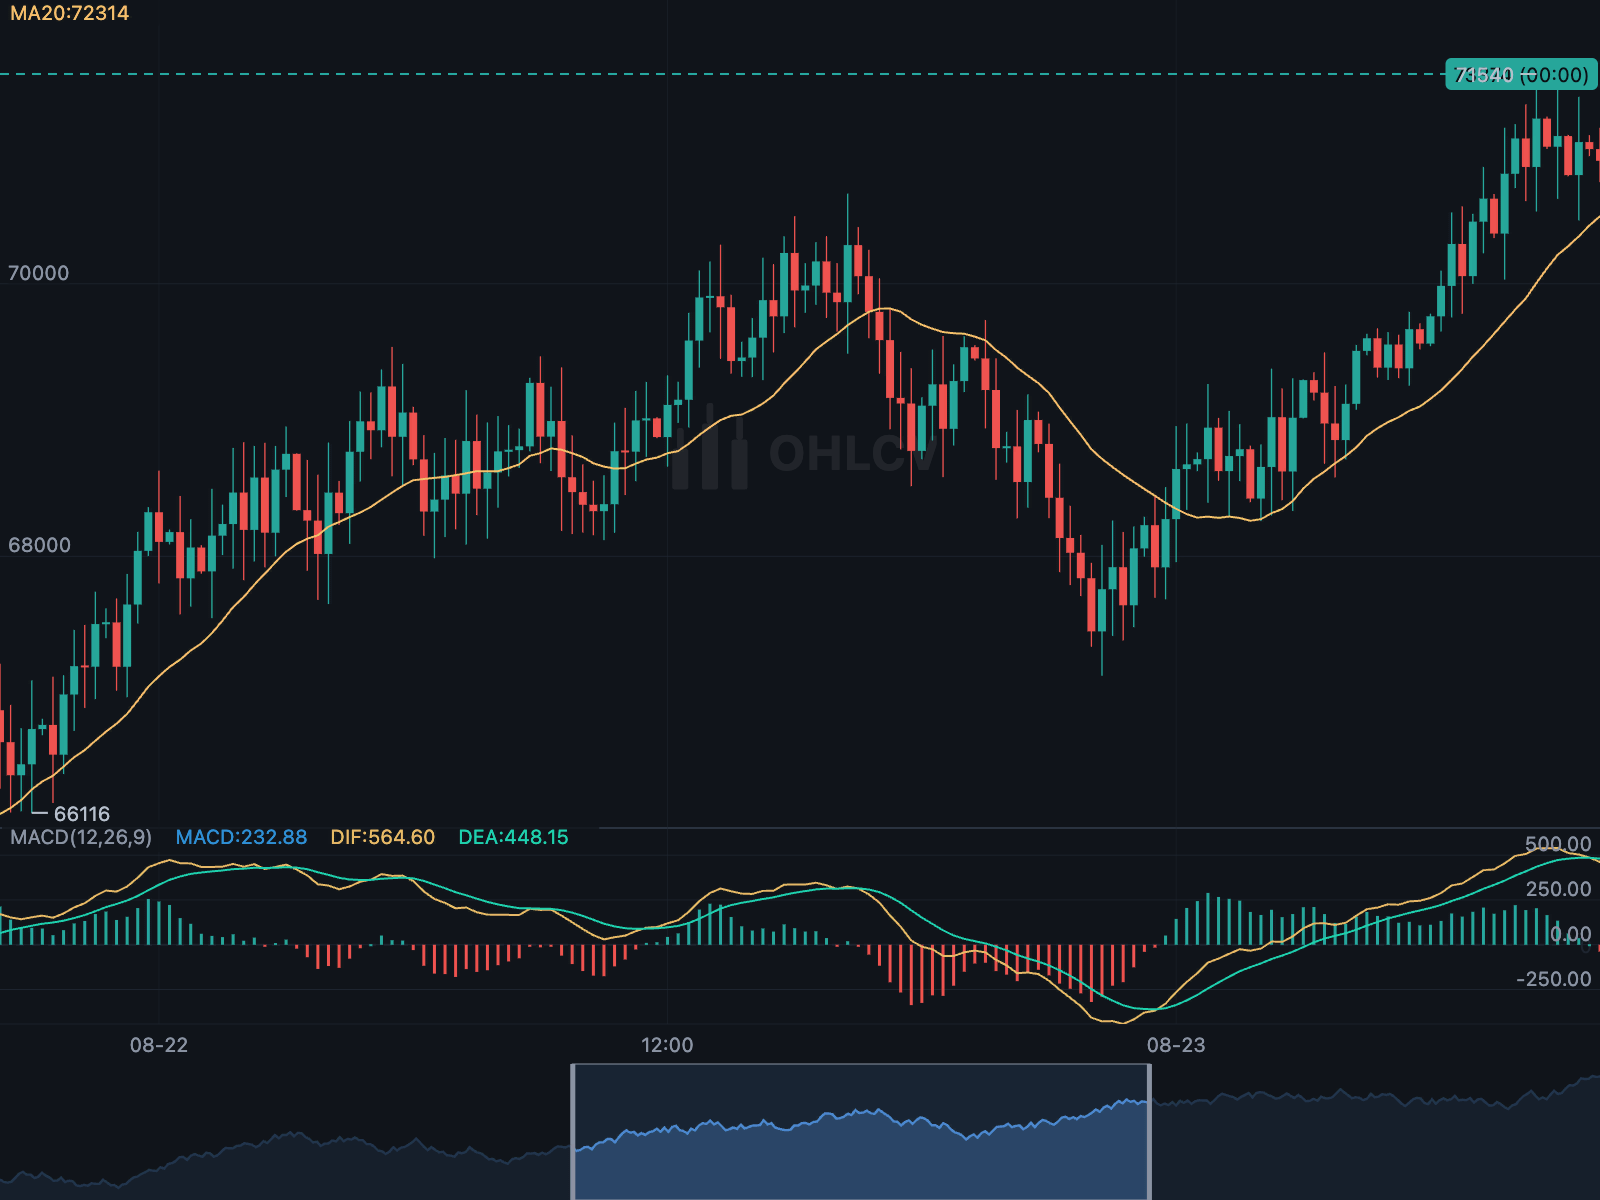 The overview strip The full series below the chart, with the visible range highlighted. |
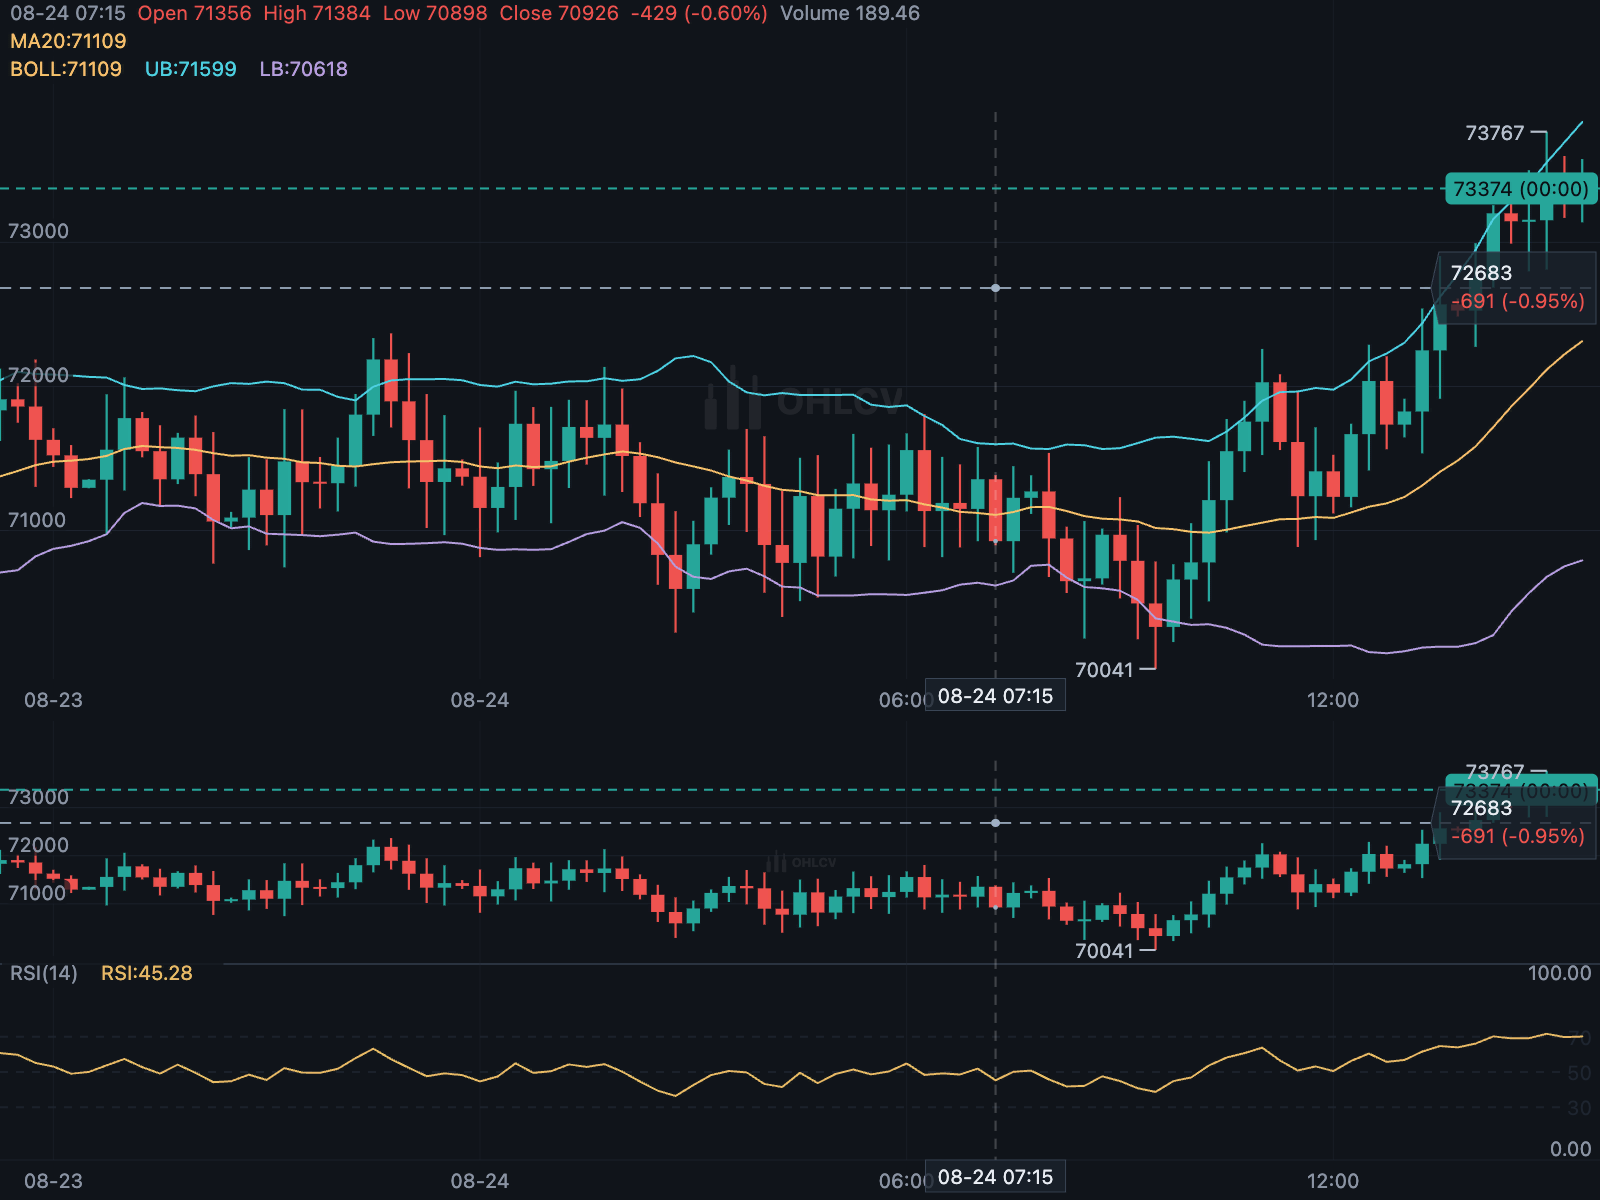 Linked charts Two charts with a synchronised crosshair. |
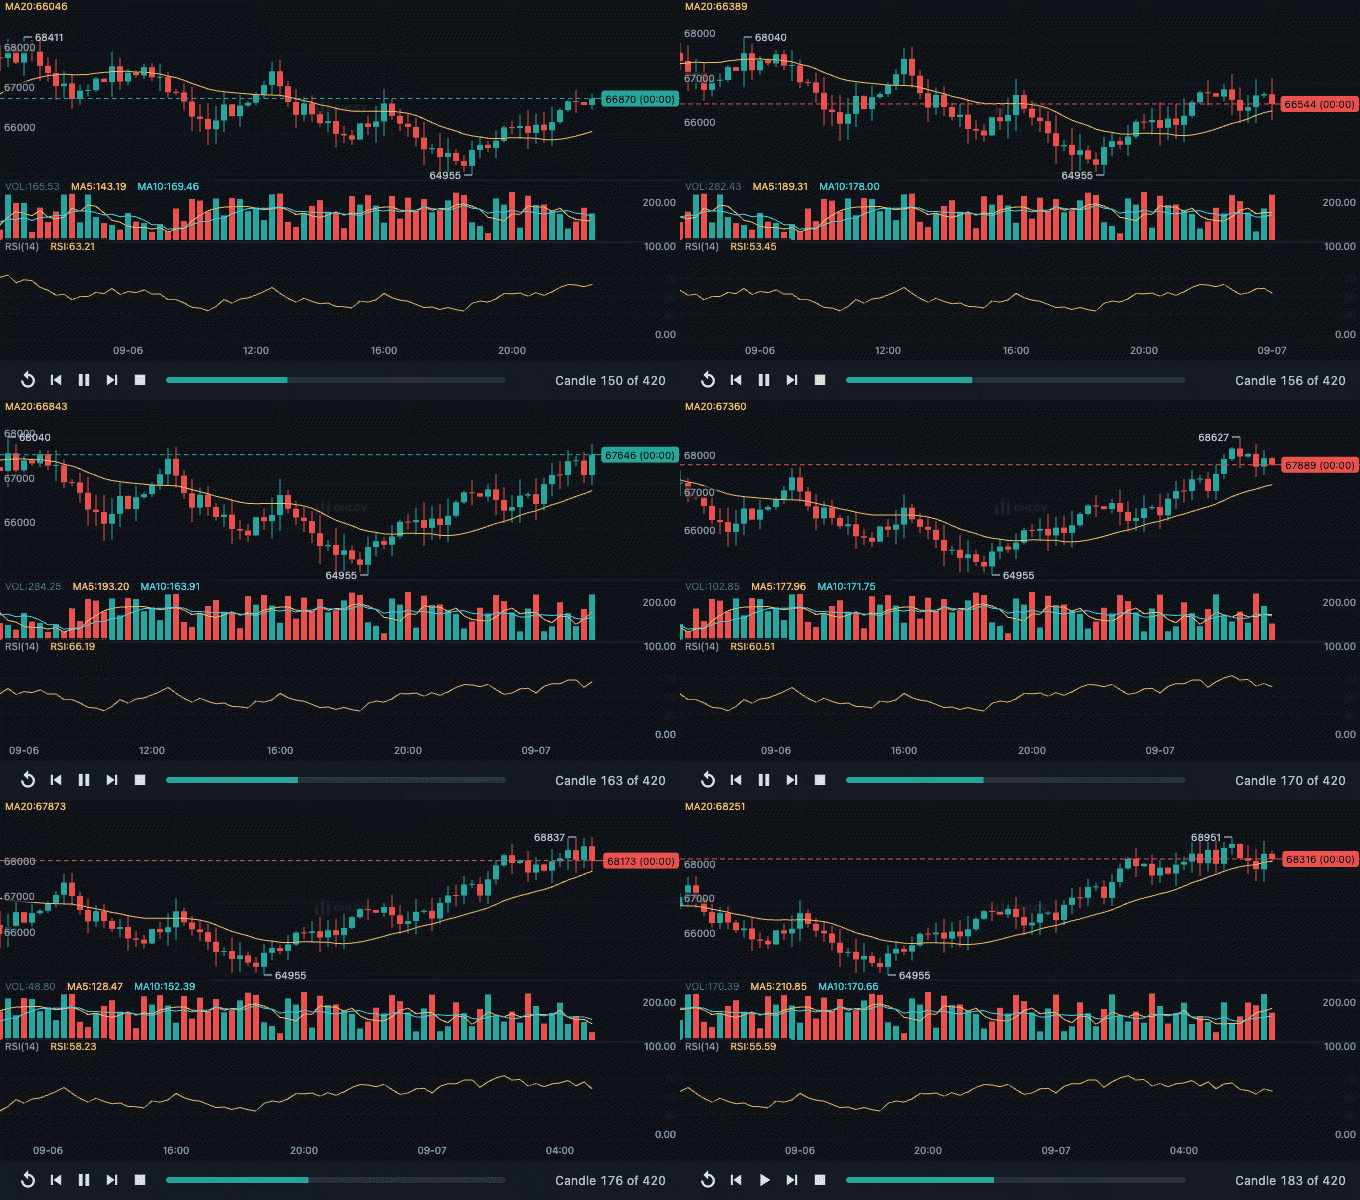 Bar replay Rewind, then step or play forward candle by candle. |
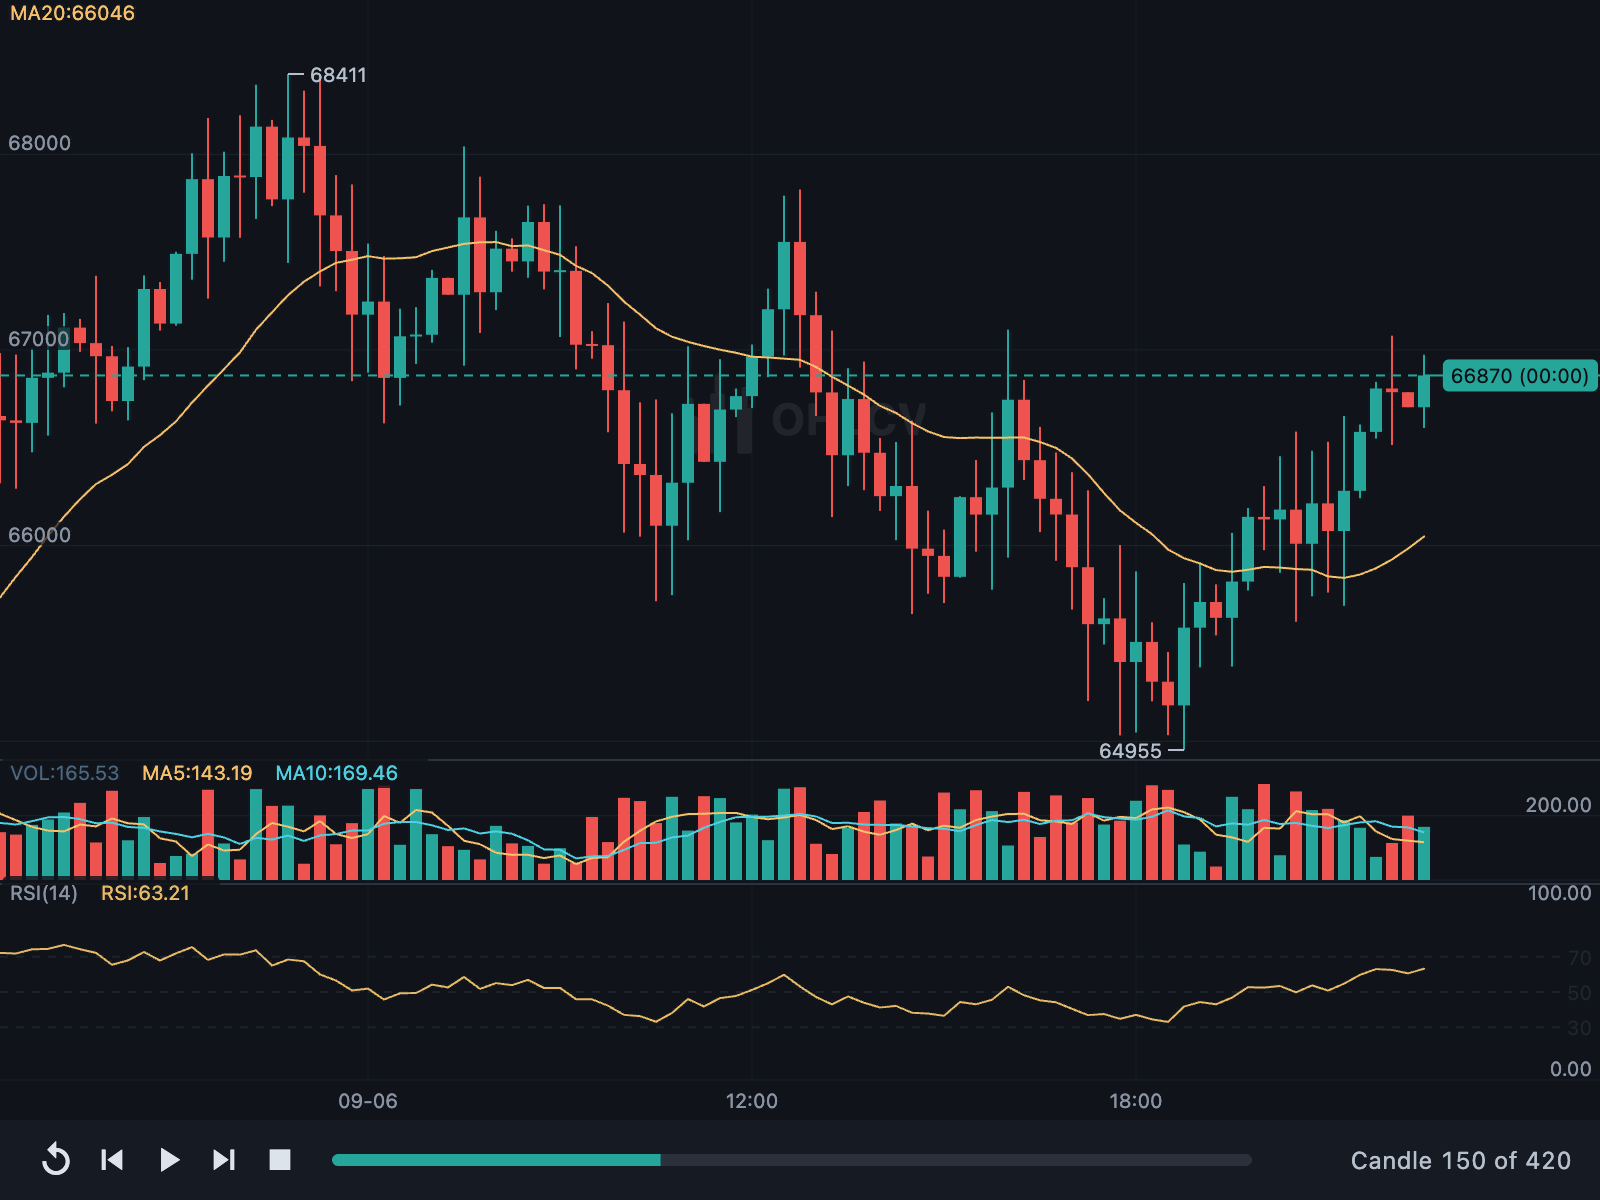 Replay controls Paused at candle 150 of 420, with the playback bar. |
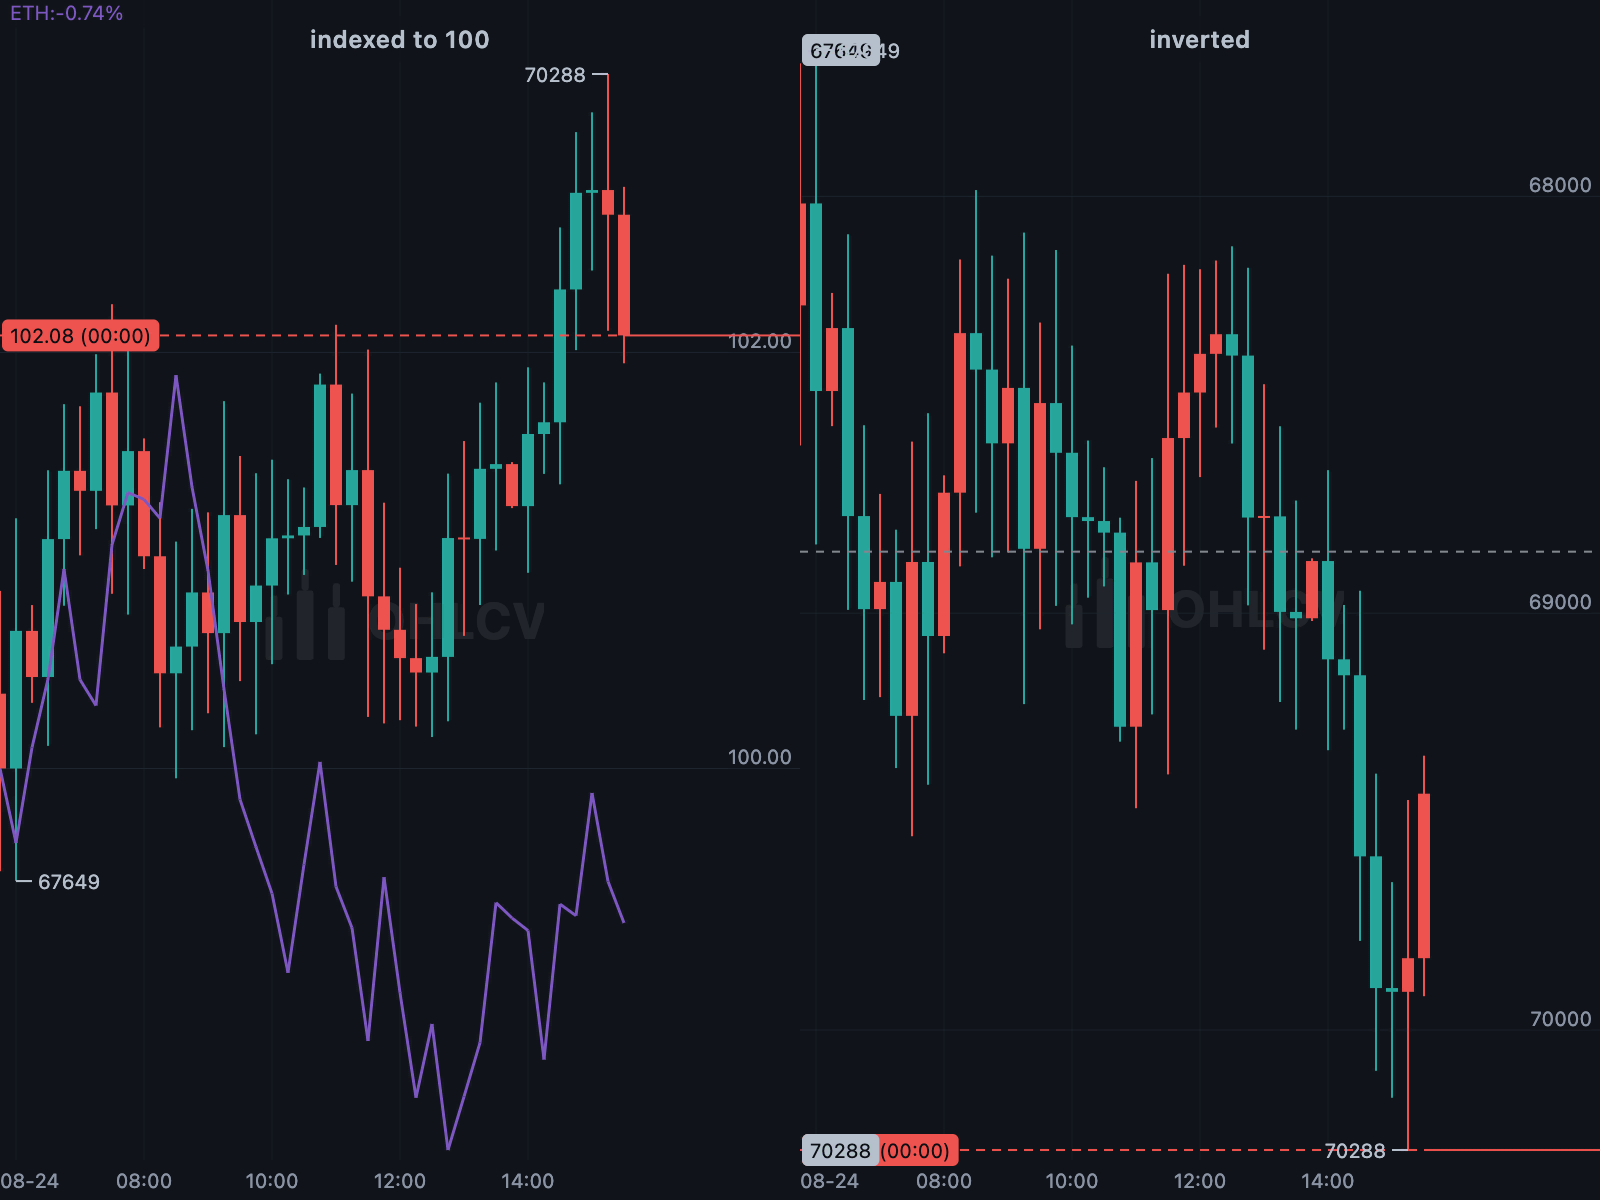 Four price axes Linear, logarithmic, percentage or indexed to 100, and invertible. |
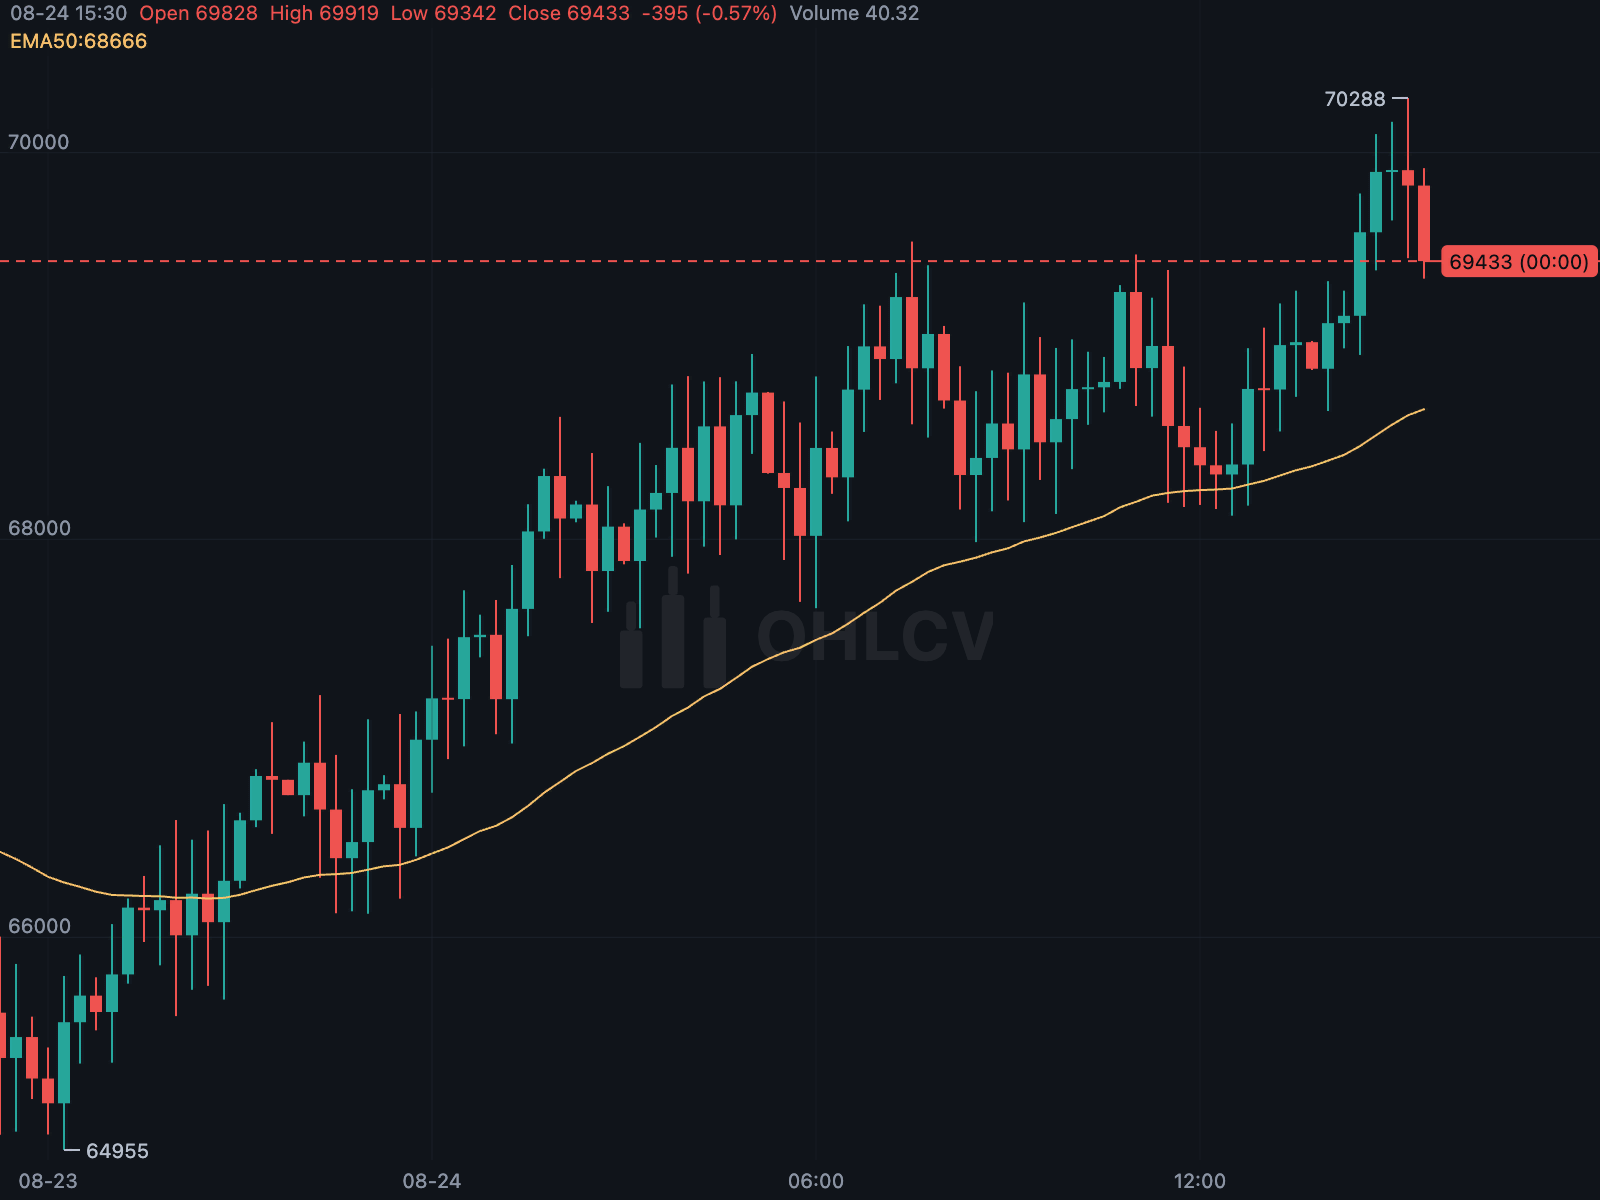 Logarithmic axis Evenly spaced ratios for long-term price history. |
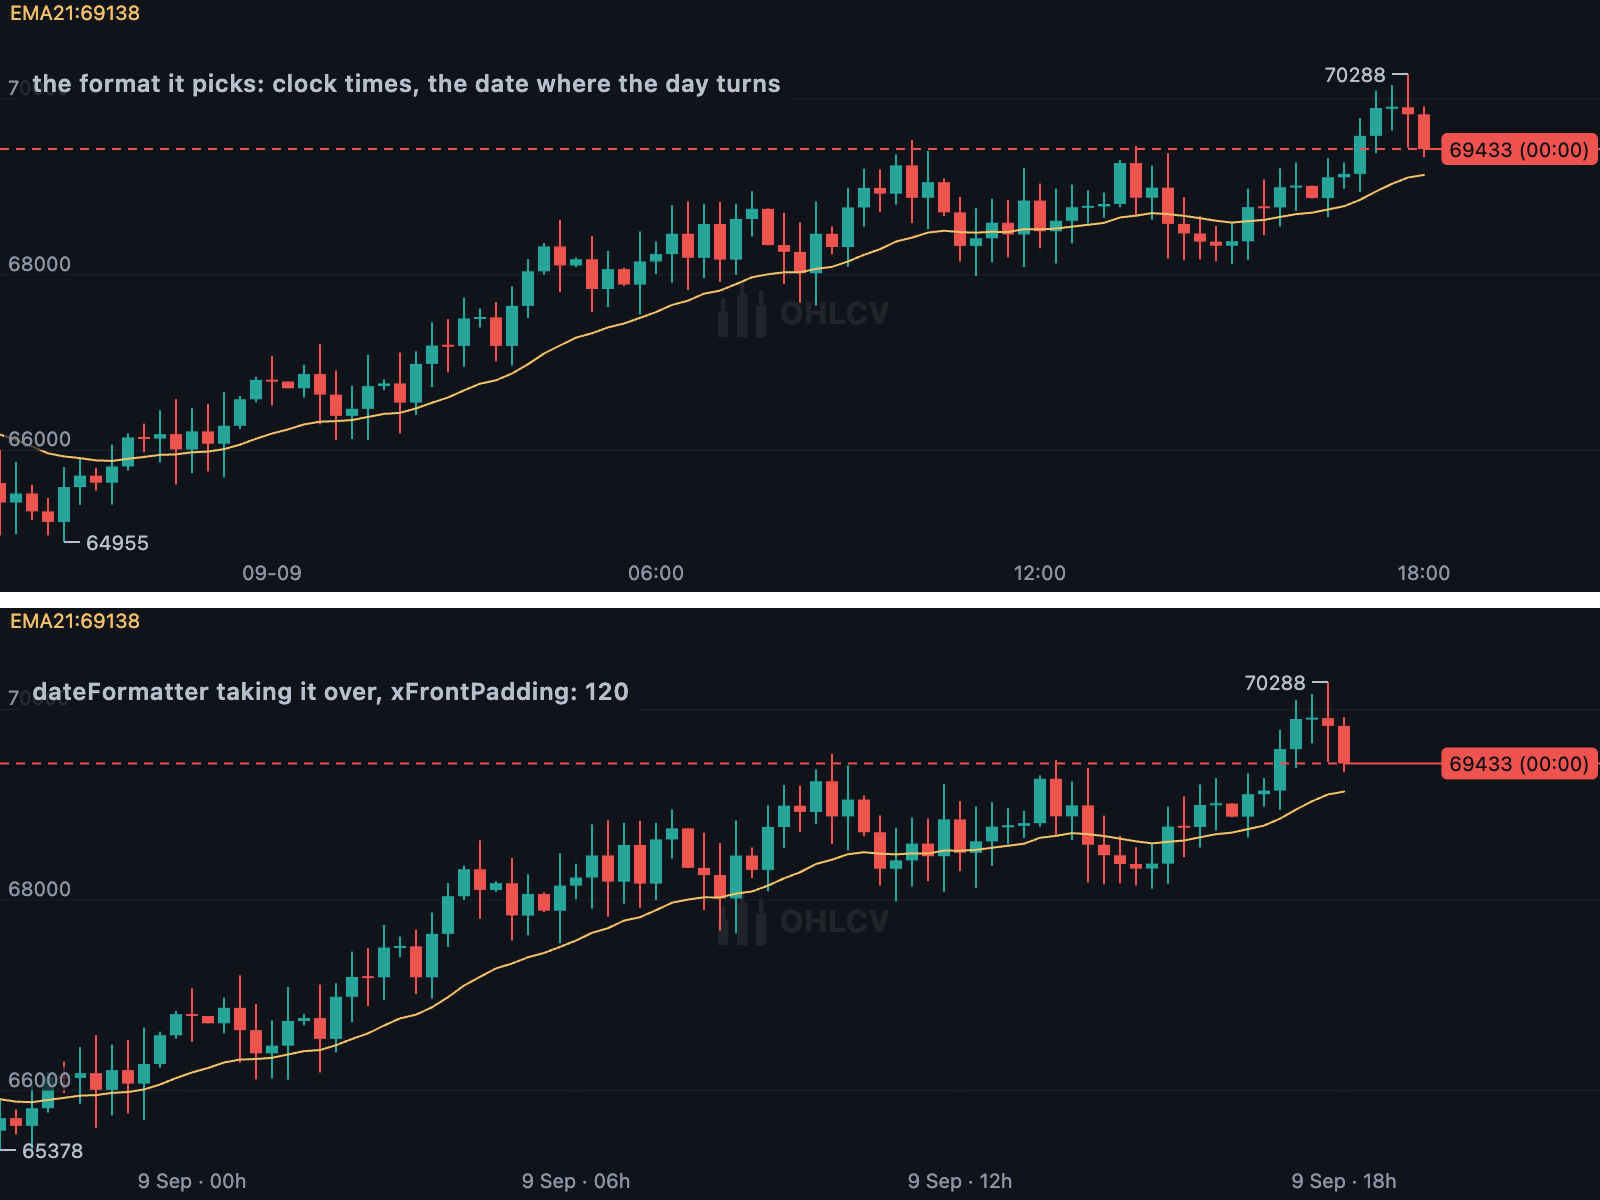 The date axis Automatic round time intervals, or a custom formatter. |
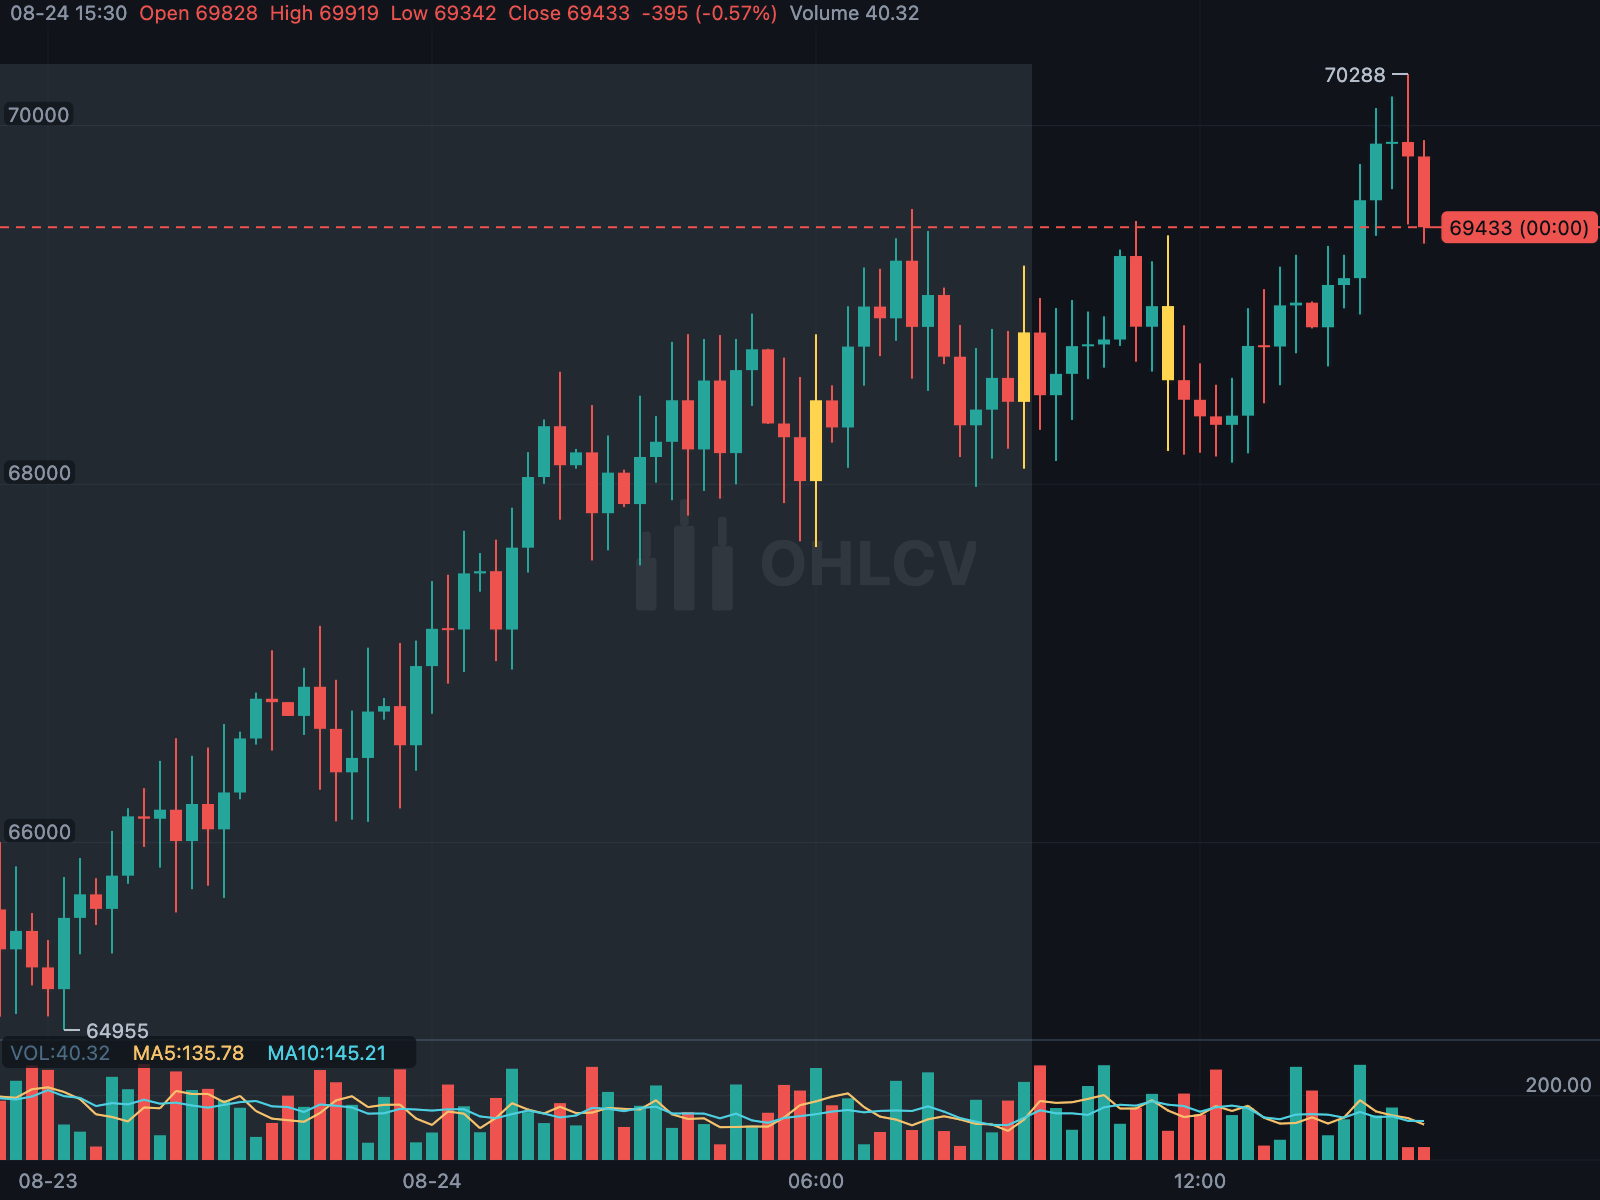 Sessions and time zones Pre-market and after-hours periods shaded behind the candles. |
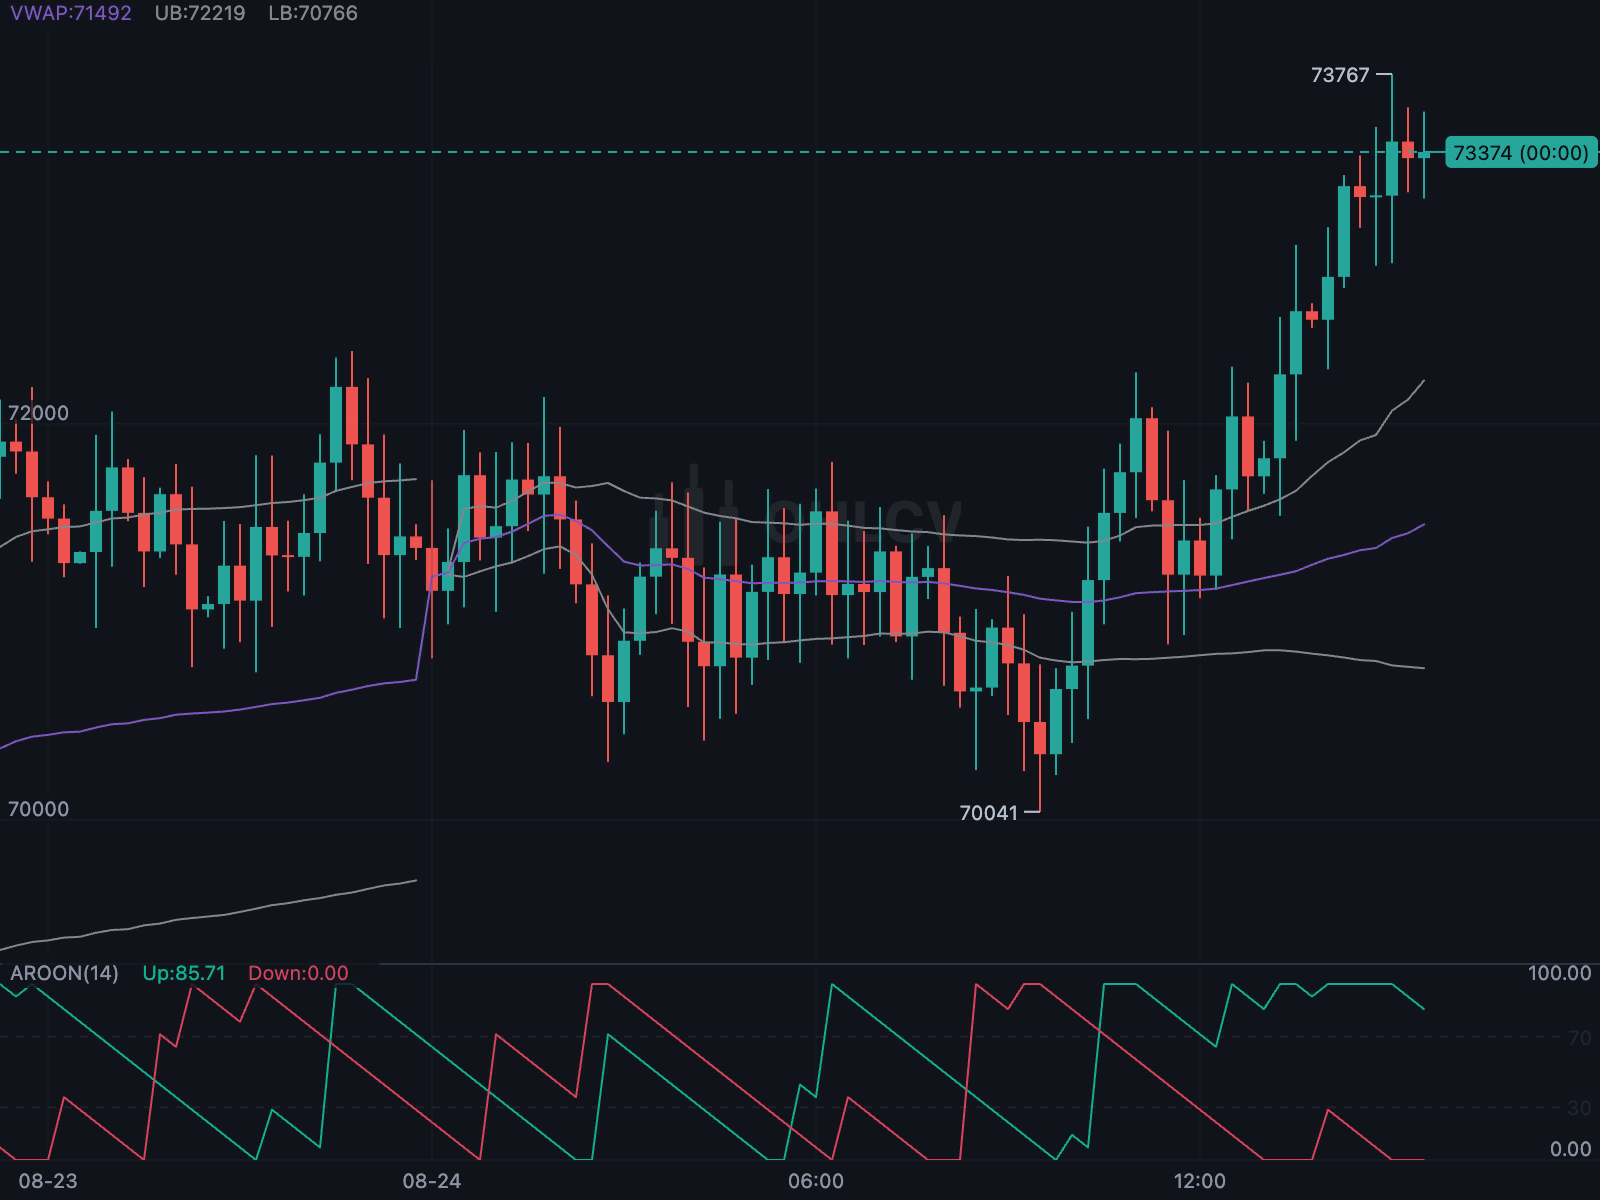 Session VWAP VWAP reset each session, with standard-deviation bands. |
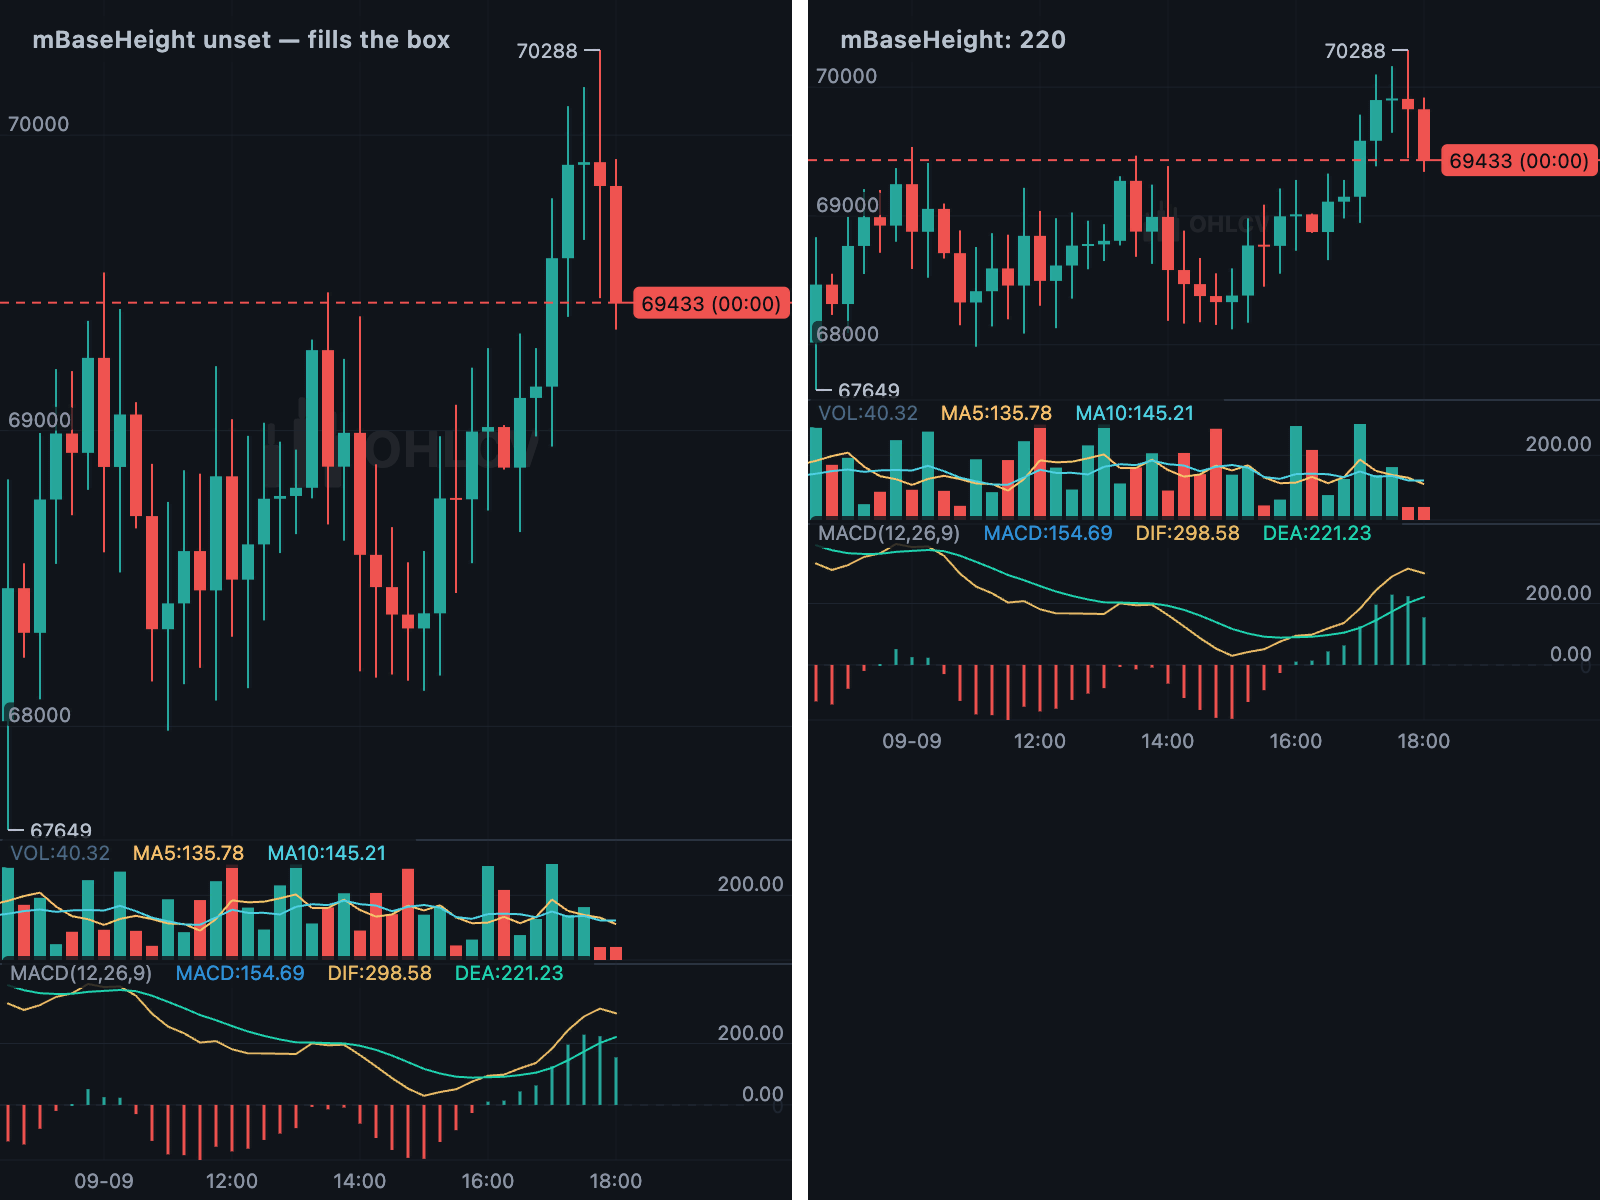 Responsive sizing The candle area filling its container, or set to a fixed height. |
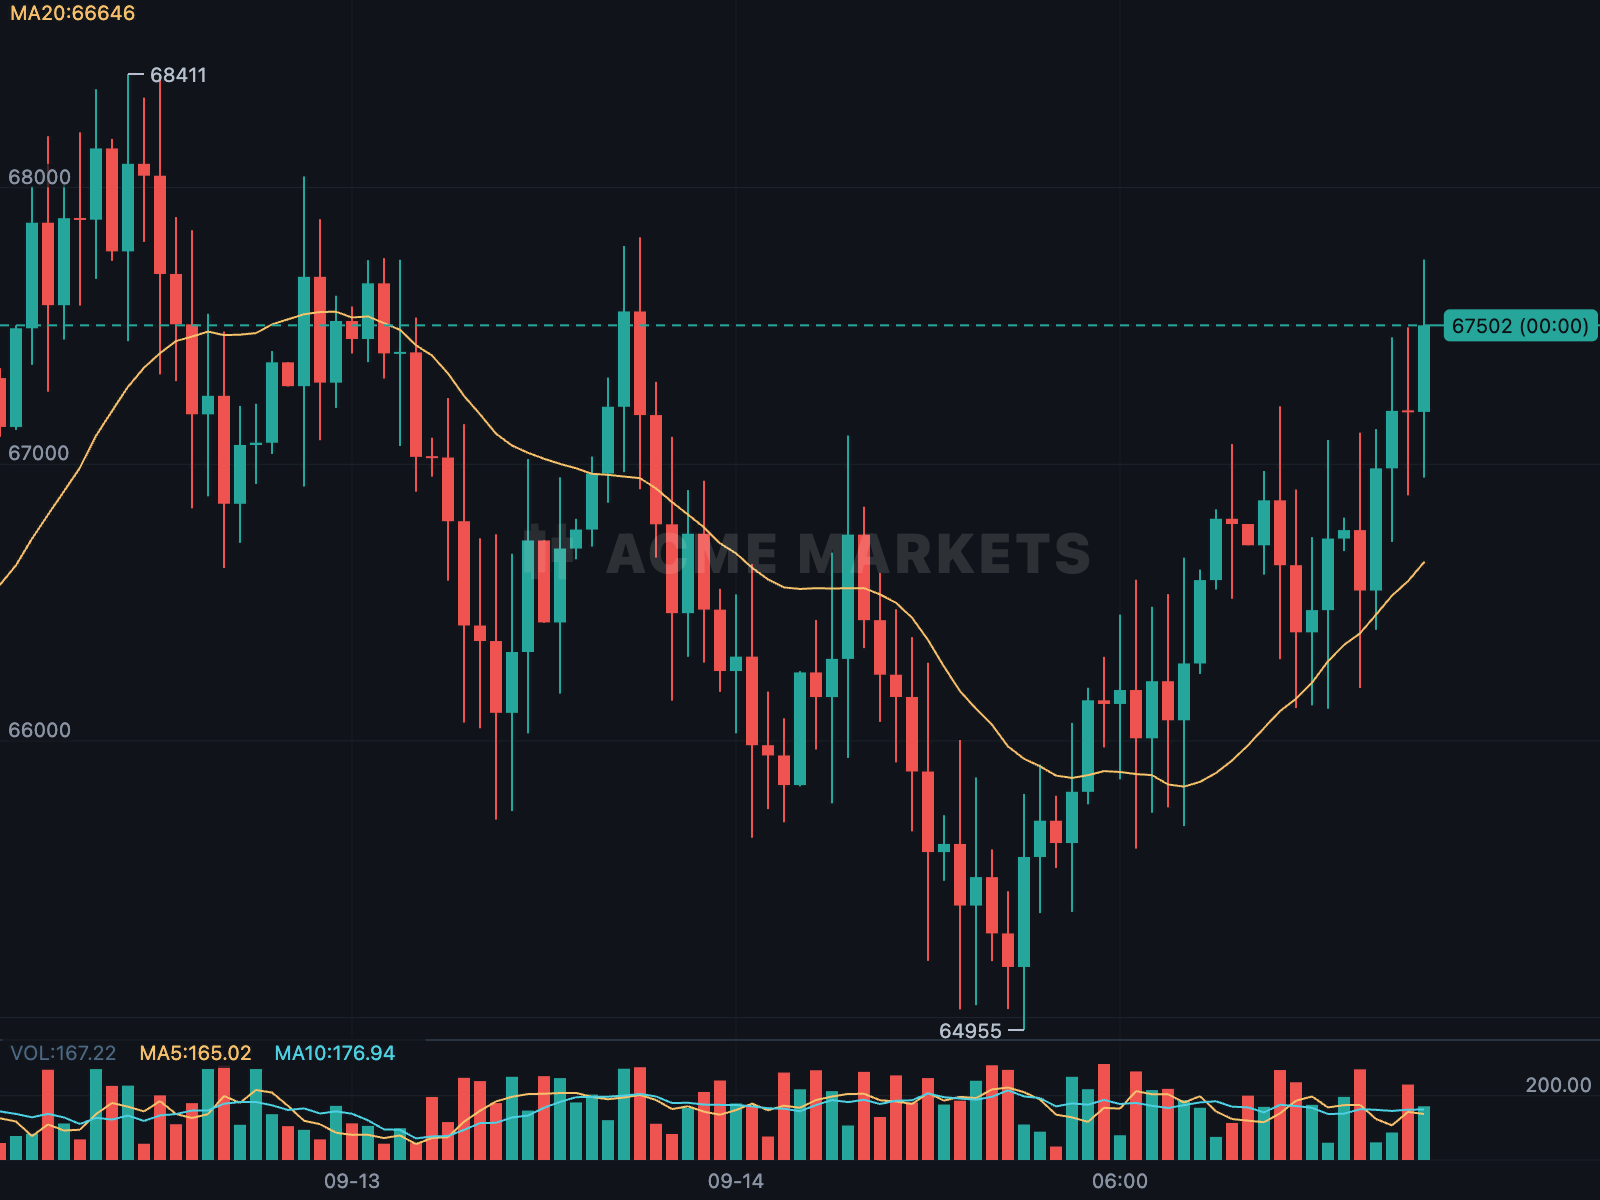 Custom watermark Any widget, rendered faintly over the candle area. |
ohlcv_chart covers both the trading screen and the balance, growth and
reporting charts that surround it, in a single dependency. The name refers to
the open, high, low, close and volume data the candlestick chart renders.
The entire package is free, including for commercial use. Every chart type, indicator and drawing tool is included; there is no paid tier.
Note
The package is updated frequently, and the feature list below is a summary.
See CHANGELOG.md for what changed in each release, and
doc/ for a reference page per feature.
- Eight chart types — candles, OHLC bars, line, step line, area, HLC area, baseline and columns — plus Heikin-Ashi, Renko, three-line break, Kagi, point & figure and range bars as transforms of the source candles.
- Four price scales — linear, logarithmic, percentage or indexed to 100. The axis can be inverted and can mark the visible high, low and average close.
- Interactive price scale — drag the axis labels to stretch or compress the candles, drag the chart to pan, and double-tap to refit. All of it is also available through the controller.
- Fixed price range —
lockPriceScaleholds the axis at a set range instead of refitting it while scrolling, andpriceAxisWidthreserves a gutter so the candles never run underneath the labels. - Round axis values — both axes pick readable values first (
69000,69500,70000; intraday dates on the hour) and place gridlines to match. - Responsive sizing — the candle area takes the height left over by the volume and indicator panes, from a phone to a desktop window.
- 31 indicators, each a configured instance rather than a flag, so
ATR(8),ATR(14)andATR(20)can run side by side with their own settings and colours. - Overlays —
MA,EMA,BOLL,SAR, Supertrend, Keltner and Donchian channels, the Ichimoku Cloud, pivot points, a volume profile, andVWAP(whole-series, anchored to a candle, or per session with standard-deviation bands). - Swing analysis — ZigZag, Fibonacci retracement of the latest swing and Elliott wave labels, sized to the market by default.
- Sub-chart panes —
MACD,KDJ,RSI,WR,CCI,ATR,OBV,MFI,DMI, Aroon, Stochastic RSI,ROC,TRIX, volume average and the Awesome Oscillator, each in a stacked pane that can be resized and reordered. - Higher timeframes — for example, a daily moving average on a
15-minute chart via
TimeframeIndicator. Values come only from bars closed before each candle opened, so the line never repaints. - Composition and alerts — compute any indicator over another's output, use logarithmic or percentage pane scales, and raise alerts on conditions such as RSI above 70.
- Indicator templates — save a named set of indicators and apply it to any chart; four starter sets are included.
- 29 tools — horizontal levels and rays, trend lines, arrows, extended lines, rectangles, ellipses, triangles, parallel channels, pitchforks, Gann fans and boxes, four Fibonacci tools, regression trend, XABCD patterns, multi-leg paths, price and date ranges, a measuring tool, long/short positions with risk-to-reward, notes, callouts, flags and freehand. Each can be placed, moved, locked, hidden and removed.
- Line editor — opens on selection with colour, opacity, width, line style,
fill, label, alerts, lock and delete. Every control is customisable through
DrawingStyle. - Undo and redo through
ChartDrawingController, with ⌘Z, ⇧⌘Z and Delete shortcuts. - Multi-select — shift- or ⌘-click, or ⌘A, then move, restyle or delete as a group; ⌘C, ⌘V and ⌘D copy, paste and duplicate, and ⌘] / ⌘[ change stacking order.
- Precise placement — a dialog for entering each anchor's price and candle directly.
- Style templates — save a drawing's appearance and apply it to others.
- Persistence — drawings serialise to JSON with
drawings.toJson()and load back withChartDrawings.fromJson. - Drawing manager — a ready-made panel listing all drawings, with show/hide, lock, delete, undo, redo and clear.
- Price alerts on horizontal levels, trend lines, channel boundaries and Fibonacci levels, triggered when price crosses them.
- Crosshair and OHLC legend on hover, for desktop and web.
- Long-press readout — the built-in Material card or your own builder.
- Context menu on the chart and on drawings, extensible with your own items.
KChartController— zoom, jump back to the latest candle and export the chart as a PNG.- Visible range — read and set the visible candles, go to a date, fit to screen, and listen for changes.
- Overview strip —
ChartOverviewshows the full history with the visible range highlighted; drag to scroll, drag its edges to zoom, tap to jump. - Linked charts —
ChartLinksynchronises the visible range and crosshair across any number of charts;ChartLink.all()also syncs the price axis. - Static mode —
scrollEnabledandzoomEnableddisable built-in gestures for thumbnails and fixed figures, while programmatic control still works. - Bar replay — rewind to any candle and step or play forward, with indicators limited to the data revealed so far.
- Orders and positions — live lines showing side, size and P&L, draggable to modify.
- Signal markers — buy and sell markers pinned to candles.
- Event marks — tappable badges for earnings, dividends, splits and news.
- Symbol comparison — overlay any number of instruments, rebased for relative performance and aligned by timestamp.
- Sessions and time zones — session dividers, a display time zone, extended-hours shading and per-bar colours.
- Live price line with a countdown to the current candle's close.
SeriesChart— lines with four curve styles, areas with baseline fills that change colour where they cross it, grouped, stacked and floating bars, scatter plots, error bars, bands, custom or hidden axes, horizontal orientation, custom tooltips, shared crosshairs, a range selector for long data, and animated updates.PieChart— pie, doughnut (with a widget in the centre) or ring gauge, with exploded slices and badges.RadarChart— multi-series radar charts, one outline per series.HeatmapChart— a grid coloured by value from a matrix or sparse cells, with continuous or stepped colour scales, cell and axis labels, a legend and a hover readout. Suited to contribution graphs, correlation matrices and time-of-day breakdowns.TreemapChart— squarified tiles sized by value, with nested groups, colour scales for market maps, labels, touch and tooltips.GaugeChart— a dial or semicircle for a single value, with coloured ranges, a needle, ticks, centre text and animated transitions.WaterfallChart— a bridge from an opening total to a closing one, step by step, with subtotals, connectors and values over the bars.FunnelChart— tapered or stepped stages with conversion percentages, fitted or side labels, touch and tooltips.SankeyChart— flows between nodes as ribbons sized by value, with automatic columns, node and link touch, and highlight on hover.SunburstChart— a hierarchy as rings round a centre, from the same tree a treemap takes, with curved labels, a centre widget and touch.BoxPlotChart— quartiles, whiskers, mean and outliers side by side, with the statistics worked out from raw samples for you.HistogramChart— the shape of a distribution, with binning by count or width, a colour for negative bins and reference lines.BubbleChart— risk against return with a third number as bubble area, with axis titles, reference lines and labelled bubbles.CalendarChart— daily profit and loss as real months, each day coloured by its value, with monthly totals in the headers.EquityCurveChart— an account's value with an underwater drawdown panel, the deepest fall marked, and drawdown statistics you can read yourself.OptionPayoffChart— an options strategy's profit at expiry, with exact break-evens, strike lines, the spot marked, and profit and loss shaded apart.VolatilityCurveChart— implied volatility smiles, skews and term structures, several expiries at once with a crosshair that reads them all.MarketProfileChart— time at price as TPO letters, with the point of control and the value area worked out from your candles.FootprintChart— bid against ask volume at every price inside every bar, shaded by size, with imbalances outlined and cumulative delta.BookHeatmapChart— resting order-book liquidity over time, walls showing as bright lines, with a mid-price track and a crosshair readout.CumulativeDeltaChart— buying less selling as a running total with each bar's own delta beneath, and divergences against price marked.TradeTimelineChart— every trade as a bar from entry to exit, a lane per symbol, coloured by result, with an open-trade count beneath.RMultipleChart— trade results in R, with expectancy, win rate, profit factor and SQN worked out for you.MonteCarloChart— a fan of simulated equity paths as percentile bands, with the odds of loss and ruin and the real curve laid over.SeasonalityChart— returns by month and year or weekday and hour, with yearly totals and the typical month worked out for you.DepthChart— order-book depth as a cumulative curve, per-level histogram, both combined, or a numeric ladder; on a linear, logarithmic or percentage axis, zoomable around the mid price, with an optional bid/ask ratio bar.
- Theming —
ChartStylefor layout,ChartColorsfor colours,DrawingStylefor drawing tools andChartTranslationsfor every label. Includes filled or hollow candles, crosshair style, pane separators and axis-label pills. - Watermark — any widget, such as an
Image.assetlogo, painted as a faint single-colour overlay on the candle area.
- Dart 3.6 or later
- Flutter 3.27 or later
dependencies:
ohlcv_chart: ^2.6.0Pass a list of KLineEntity to KChartWidget. Call DataUtil.calculate first
so the indicator values are populated:
import 'package:ohlcv_chart/ohlcv_chart.dart';

DataUtil.calculate(candles);

KChartWidget(
  candles,
  ChartColors(),
  timeFrame: const Duration(minutes: 15),
  indicators: [MaIndicator(period: 20), MacdIndicator()],
  fixedLength: 2,
);
See Candlestick chart for the full constructor reference. The example app demonstrates every option in the package.
Each feature has a reference page in doc/:
| Page | Covers |
|---|---|
| Candlestick chart | The main chart widget and the KLineEntity data model |
| Series charts | SeriesChart: lines, areas, bars, scatter, touch, range selector and animation |
| Pie chart | PieChart: sections, doughnut charts, badges and touch |
| Radar chart | RadarChart: multi-series comparison across features |
| Heatmap | HeatmapChart: value-coloured grids, colour scales and legends |
| Treemap | TreemapChart: tiles sized by value, groups and market maps |
| Gauge | GaugeChart: dials with ranges, needle, ticks and centre content |
| Waterfall | WaterfallChart: a total built up step by step |
| Funnel | FunnelChart: stage drop-off with conversion percentages |
| Sankey | SankeyChart: flows between nodes, sized by value |
| Sunburst | SunburstChart: a hierarchy as rings round a centre |
| Box plot | BoxPlotChart: quartiles, whiskers and outliers |
| Histogram | HistogramChart: distribution shape, with binning helpers |
| Bubble | BubbleChart: three numbers at once, size carried by area |
| Calendar | CalendarChart: daily values laid out as real months |
| Equity curve | EquityCurveChart: equity with an underwater drawdown panel |
| Options payoff | OptionPayoffChart: strategy profit at expiry, with break-evens |
| Volatility curve | VolatilityCurveChart: smiles, skews and term structures |
| Market profile | MarketProfileChart: time at price, TPO letters and value area |
| Footprint | FootprintChart: bid and ask volume at every price, order flow |
| Order-book heatmap | BookHeatmapChart: resting liquidity over time |
| Open interest and funding | OpenInterestChart: how much money is in the trade, and who is paying |
| Liquidity map | LiquidityMapChart: where the stops are, and what a move would set off |
| Cumulative delta | CumulativeDeltaChart: running delta with divergences |
| Trade timeline | TradeTimelineChart: when each trade was open, and what it made |
| R-multiple distribution | RMultipleChart: results in R, with expectancy and SQN |
| Monte Carlo fan | MonteCarloChart: simulated equity paths as percentile bands |
| Seasonality | SeasonalityChart: results by month and year, or weekday and hour |
| Sparkline grid | SparklineGrid: dozens of little charts in one table |
| Parallel coordinates | ParallelChart: many things on many measures, one axis each |
| Chord | ChordChart: flow between nodes both ways round a ring |
| Marimekko | MarimekkoChart: two dimensions at once, column width and cell height |
| Stream graph | StreamChart: a stack that flows, on a wiggle baseline |
| Violin and ridgeline | ViolinChart: the shape of a distribution, not just its quartiles |
| Slope and bump | SlopeChart: how things moved between periods, by value or by rank |
| Dumbbell | DumbbellChart: two values a row, joined by a bar |
| Waffle | WaffleChart: parts of a whole as a grid of squares |
| Bullet | BulletChart: a measure against its target on a banded track |
| Pair spread | PairSpreadChart: the spread or ratio of two symbols, with z-score bands |
| Indicators | All 31 indicators, the catalogue, pane scales, chaining, higher timeframes and alerts |
| Symbol comparison | Overlaying other instruments, rebased or at actual prices |
| Chart types | Eight chart types and six candle transforms |
| Price axis | Scale types, inversion, dragging, locking and label gutter |
| Date axis | Automatic time intervals and custom formatting |
| Legend and crosshair | The OHLC legend and hover crosshair |
| Long-press readout | The candle details card and custom builders |
| Drawing tools | All 29 tools, persistence, undo, multi-select, templates and alerts |
| Customising the line editor | Configuring the editor through DrawingStyle |
| Orders and positions | Live order and position lines, labelled and draggable |
| Event marks | Earnings, dividend, split and news markers |
| Sessions and time zones | Session dividers, display time zone, extended hours and per-bar colours |
| Driving the chart | KChartController, the visible range and static charts |
| Panes | Stacking, resizing and reordering indicator panes |
| Bar replay | Replaying historical data candle by candle |
| Sizing | How the candle area and panes share the available height |
| Depth chart | DepthChart: four display modes and three scales |
| Theming | ChartStyle, ChartColors and ChartTranslations |
| Migrating from 1.x | Breaking changes and their replacements |
| Migrating from fl_chart and candlesticks | API mapping from both packages, with examples |
- The zoom slider is shown only on platforms without pinch gestures (web and desktop).
watermarkpaints the widget inChartColors.watermarkColor, so full-colour logos render as a silhouette. The package does not depend onflutter_svg; to use an SVG, passSvgPicture.asset(...)from that package.
If ohlcv_chart is useful to you, please consider:
- starring the repository
- liking the package on pub.dev
- following CtrlAltDevelop on GitHub
It helps other developers find the package and supports its continued
development. Bug reports and pull requests are welcome — see
CONTRIBUTING.md.
The rendering core is derived from the open-source k_chart package and has
since been substantially extended with drawing tools, signals, multi-indicator
stacking and a reworked rendering pipeline.
Released under the MIT License. See LICENSE.