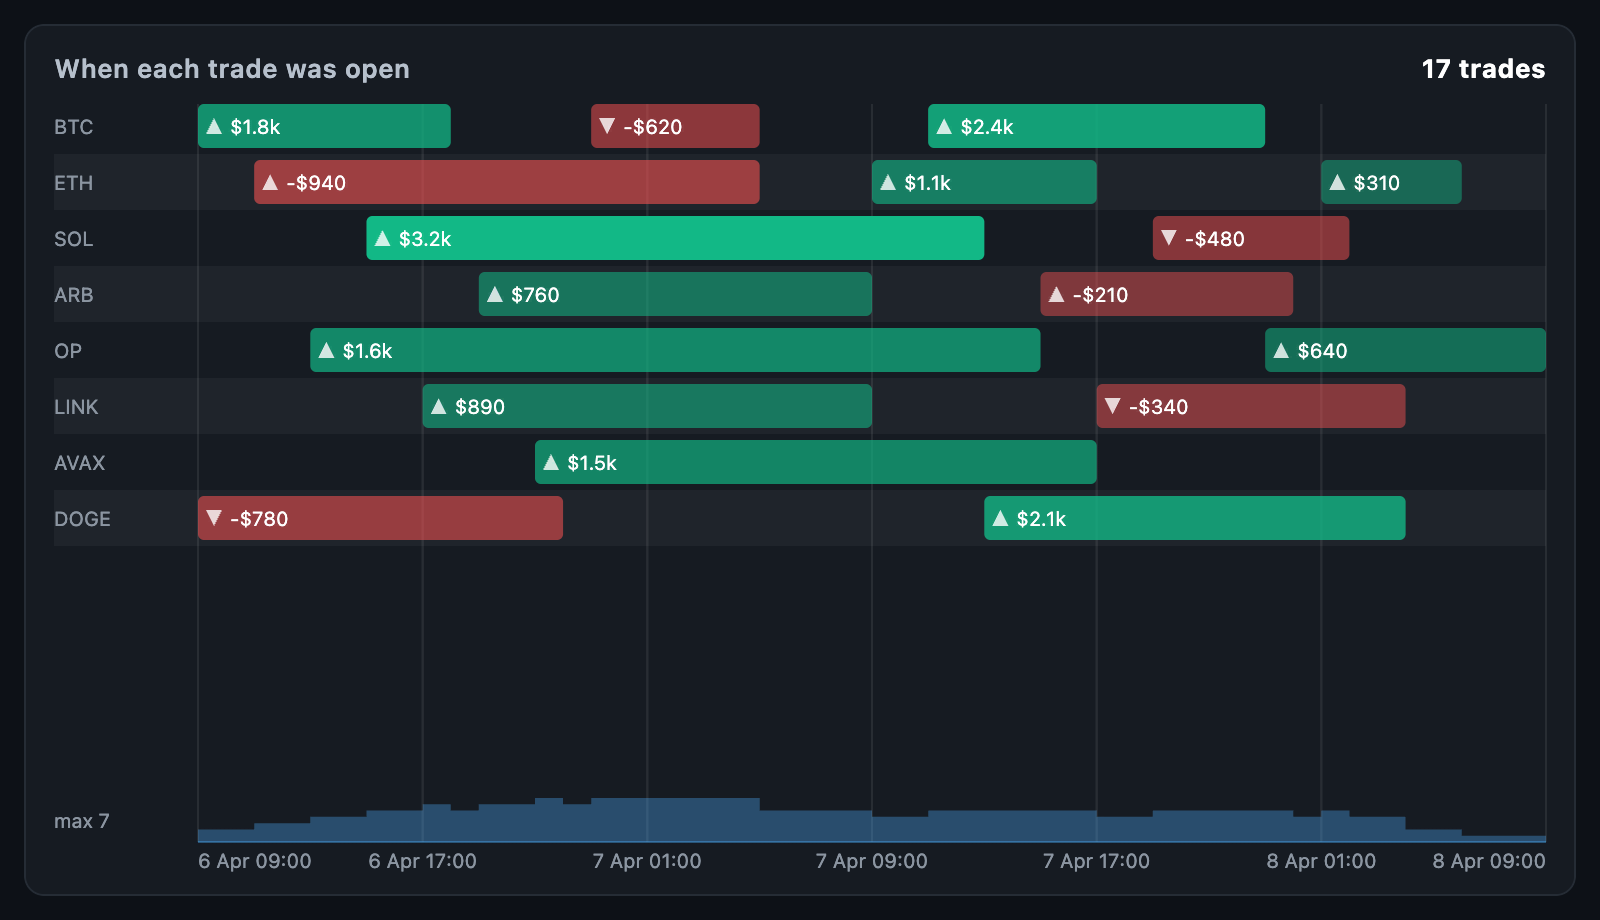
TradeTimelineChart shows when an account was in the market. Each trade is a
bar from entry to exit, coloured by what it made, in a lane per symbol; a strip
beneath counts how many trades were open at once.
TradeTimelineChart(
  now: DateTime.now(),
  trades: [
    TimelineTrade(
      lane: 'BTCUSDT',
      entryTime: DateTime(2026, 9, 1, 9, 30),
      exitTime: DateTime(2026, 9, 1, 14),
      side: TradeSide.buy,
      pnl: 412.5,
    ),
    TimelineTrade(
      lane: 'ETHUSDT',
      entryTime: DateTime(2026, 9, 1, 11),
      side: TradeSide.sell,
      pnl: -38,
    ),
  ],
);
The chart fills its constraints. When the height is unbounded, it uses
defaultHeight.
TimelineTrade field |
Description |
|---|---|
entryTime |
When the trade was entered |
exitTime |
When it was left; null while open |
lane |
The lane it is drawn in, usually the symbol; null for one unnamed lane |
side |
TradeSide.buy or TradeSide.sell, shown as an arrow at the entry |
pnl |
Realised or unrealised result; null draws it as flat |
entryPrice, exitPrice, quantity |
Carried for your own tooltip |
color |
A colour of this trade's own |
data |
Arbitrary app data, returned on touch |
Open trades run to now, which defaults to the latest time among the trades.
Their right edge is square with a notch, since they have not ended.
Lanes appear in the order their name first appears. Trades in one lane that
overlap are packed into as few rows as possible; a trade that starts exactly as
another ends shares its row. Rows are at most maxRowHeight tall and shrink to
fit a short box.
| Parameter | Description |
|---|---|
start, end |
The visible span; null runs from the first entry to the last exit |
now |
Where open trades end, and where the now line is drawn |
laneGap, rowGap, maxRowHeight |
Spacing |
minBarWidth |
The narrowest a bar is drawn, so a scalp still shows |
showLaneLabels, laneLabelWidth, laneLabelStyle |
Lane names, shown when any trade has a lane |
showExposure, exposureHeight, exposureColor |
The open-trade count strip |
showTimeAxis, timeAxisHeight, timeFormatter |
The time axis; the default format suits the span |
padding |
Space around the chart |
Trades wholly outside start–end are left out; the rest are cut to it.
tradeTimelineRange(trades, now:)— the span the trades cover.packTradeRows(trades, now:)— the row each trade takes, in input order.tradeTimelineExposure(trades, now:)— the open-trade count as steps in time order.layOutTradeTimeline(trades, bounds, …)— theTradeTimelineLayoutthe chart paints: itslanesandbars,xOf(time),timeAt(dx)andbarAt(offset).
| Parameter | Description |
|---|---|
profitColor, lossColor, flatColor |
Bar colours by result |
shadeByPnl |
Draws bigger wins and losses stronger |
barRadius |
Corner rounding, as a BorderRadius; an open trade keeps a square right edge |
showSideMarkers, markerColor |
The long or short arrow |
showPnl, pnlFormatter, pnlStyle |
The result, written in bars wide enough |
laneBandColor |
The band behind every other lane |
gridColor, nowColor, crosshairColor |
Grid, now line and pointer line |
axisLabelStyle, backgroundColor |
Axis text and background |
Pointer events are read raw, so the crosshair follows a drag at once. onTouch
reports a TradeTimelineTouchDetails with the bar, its trade and the time
under the pointer, and null when the pointer leaves a trade. A bar narrower
than 8 pixels is touchable across 8.
TradeTimelineChart(
  trades: trades,
  tooltipBuilder: (context, details) => Card(
    child: Padding(
      padding: const EdgeInsets.all(8),
      child: Text('${details.trade.lane} ${details.trade.side.name}\n'
          '${details.trade.pnl}'),
    ),
  ),
);animationDuration draws the bars in from their entries; animationCurve eases
them and animateOnMount controls whether the first build animates. The chart
animates again whenever trades changes identity.