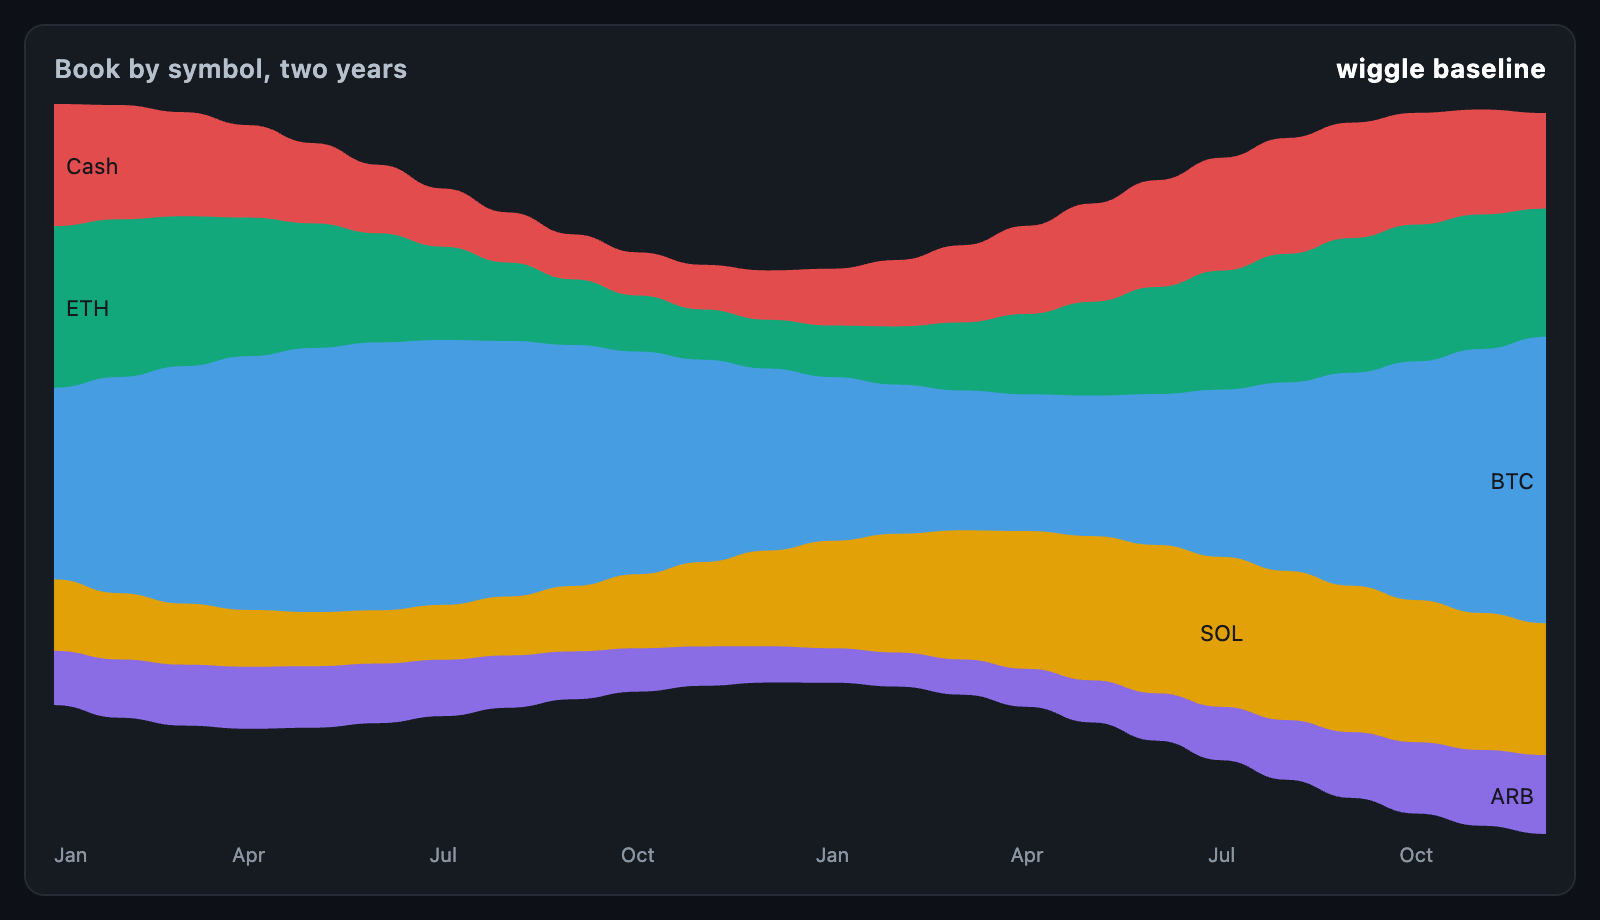
StreamChart draws a stack that flows. The make-up of a portfolio month by
month, volume by venue, positions by symbol: a stacked area answers "how much
in total", and a stream graph on a wiggle baseline answers "what was it made
of", which is usually the question being asked.
StreamChart(
  periodLabels: const ['Jan', 'Feb', 'Mar'],
  series: const [
    StreamSeries(label: 'BTC', values: [40, 55, 48]),
    StreamSeries(label: 'ETH', values: [30, 20, 35]),
    StreamSeries(label: 'Cash', values: [30, 25, 17]),
  ],
);
The chart fills its constraints. In a box with no height it takes
defaultHeight.
A StreamSeries is a label and one value per period. Negative and non-finite
values count as nothing — a stacked band cannot be thinner than nothing without
tearing the stack — so series.valueAt(period) is what is actually drawn.
periods is how many columns are drawn; left out, it is the longest series or
the number of periodLabels, whichever is larger.
baseline |
Where the stack sits |
|---|---|
StreamBaseline.wiggle (default) |
Chosen to keep the bands as level as possible |
StreamBaseline.silhouette |
Centred on one line, thickening either way |
StreamBaseline.zero |
A flat bottom — an ordinary stacked area |
The wiggle baseline is Byron and Wattenberg's: at each step the whole stack is moved so the bands' slopes, weighted by how thick they are, cancel out. That is what makes a stream graph read as flow rather than as growth.
order |
Bottom to top |
|---|---|
StreamOrder.insideOut (default) |
Largest totals in the middle, the rest alternating outwards |
StreamOrder.largestFirst |
Largest total nearest the baseline |
StreamOrder.given |
The order the series were given in |
Inside-out keeps the busiest bands where the stack moves least, which is what keeps a wiggle baseline from throwing the big bands around.
stackStream(series, periods:, baseline:, order:) does all of this on its own
and returns a StreamStack with the order, the bottoms and tops of every
band at every period, and the min and max of the whole stack.
layOutStream(series, size:, periods:, ...) turns a stack into geometry
without a widget. It returns a StreamLayout with the plotRect, the
columnX of each period, the stack itself, and a StreamSeriesLayout per
series holding its closed shape path, its topPoints and bottomPoints, and
thicknessAt(period).
layout.periodAt(x) finds the nearest period and layout.seriesAt(point) the
band under a point, top of the stack first. progress flattens every band
towards the middle of the stack, so the draw-in opens out rather than sliding
in from an edge.
onSeriesTap is called with a band and the period under the finger, and with
nulls when the touch leaves the stack. A line is drawn down that period, the
other bands fade unless fadeUntouched is off, and a card names the band and
its value there; tooltipBuilder replaces the card.
| Field | Default |
|---|---|
palette |
Eight colours, handed out by position |
curved |
Eased edges between periods |
fillOpacity, strokeWidth |
0.9 and 0 |
showLabels, minLabelThickness |
A band is named in its thickest period, if 16px of it fit |
showAxis, axisHeight, axisStyle |
The period labels along the bottom |
crosshairColor |
The line down the touched period |
animationDuration, animationCurve, animateOnMount |
The draw-in |
semanticLabel is what a screen reader announces for the chart.