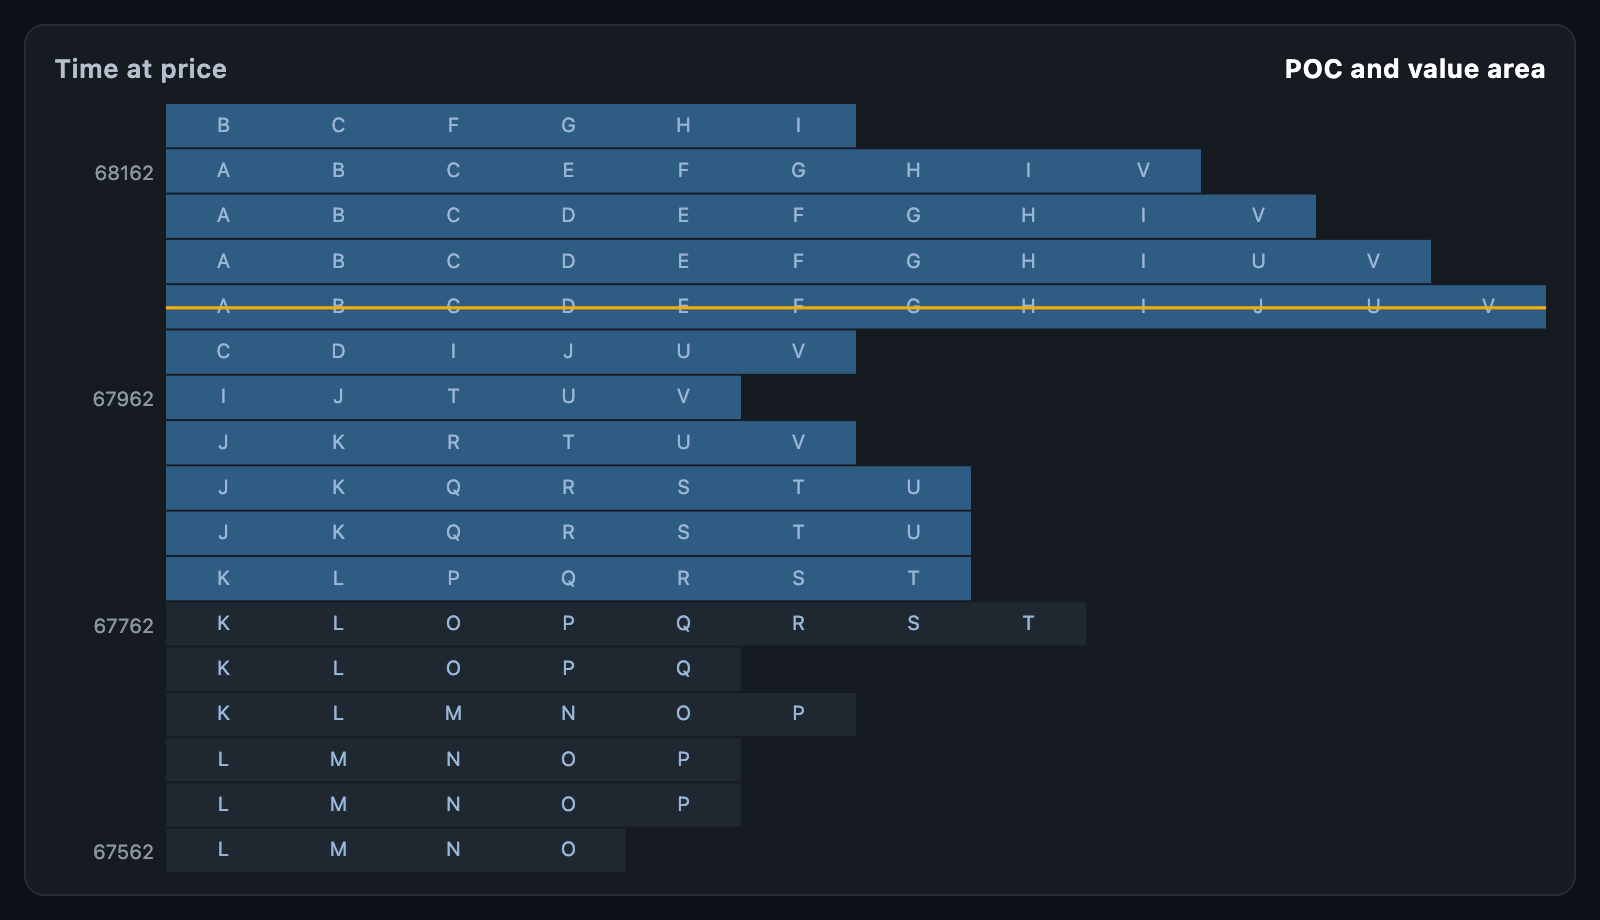
MarketProfileChart shows how long the market spent at each price. Each candle
is one period, and every price level its range covered is credited to it — so
the profile counts time at price, where a volume profile counts
size. The busiest level is the point of control, and the range around it
holding most of the session is the value area.
MarketProfileChart(
  profile: buildMarketProfile(candles, rowCount: 40),
);
The chart fills its constraints. When the height is unbounded, it uses
defaultHeight.
buildMarketProfile(candles, …) takes the same KLineEntity list the
candlestick chart takes:
| Parameter | Description |
|---|---|
tickSize |
How tall one price level is |
rowCount |
Split the range into this many levels instead |
valueAreaFraction |
How much of the session the value area holds (default 0.7) |
The value area grows out from the point of control, always taking whichever neighbouring level is busier, until it holds that fraction of every period counted.
The resulting MarketProfile carries:
| Field | Description |
|---|---|
rows |
The levels, lowest first; each with from, to, price, periods and count |
tickSize |
How tall one level came out |
pointOfControl |
The price of the busiest level |
valueAreaLow, valueAreaHigh |
The ends of the value area |
periodCount, busiest |
How many candles went in, and the fullest level |
inValueArea(price) |
Whether a price is inside the value area |
A profile can also be built by hand from MarketProfileRows — for a session
split by half-hour rather than by candle, say.
| Parameter | Description |
|---|---|
blockWidth |
How wide one period's block is; null fits the busiest row to the width |
rowSpacing |
The gap between two rows |
showPriceAxis, axisWidth |
Prices down the left |
priceLabelEvery |
One price is written every this many rows |
padding |
Space around the chart |
layOutMarketProfile(profile, bounds, …) returns the MarketProfileBar list the
chart paints, and marketProfileBarAt hit-tests it. Both are public, so a
layout can be computed and tested without a widget.
| Parameter | Description |
|---|---|
blockColor, valueAreaColor |
Blocks outside and inside the value area |
pointOfControlColor |
The line at the busiest level |
showLetters, letters |
Writes each period as a letter (A, B, C …) when there is room; false draws plain blocks |
letterStyle, axisLabelStyle |
Text styles |
priceFormatter |
Price label text |
hoverColor, backgroundColor |
Row highlight and background |
Letters are dropped automatically when the blocks are too small to hold them, so the same chart stays readable at any size.
A touch anywhere in a row selects it. onTouch reports a
MarketProfileTouchDetails with the bar and its row, and null when the
pointer leaves.
MarketProfileChart(
  profile: profile,
  tooltipBuilder: (context, details) => Card(
    child: Padding(
      padding: const EdgeInsets.all(8),
      child: Text('${details.row.price}: ${details.row.count} TPOs'),
    ),
  ),
);animationDuration grows the rows out from the left; animationCurve eases it
and animateOnMount controls whether the first build animates. The chart
animates again whenever profile changes identity.