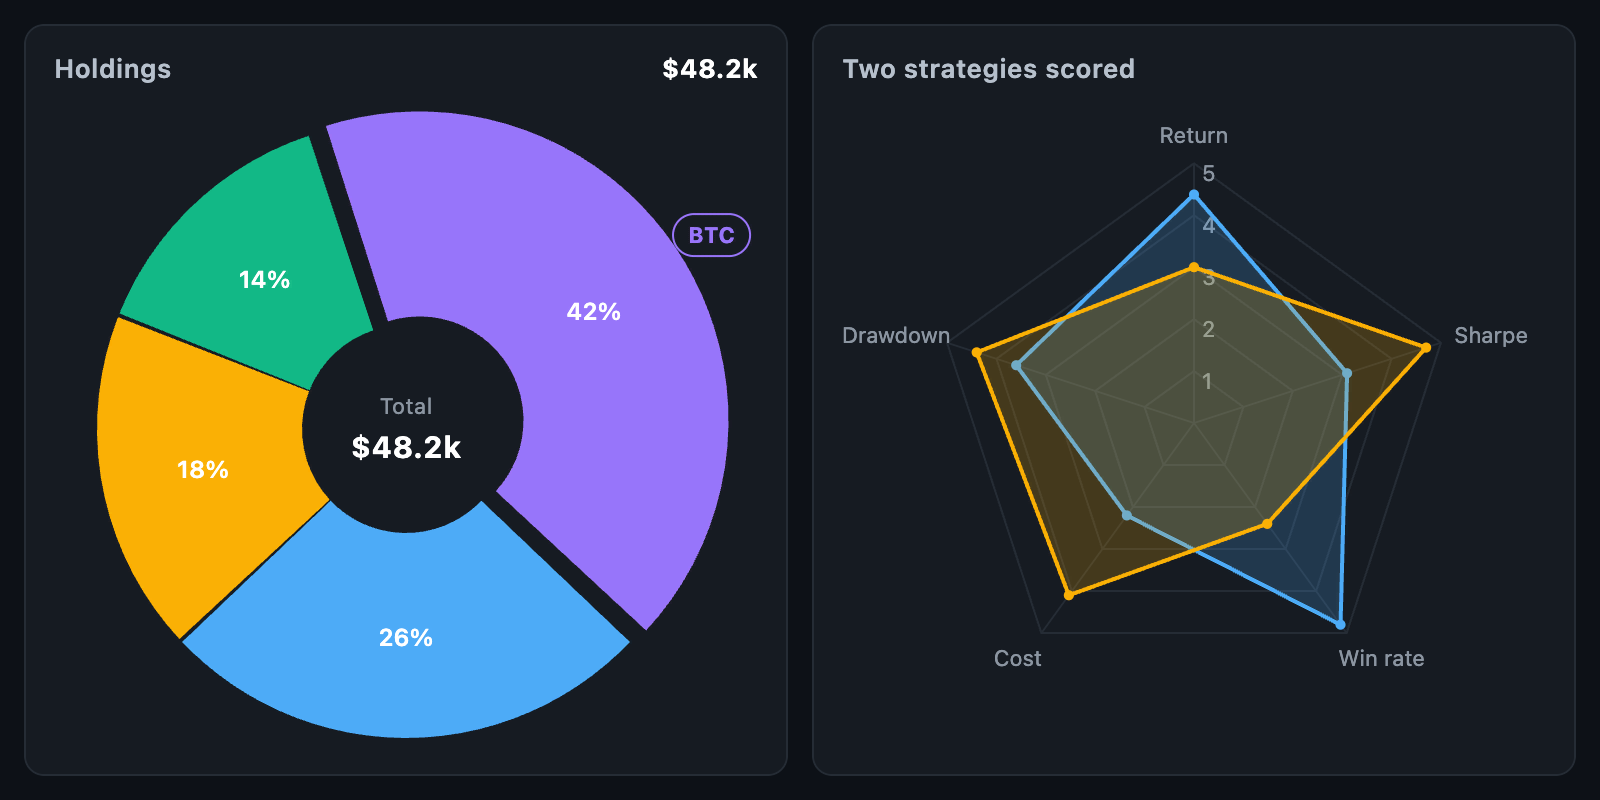
RadarChart compares multiple series across the same set of features, drawing
one outline per series on a shared grid. The doughnut chart in the screenshot is
covered in Pie chart.
RadarChart(
  features: const ['Speed', 'Power', 'Range', 'Cost', 'Weight'],
  series: [
    RadarSeries(values: const [4, 3, 5, 2, 4], color: blue, label: 'Now'),
    RadarSeries(values: const [3, 5, 2, 4, 3], color: amber, label: 'Target'),
  ],
  maxValue: 5,
);
The chart fills its constraints. When unconstrained, it is a square of
defaultSize.
A RadarSeries has one value per feature, in the same order as features.
Values outside the range are clamped to the edge, and null values are omitted
from the outline.
| Field | Description |
|---|---|
color |
Outline colour |
fillColor |
Fill colour; defaults to a translucent color |
width, dashPattern |
Outline width and dash pattern; width: 0 hides the outline |
dot |
Dot drawn at each vertex |
label |
Series name, for use in a custom legend |
| Field | Description |
|---|---|
features |
Feature names; an empty list hides labels |
minValue, maxValue |
Values at the centre and outer ring; maxValue: null uses the largest value |
tickCount |
Number of rings |
shape |
RadarShape.polygon or RadarShape.circle |
startDegreeOffset |
Position of the first feature, clockwise from 12 o'clock |
gridColor, gridWidth |
Ring style |
spokeColor, spokeWidth |
Spoke style |
showTicks, tickStyle |
Ring value labels, drawn along the first spoke |
featureStyle, featureGap |
Feature label style and spacing |
radius |
Grid radius; null fits the available space, leaving room for labels |
onTouch reports the nearest vertex within touchThreshold pixels — series,
feature and value — and null when the touch ends.
RadarChart(
  series: series,
  onTouch: (details) => setState(() => hovered = details?.featureIndex),
);radarCorner and RadarLayout are public, so you can position widgets such as
badges or legend chips at a specific vertex:
const layout = RadarLayout(
  centre: Offset(120, 120),
  radius: 100,
  count: 5,
  minValue: 0,
  maxValue: 10,
  startAngle: -math.pi / 2,
);
final at = layout.cornerFor(2, 7); // where the third feature's 7 is drawnWhen animationDuration is set, outlines animate outwards from the centre.