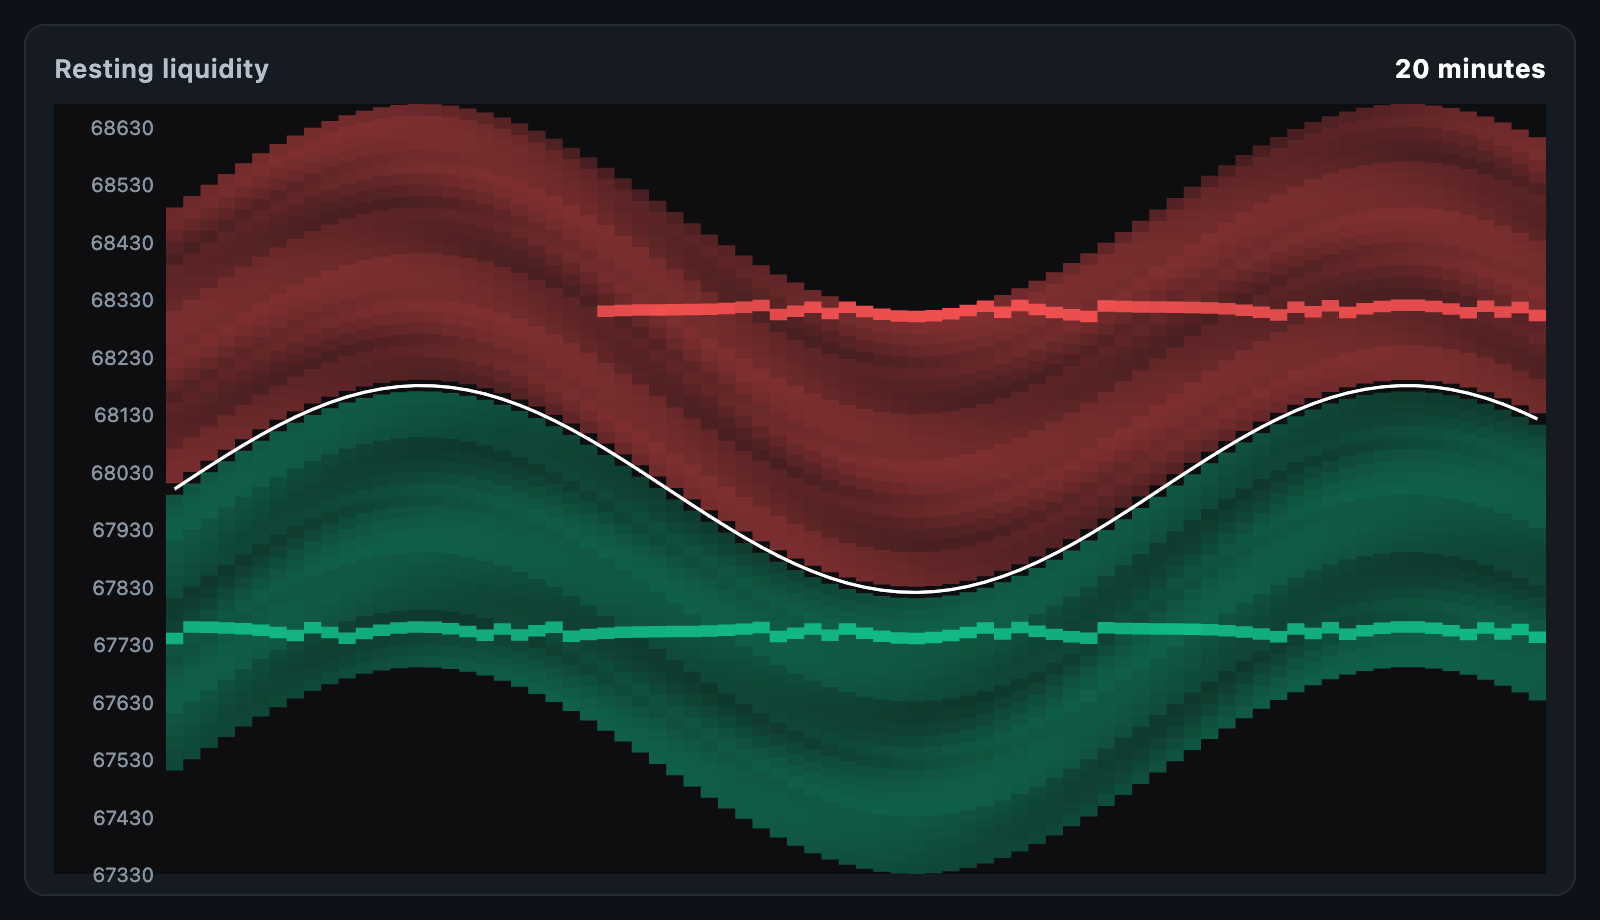
BookHeatmapChart draws resting liquidity over time. Every column is one
snapshot of the order book, every row is a price, and the brighter a cell the
more was resting there — so walls show up as bright lines running across time,
and pulled orders as lines that stop.
BookHeatmapChart(
  snapshots: snapshots,
  tickSize: 0.5,
);
The chart fills its constraints. When the height is unbounded, it uses
defaultHeight.
BookLevel field |
Description |
|---|---|
price |
Where the orders rest |
size |
How much rests there |
side |
BookSide.bid or BookSide.ask |
data |
Arbitrary app data, returned on touch |
BookSnapshot field |
Description |
|---|---|
time |
When the book looked like this |
levels |
What was resting, either side |
mid |
Where the market was; joined across columns as a line |
data |
Arbitrary app data |
Only the levels you pass are drawn, so thinning a deep book before charting it — keeping the top 200 levels a side, say — is both allowed and sensible.
| Parameter | Description |
|---|---|
tickSize |
How far apart two price levels are; a level lands in the same row in every column |
minPrice, maxPrice |
The prices drawn; null reads them off the snapshots |
largestSize |
What the brightest cell is worth; null takes the largest level seen |
showPriceAxis, axisWidth, priceLabelEvery |
Prices down the left |
padding |
Space around the chart |
bookPriceRange(snapshots) returns the prices they cover,
layOutBookHeatmap(snapshots, bounds, tickSize: …) returns the
BookHeatmapLayout the chart paints (with yOf and priceAt), and
bookHeatmapCellAt hit-tests it.
Passing a fixed largestSize keeps the brightness steady while snapshots stream
in; leaving it null re-scales to whatever is on screen.
| Parameter | Description |
|---|---|
bidColor, askColor |
The two sides |
minOpacity, maxOpacity |
How visible the quietest and loudest levels are |
gamma |
How sizes spread over that range; below 1 lifts the quiet levels, which is what keeps a book with one huge wall readable (default 0.5) |
showMid, midColor, midWidth |
The mid price line |
crosshairColor |
The crosshair under the pointer |
priceFormatter, axisLabelStyle |
Price labels |
backgroundColor |
Dark by default — the bright levels need a dark ground |
onTouch reports a BookHeatmapTouchDetails with the price under the
pointer, the column and its snapshot, and the cell when something rested
at that price (null when nothing did). Pointer events are read raw, so the
crosshair follows a drag at once.
BookHeatmapChart(
  snapshots: snapshots,
  tickSize: 0.5,
  tooltipBuilder: (context, details) => Card(
    child: Padding(
      padding: const EdgeInsets.all(8),
      child: Text(details.cell == null
          ? '${details.price}'
          : '${details.price}: ${details.cell!.level.size}'),
    ),
  ),
);DepthChart shows the book as it is now; this chart shows
how it got there. The two read well stacked, sharing a price axis — the depth
curve on the right of a heatmap that scrolls.