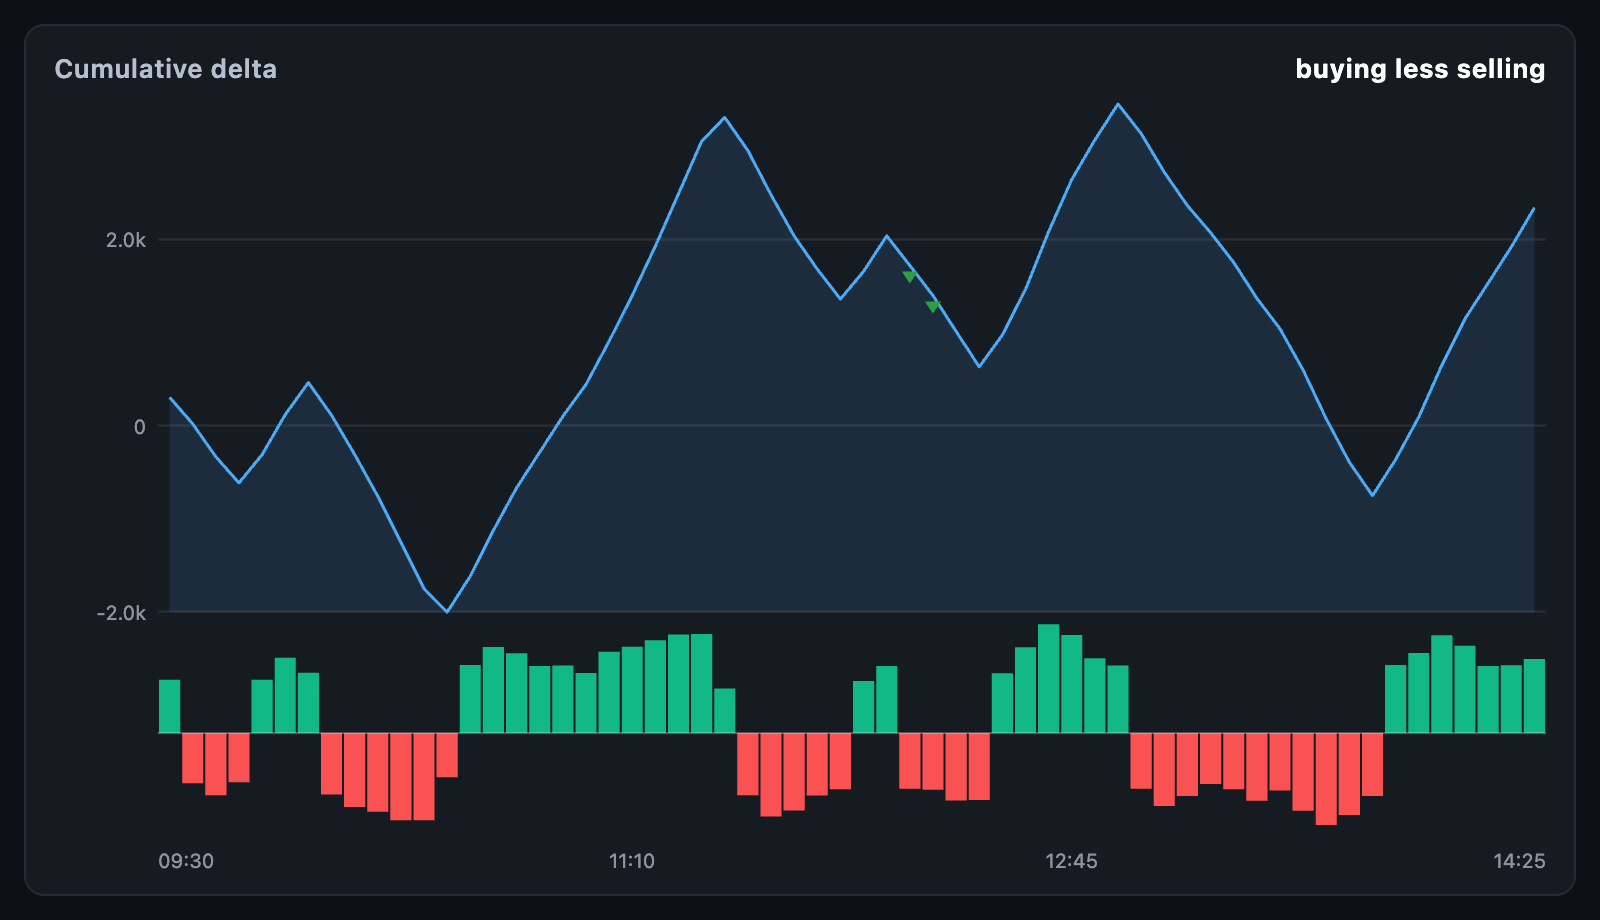
CumulativeDeltaChart draws buying less selling as a running total, with each
bar's own delta in a panel beneath it, and marks the bars where price and delta
disagreed.
CumulativeDeltaChart(
  bars: deltaBarsFromFootprint(footprintBars),
);
It is the companion to the footprint chart:
deltaBarsFromFootprint(bars) takes each footprint bar's delta and close, so
the same data drives both.
The chart fills its constraints. When the height is unbounded, it uses
defaultHeight.
DeltaBar field |
Description |
|---|---|
time |
When the bar began |
delta |
Buying less selling in that bar |
price |
The close, used to read divergences; null leaves them out |
data |
Arbitrary app data, returned on touch |
cumulativeDelta(bars) returns the running total. A delta that is not finite is
skipped rather than poisoning everything after it.
deltaDivergences(bars, lookback: 10) returns the bars where price made an
extreme the cumulative delta did not follow:
- bearish — price is the highest of the window, the running total is not: the move up was not bought.
- bullish — price is the lowest of the window, the running total is not: the move down was not sold.
Bars without a price are skipped, as are the first lookback bars, which have
no window behind them. The chart marks each one with a small triangle pointing
the way it warns; showDivergences: false turns them off, and
divergenceLookback sets the window.
| Parameter | Description |
|---|---|
histogramFraction |
How much of the height the per-bar panel takes (default 0.3) |
panelGap |
The gap between the two panels |
barSpacing |
Pixels taken off each side of a delta column |
min, max |
Ends of the running total's axis; null reads them off the bars, always including zero |
axisWidth, timeAxisHeight, showValueAxis, showTimeAxis |
The axes |
padding |
Space around the chart |
layOutCumulativeDelta(bars, bounds, …) returns the CumulativeDeltaLayout the
chart paints — the two panel rects, the line points, the per-bar column rects,
the totals and largestDelta — and layout.indexAt(dx) finds the bar nearest a
position.
| Parameter | Description |
|---|---|
lineColor, lineWidth, fillOpacity |
The running total and its shading |
buyColor, sellColor |
Columns above and below zero |
bearishDivergenceColor, bullishDivergenceColor |
The divergence marks |
gridColor, crosshairColor |
Grid and crosshair |
valueFormatter, timeFormatter, axisLabelStyle |
Axis label text |
tickCount, backgroundColor |
Ticks and background |
Pointer events are read raw, so the crosshair follows a drag at once. onTouch
reports a CumulativeDeltaTouchDetails with the bar's index, the bar
itself, the running total there and where it sits, and null when the pointer
leaves.
CumulativeDeltaChart(
  bars: bars,
  tooltipBuilder: (context, details) => Card(
    child: Padding(
      padding: const EdgeInsets.all(8),
      child: Text('delta ${details.bar.delta}\n'
          'total ${details.total}'),
    ),
  ),
);animationDuration draws the line in from the left; animationCurve eases it
and animateOnMount controls whether the first build animates. The chart
animates again whenever bars changes identity.