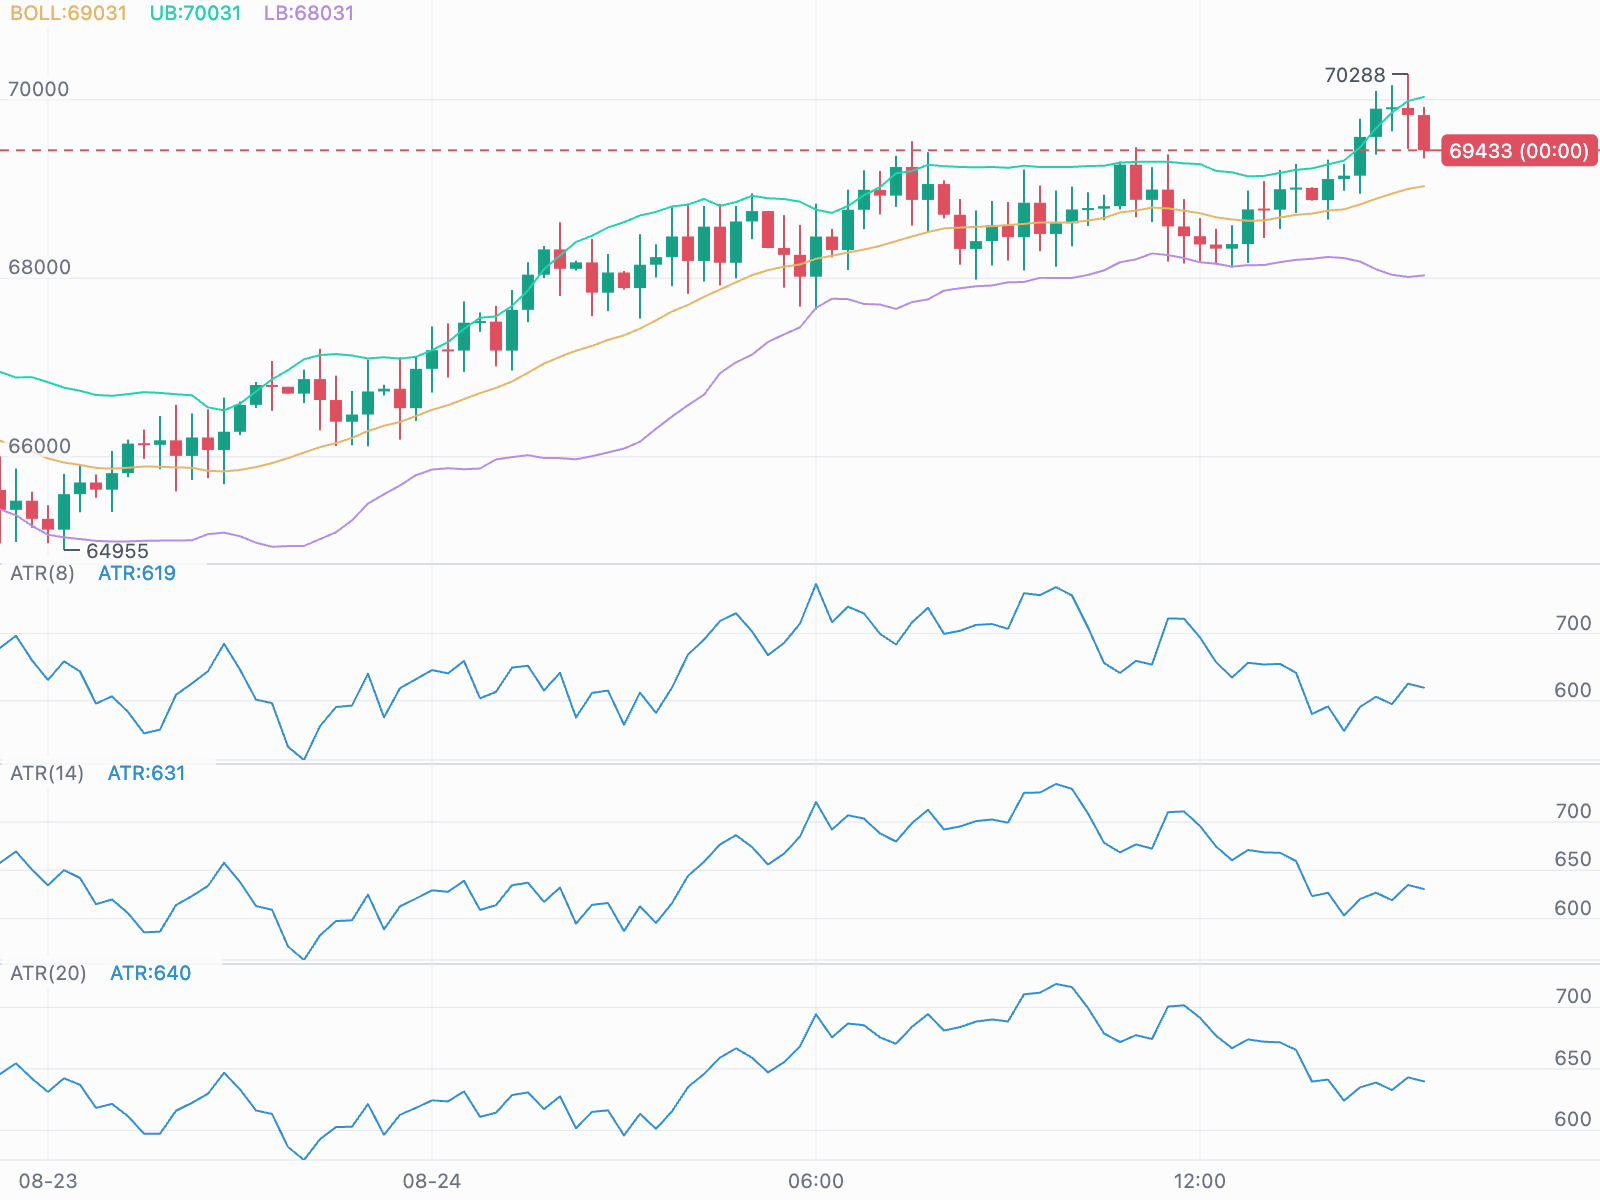
Indicator panes can be resized by dragging their lower edge and reordered by dragging their legend row:
KChartWidget(
  candles,
  ChartColors(),
  timeFrame: const Duration(minutes: 15),
  indicators: [MacdIndicator(), RsiIndicator()],
  resizablePanes: true,
  reorderablePanes: true,
  onReorderPane: (from, to) => setState(() {
    indicators.insert(to, indicators.removeAt(from));
  }),
);- Each pane has its own gridlines and labels at round values, so panes such as ATRs with different periods can be compared directly.
- Indicators with a fixed range (RSI, KDJ, WR) show their guide levels instead.
- MACD and Awesome Oscillator panes draw a zero line.
- The volume pane shows a round reference level.
Pane heights are managed by the chart, constrained between
ChartStyle.minPaneHeight and maxPaneHeight, and reset when the set of panes
changes.
Pane order is owned by your indicator list. The chart reports the move through
onReorderPane, and your code applies it.
ChartStyle.paneResizeTolerance and paneGrabHeight set the size of the
resize and reorder hit areas.