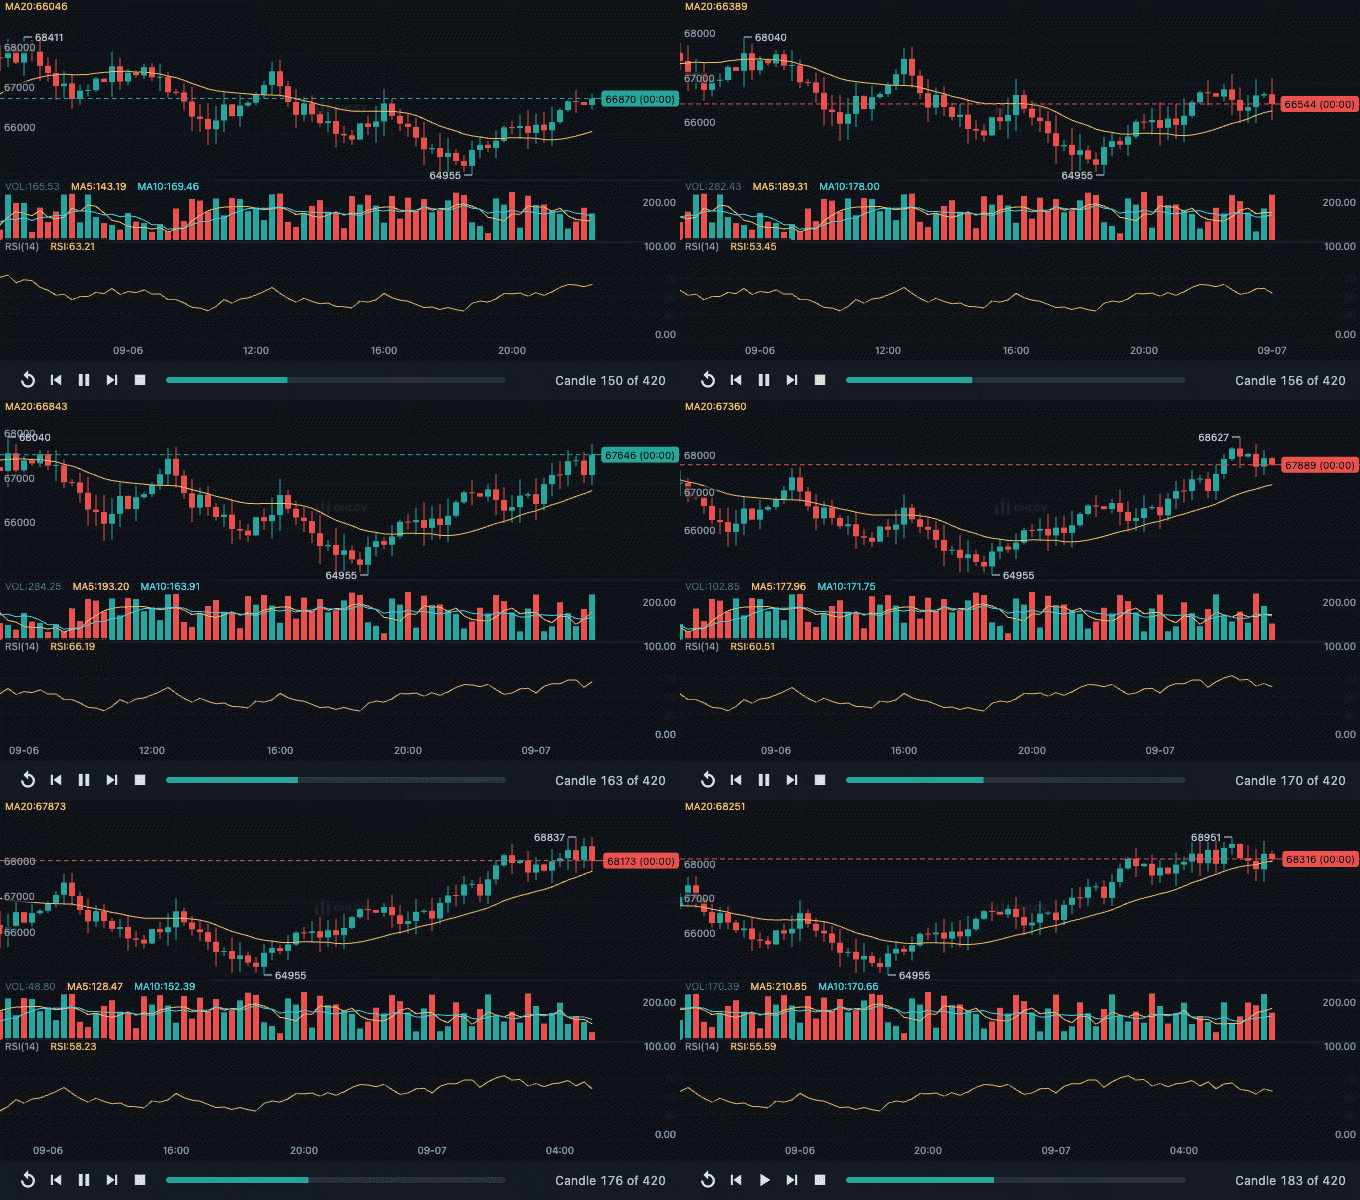
ChartReplayController replays historical data candle by candle. While a replay
is active, the chart shows only the candles up to the current position, and
indicators, the current-price line and the legend reflect only that data. This
lets you study a setup without seeing what happened next.
final replay = ChartReplayController(interval: const Duration(milliseconds: 300));

KChartWidget(
  candles,
  ChartColors(),
  timeFrame: const Duration(minutes: 15),
  replay: replay,
);

replay.start(at: 200);   // draw the oldest 200 candles and hold there
replay.stepForward();    // one more
replay.stepBack();       // one fewer
replay.play();           // or let them arrive on their own
replay.pause();
replay.stop(); // hand the whole series back- Calling
play()withoutstart()begins at the midpoint of the series. - Playback stops automatically at the newest candle.
isPlaying,isActive,position,lengthandisAtEndexpose state for building playback controls.- The controller is a
ChangeNotifier. Dispose it together with the widget that owns it.
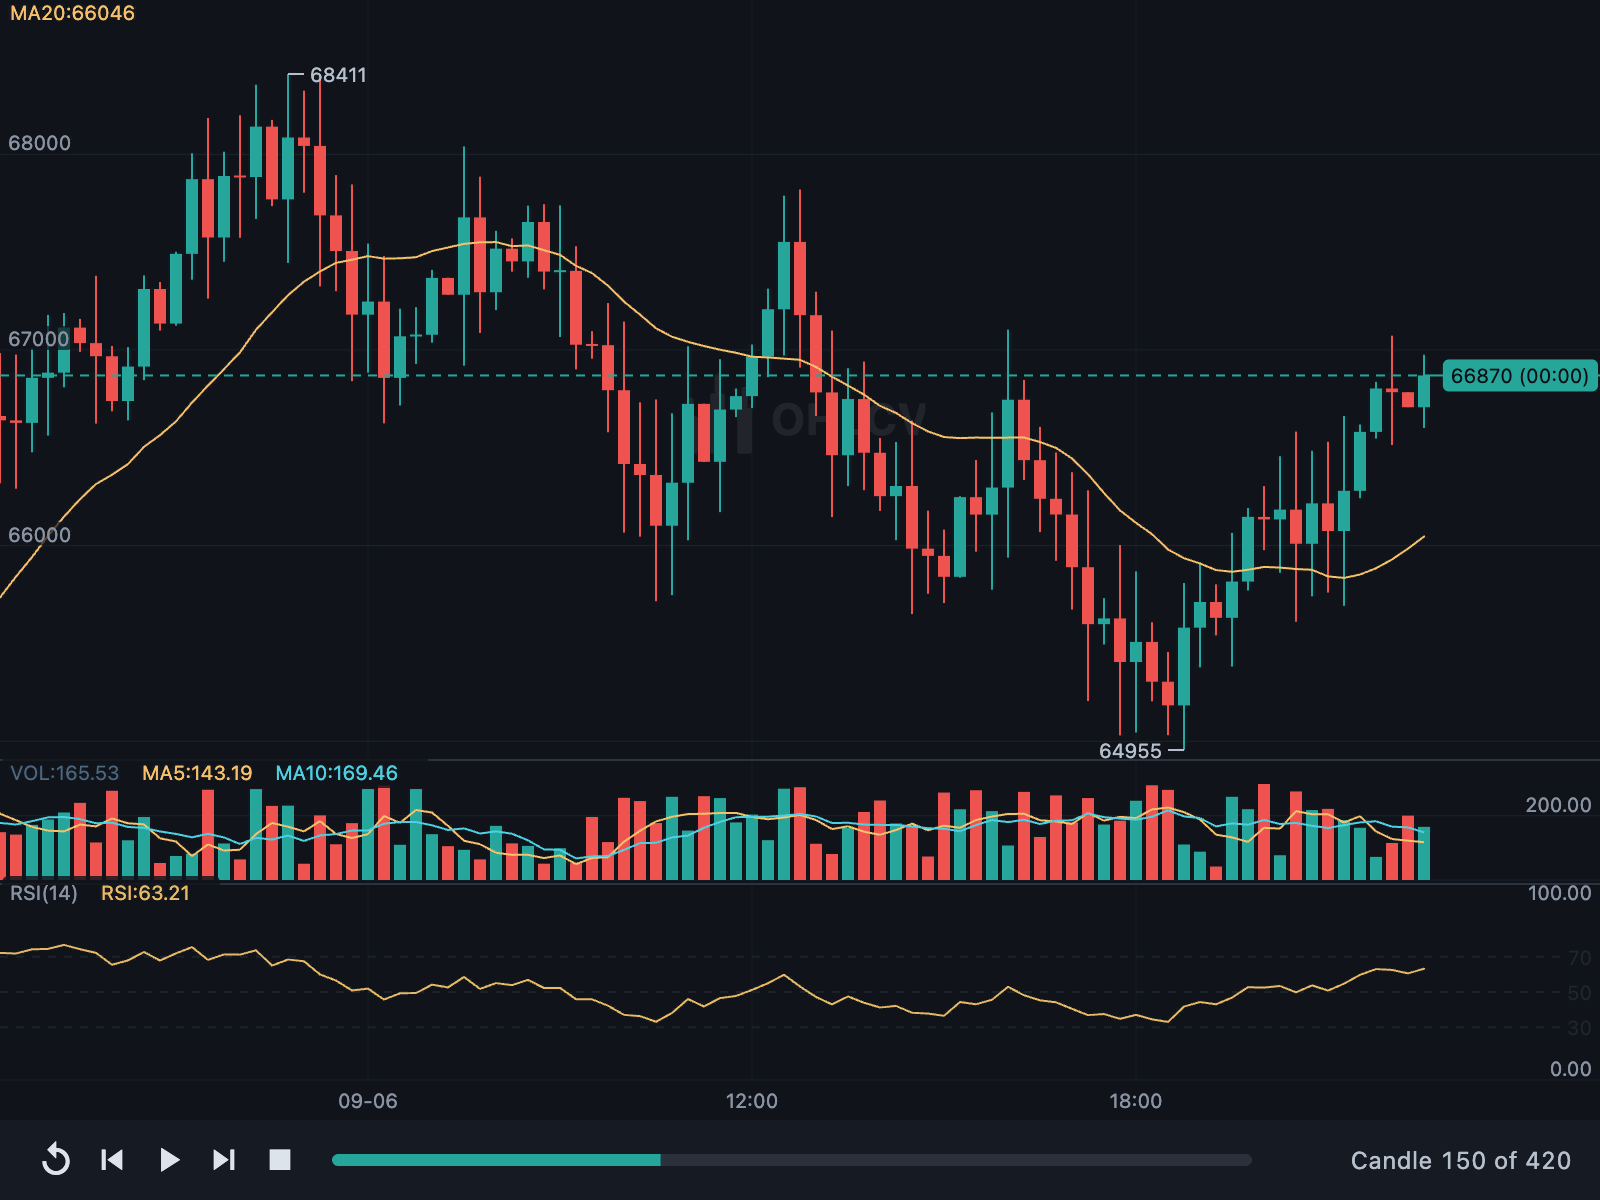
Replay does not modify your data: the candle list is unchanged, and drawings remain in place, including those on candles not yet revealed.