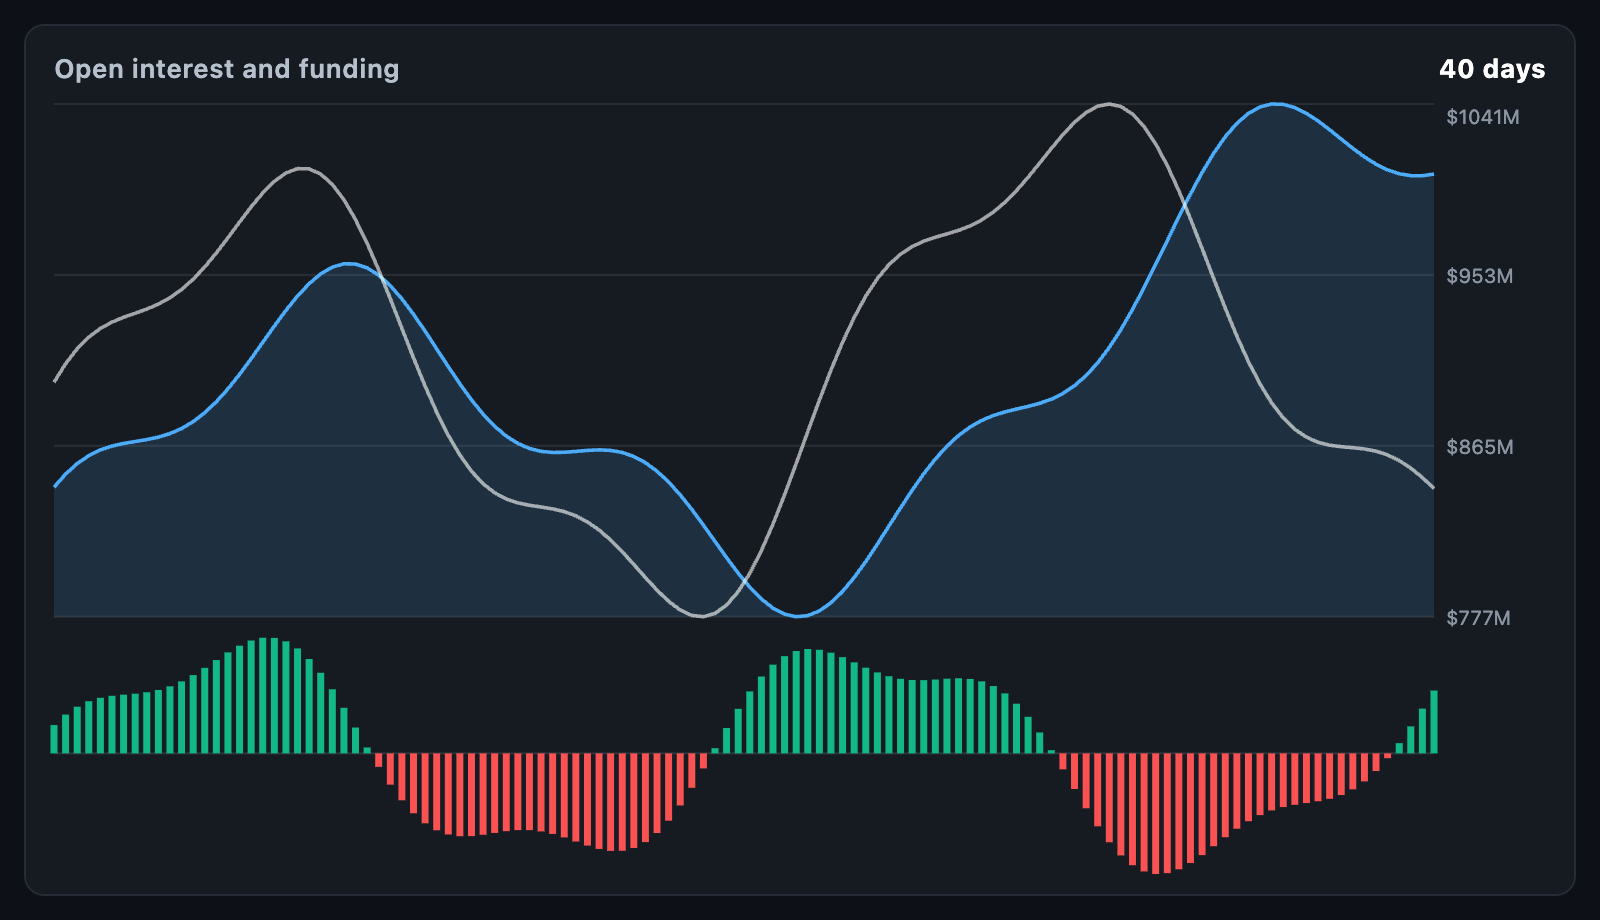
OpenInterestChart draws the pair every perpetual futures desk watches: open
interest over price in the upper panel, funding in the lower one. Open interest
says how much money is in the trade and funding says which side is paying to be
there; together with price they separate a rally that is new buying from one
that is shorts covering.
OpenInterestChart(
  points: [
    for (final reading in readings)
      OpenInterestPoint(
        time: reading.time,
        openInterest: reading.oi,
        funding: reading.funding,
        price: reading.close,
      ),
  ],
);
The chart fills its constraints. In a box with no height it takes
defaultHeight.
An OpenInterestPoint is a time, the openInterest then, and optionally the
funding rate as a fraction — 0.0001 is one basis point — and the price. A
non-finite open interest is a gap in the line; a null funding is a time with no
reading and gets no bar.
openInterestMoves(points) reads price and interest together at each step and
returns one of four cases:
| Price | Open interest | OpenInterestMove |
|---|---|---|
| Up | Up | newLongs — new money, long |
| Down | Down | longsClosing — longs closing out |
| Down | Up | newShorts — new money, short |
| Up | Down | shortsCovering — shorts buying back |
Anything else — a flat step, a missing price, the first reading — is
OpenInterestMove.flat. moveLabel(move) is what each is called.
Open interest is read for its swings, not its level, so the upper panel is scaled to the range the readings actually cover rather than down to zero. The price line over it has its own scale, since it is there to be compared in shape rather than in level.
Funding bars grow off a zero line in the lower panel, the way every exchange
draws them: positive funding — longs paying — rises above it, negative funding
hangs below. They are scaled to
the largest rate either way, which makes one chart's bars incomparable with
another's, so pass fundingMax to pin the scale. fundingShare is how much of
the height that panel takes.
layOutOpenInterest(points, size:, ...) is the layout on its own, without a
widget. It returns an OpenInterestLayout with the interestRect and
fundingRect, the columnX of each reading, the interestPoints,
pricePoints and fundingBars — each null where that reading has no value —
the two panels' scales, the fundingMax and the zeroY.
layout.indexAt(x) finds the nearest reading. progress reveals the readings
left to right, for a draw-in animation.
onTouch is called with a reading and what the pair did there, and with nulls
when the touch leaves. A line is drawn down both panels at that reading, and a
card shows its open interest, its funding in basis points and the move;
tooltipBuilder replaces the card.
| Field | Default |
|---|---|
interestColor, interestFillOpacity |
A blue line over a faint wash |
priceColor, showPrice |
A pale price line over the panel |
positiveFundingColor, negativeFundingColor |
Green below zero, red above |
fundingShare, panelGap, barWidth |
0.32, 8 and 0.6 |
showAxis, axisWidth, axisSteps, interestFormatter |
The right axis |
fundingFormatter |
Writes a rate; basis points by default |
crosshairColor, zeroLineColor, gridColor |
The lines |
animationDuration, animationCurve, animateOnMount |
The draw-in |
semanticLabel is what a screen reader announces for the chart.
- Liquidity map — where that leveraged money gets out
- Cumulative delta — which side is doing the buying