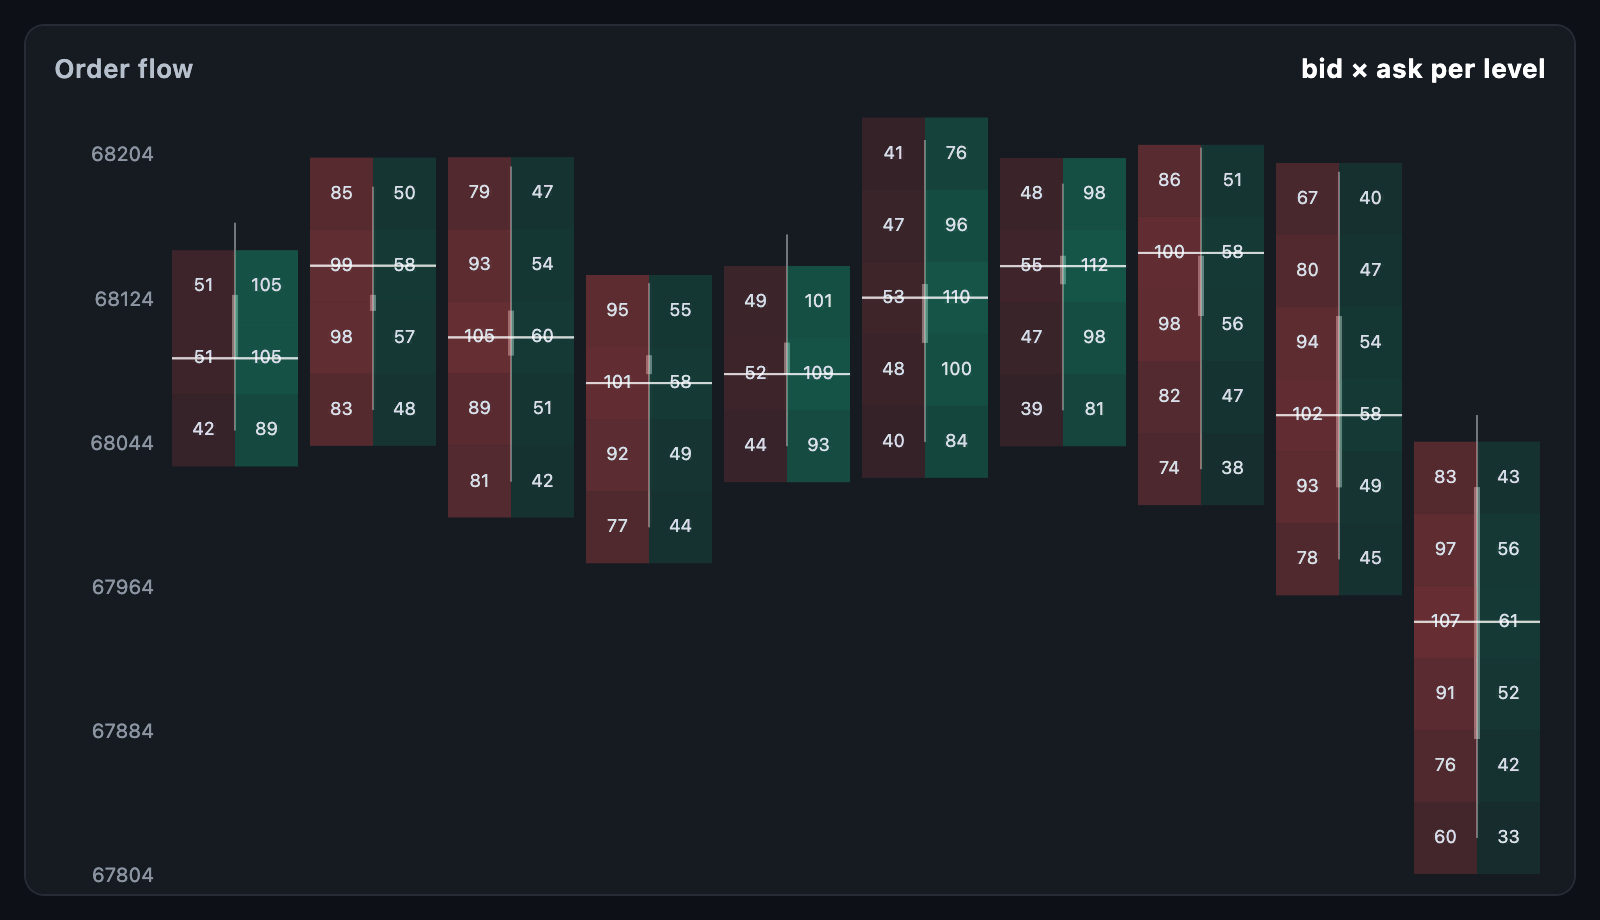
FootprintChart shows what traded at every price inside every bar. Each bar is
a column of price levels, each level split into what was sold into the bid and
what was bought from the offer, shaded by how much traded and outlined where the
flow was one-sided.
FootprintChart(
  bars: bars,
  tickSize: 0.5,
);
The chart fills its constraints. When the height is unbounded, it uses
defaultHeight.
FootprintLevel field |
Description |
|---|---|
price |
The price that traded |
bidVolume |
Sold into the bid |
askVolume |
Bought from the offer |
data |
Arbitrary app data, returned on touch |
Derived: total, delta (ask less bid) and imbalance (from -1, all
selling, to 1, all buying).
FootprintBar field |
Description |
|---|---|
time |
When the bar began |
levels |
What traded inside it |
open, close |
Draw a thin candle behind the column; omit both for none |
high, low |
The candle's wick; null takes the outermost levels |
Derived: volume, delta, pointOfControl (the busiest price), top and
bottom.
footprintCumulativeDelta(bars) returns the running total of the bars' deltas —
the cumulative delta a lot of order-flow work is read against.
footprintPriceRange(bars) returns the prices they cover.
| Parameter | Description |
|---|---|
tickSize |
How far apart two price levels are; a row is one tick tall, so cells line up across bars |
minPrice, maxPrice |
The prices drawn; null reads them off the bars |
barSpacing |
The gap between two columns |
showPriceAxis, axisWidth, priceLabelEvery |
Prices down the left |
padding |
Space around the chart |
layOutFootprint(bars, bounds, tickSize: …) returns the FootprintLayout the
chart paints — the columns, their cells (each with a bidRect and an askRect),
the price range and the largestVolume shading is read against — and
footprintCellAt(layout, local) hit-tests it.
| Parameter | Description |
|---|---|
buyColor, sellColor |
The two halves of a cell |
cellOpacity |
How opaque the busiest cell is; quieter ones fade towards nothing |
imbalanceThreshold |
How one-sided a level must be before it is outlined (1 marks none) |
imbalanceColor |
That outline |
showNumbers, numberStyle, volumeFormatter |
The two volumes written in each cell |
markPointOfControl, pointOfControlColor |
Each bar's busiest price |
showCandles, candleColor, candleWidth |
The candle behind each column |
gridColor |
A line at each price level |
hoverBorder, backgroundColor |
Cell highlight and background |
Numbers are dropped automatically when the cells are too small to hold them, so the same chart is readable zoomed in and zoomed out.
onTouch reports a FootprintTouchDetails with the cell, its level and the
bar it belongs to, and null when the pointer leaves. Pointer events are read
raw, so the highlight follows a drag at once.
FootprintChart(
  bars: bars,
  tickSize: 0.5,
  tooltipBuilder: (context, details) => Card(
    child: Padding(
      padding: const EdgeInsets.all(8),
      child: Text('${details.level.price}\n'
          '${details.level.bidVolume} × ${details.level.askVolume}\n'
          'delta ${details.level.delta}'),
    ),
  ),
);The chart takes levels already aggregated, which keeps it independent of how trades are classified. A common way to build them:
final levels = <double, ({double bid, double ask})>{};
for (final trade in trades) {
  final price = (trade.price / tickSize).floor() * tickSize;
  final at = levels[price] ?? (bid: 0.0, ask: 0.0);
  levels[price] = trade.buyerIsMaker
      ? (bid: at.bid + trade.size, ask: at.ask)
      : (bid: at.bid, ask: at.ask + trade.size);
}
final bar = FootprintBar(
  time: barTime,
  open: open,
  close: close,
  levels: [
    for (final entry in levels.entries)
      FootprintLevel(
        price: entry.key,
        bidVolume: entry.value.bid,
        askVolume: entry.value.ask,
      ),
  ],
);