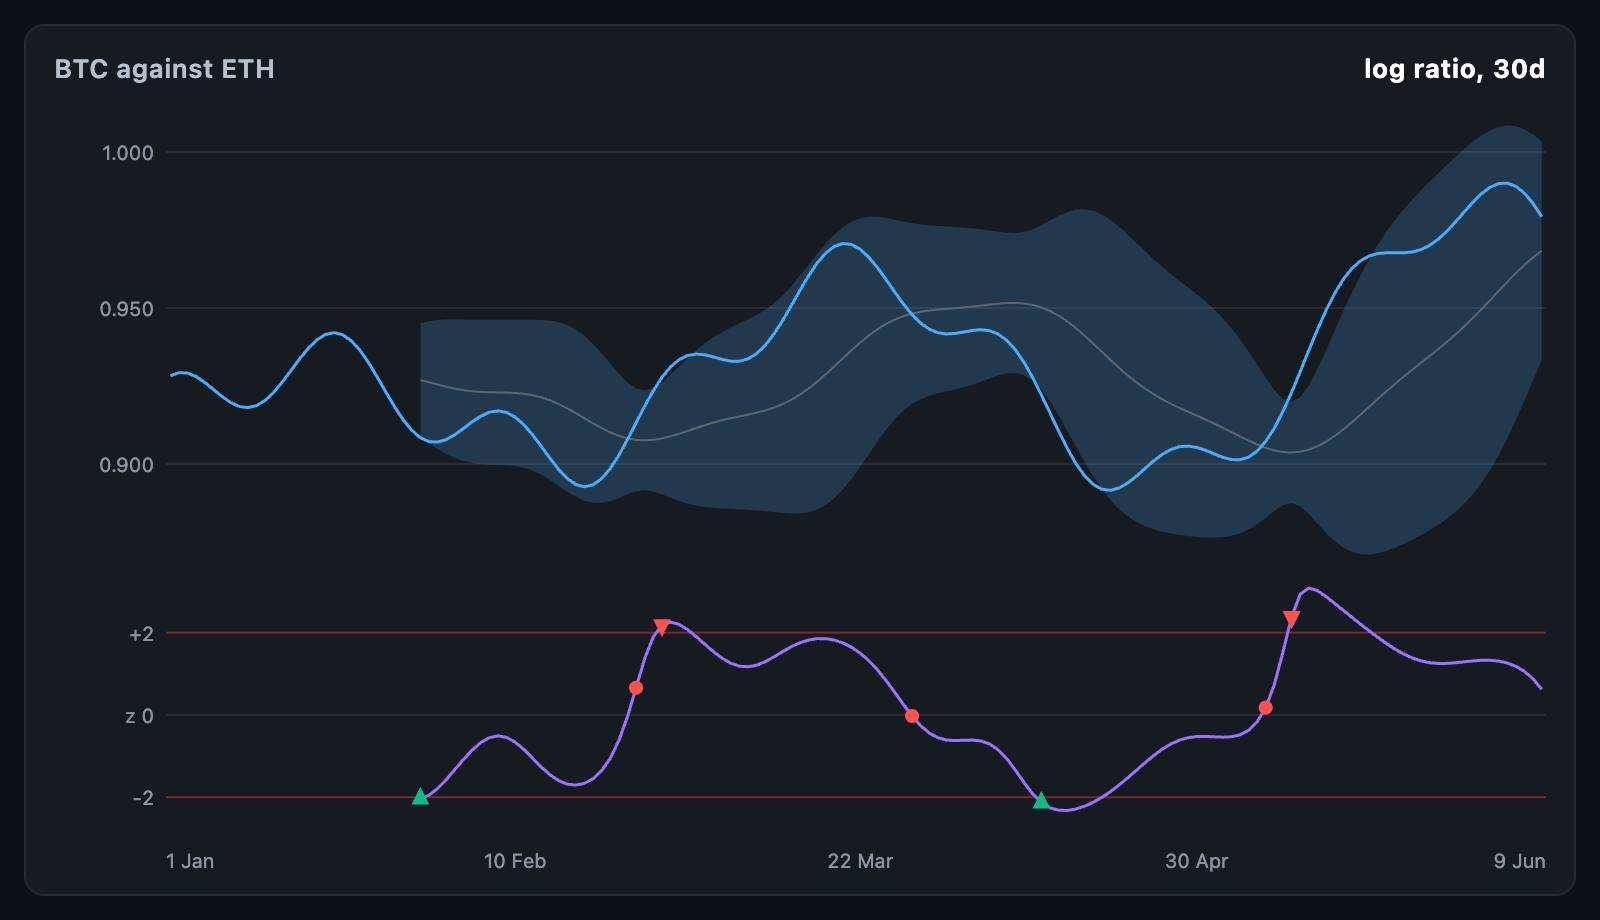
PairSpreadChart reads two instruments as one: their ratio or spread, with
bands round its rolling mean, and beneath it the z-score pair traders enter and
exit on — short the spread when it is stretched high, long when stretched low,
out when it comes back.
PairSpreadChart(
  points: alignPairSeries(btcCloses, ethCloses),
  mode: PairSpreadMode.logRatio,
  lookback: 30,
);
The chart fills its constraints. When the height is unbounded, it uses
defaultHeight.
points is a list of PairPoint(time:, a:, b:) in time order — both prices at
each time. a is the instrument bought when the spread is bought; b is the
hedge. To pair two separate series, alignPairSeries(a, b) takes lists of
(time:, value:) records and keeps only the times both have.
mode |
Series |
|---|---|
PairSpreadMode.ratio (default) |
a / b |
PairSpreadMode.logRatio |
ln(a / b), which treats a move either way alike |
PairSpreadMode.difference |
a − hedgeRatio × b |
hedgeRatio defaults to pairHedgeRatio(points), the least-squares slope of
a on b. A value that cannot be worked out — a ratio over zero — draws as a
gap. pairSpread(points, mode:, hedgeRatio:) returns the series.
Over the last lookback points, rollingMeanDeviation(values, lookback) gives
the mean and standard deviation at each point, and rollingZScore(values, lookback) how many deviations the spread sits from that mean. Both are null
until the window is full, and while it holds a gap. A window that does not move
scores zero.
Bands are drawn bandWidth deviations either side of the mean (default 2).
pairSignals(zScores, entry:, exit:) reads trades off the z-score, one at a
time, and returns a PairSignal per crossing — the index it happened at and
its PairSignalKind:
- enterShort — the z-score reaches
entry: sella, buyb. - enterLong — it reaches
-entry: buya, sellb. - exit — it comes back to
exiton the same side, or through it.
The chart marks entries with a triangle pointing the way the spread is traded
and exits with a dot, and rules lines at plus and minus entry.
showSignals: false turns the marks off.
| Parameter | Description |
|---|---|
zFraction |
How much of the height the z-score panel takes (default 0.35) |
panelGap |
The gap between the panels |
axisWidth, showValueAxis, timeAxisHeight, showTimeAxis, tickCount |
The axes |
padding |
Space around the chart |
layOutPairSpread(points, bounds, …) returns the PairSpreadLayout the chart
paints — both panel rects, the spread, bands and z-scores, the axis ranges,
xOf(index), spreadY(value), zY(z) and indexAt(dx). The z-score axis
reaches at least a quarter past entry.
| Parameter | Description |
|---|---|
spreadColor, lineWidth |
The spread; the width is shared with the z-score |
meanColor, bandColor |
The rolling mean and the area between the bands |
zColor, entryColor |
The z-score and its entry lines |
longColor, shortColor, exitColor |
The signal marks |
valueFormatter, timeFormatter, axisLabelStyle |
Axis text; values pick their decimals to suit the range |
gridColor, crosshairColor, backgroundColor |
Grid, crosshair and background |
Pointer events are read raw, so the crosshair follows a drag at once. onTouch
reports a PairSpreadTouchDetails with the index, the point, the spread,
the rolling mean, the zScore and where the spread sits, and null when the
pointer leaves.
PairSpreadChart(
  points: points,
  tooltipBuilder: (context, details) => Card(
    child: Padding(
      padding: const EdgeInsets.all(8),
      child: Text('ratio ${details.spread.toStringAsFixed(4)}\n'
          'z ${details.zScore?.toStringAsFixed(2) ?? '–'}'),
    ),
  ),
);animationDuration draws the lines in from the left; animationCurve eases
them and animateOnMount controls whether the first build animates. The chart
animates again whenever points changes identity.