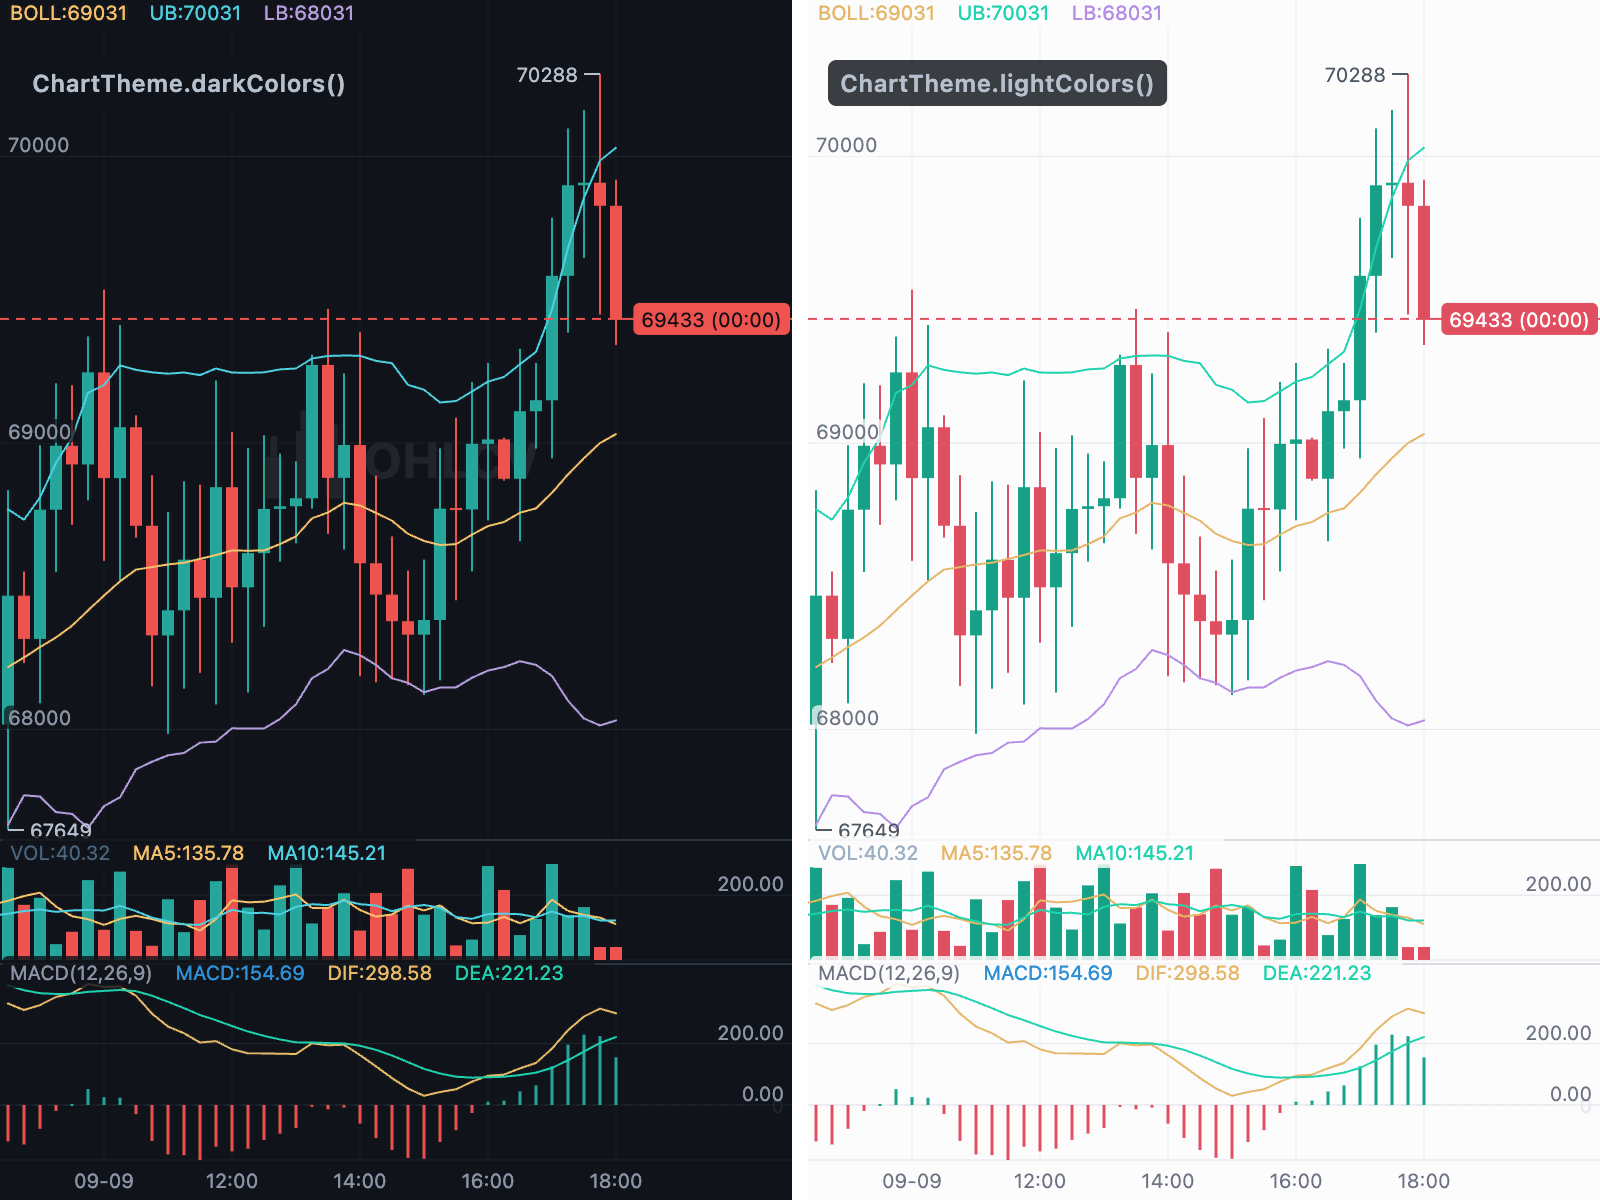
The chart's appearance is controlled by three objects:
| Class | Controls |
|---|---|
ChartColors |
All colours |
ChartStyle |
Layout and geometry |
ChartTranslations |
All text labels |
KChartWidget(
  candles,
  ChartColors(
    upColor: const Color(0xFF12B886),
    dnColor: const Color(0xFFFA5252),
    bgColor: const Color(0xFF0E1116),
  ),
  chartStyle: const ChartStyle(),
  chartTranslations: const ChartTranslations(),
  // …
);ChartTranslations contains every on-chart label (date, open, high,
low, close, changeAmount, change, amount, vol, jumpToNow), so you
can build one from your AppLocalizations. Its drawing field localises the
line editor, the drawing manager and drawing names:
ChartTranslations(
  date: l10n.date,
  drawing: DrawingTranslations(
    color: l10n.colour,
    delete: l10n.delete,
    fill: l10n.fill,
    alert: l10n.setAlert,
    drawings: l10n.drawings,
    trendLineName: l10n.trendLine,
  ),
);
DrawingTranslations.nameOf returns the display name for a drawing, so a
renamed drawing kind is consistent throughout the UI.
ChartColors.sessionDividerColorcolours session dividers.ChartColors.gridColumnColorcolours vertical gridlines. It defaults to a lighter shade ofgridColor, so horizontal price lines remain more prominent.ChartStyle.copyWithcreates variations of a base style:
final style = const ChartStyle().copyWith(showSessionDividers: true);The long-press readout sizes to its content between infoDialogWidth and
infoDialogMaxWidth, and never exceeds the chart width. Set
isTapShowInfoDialog to also open it on tap.
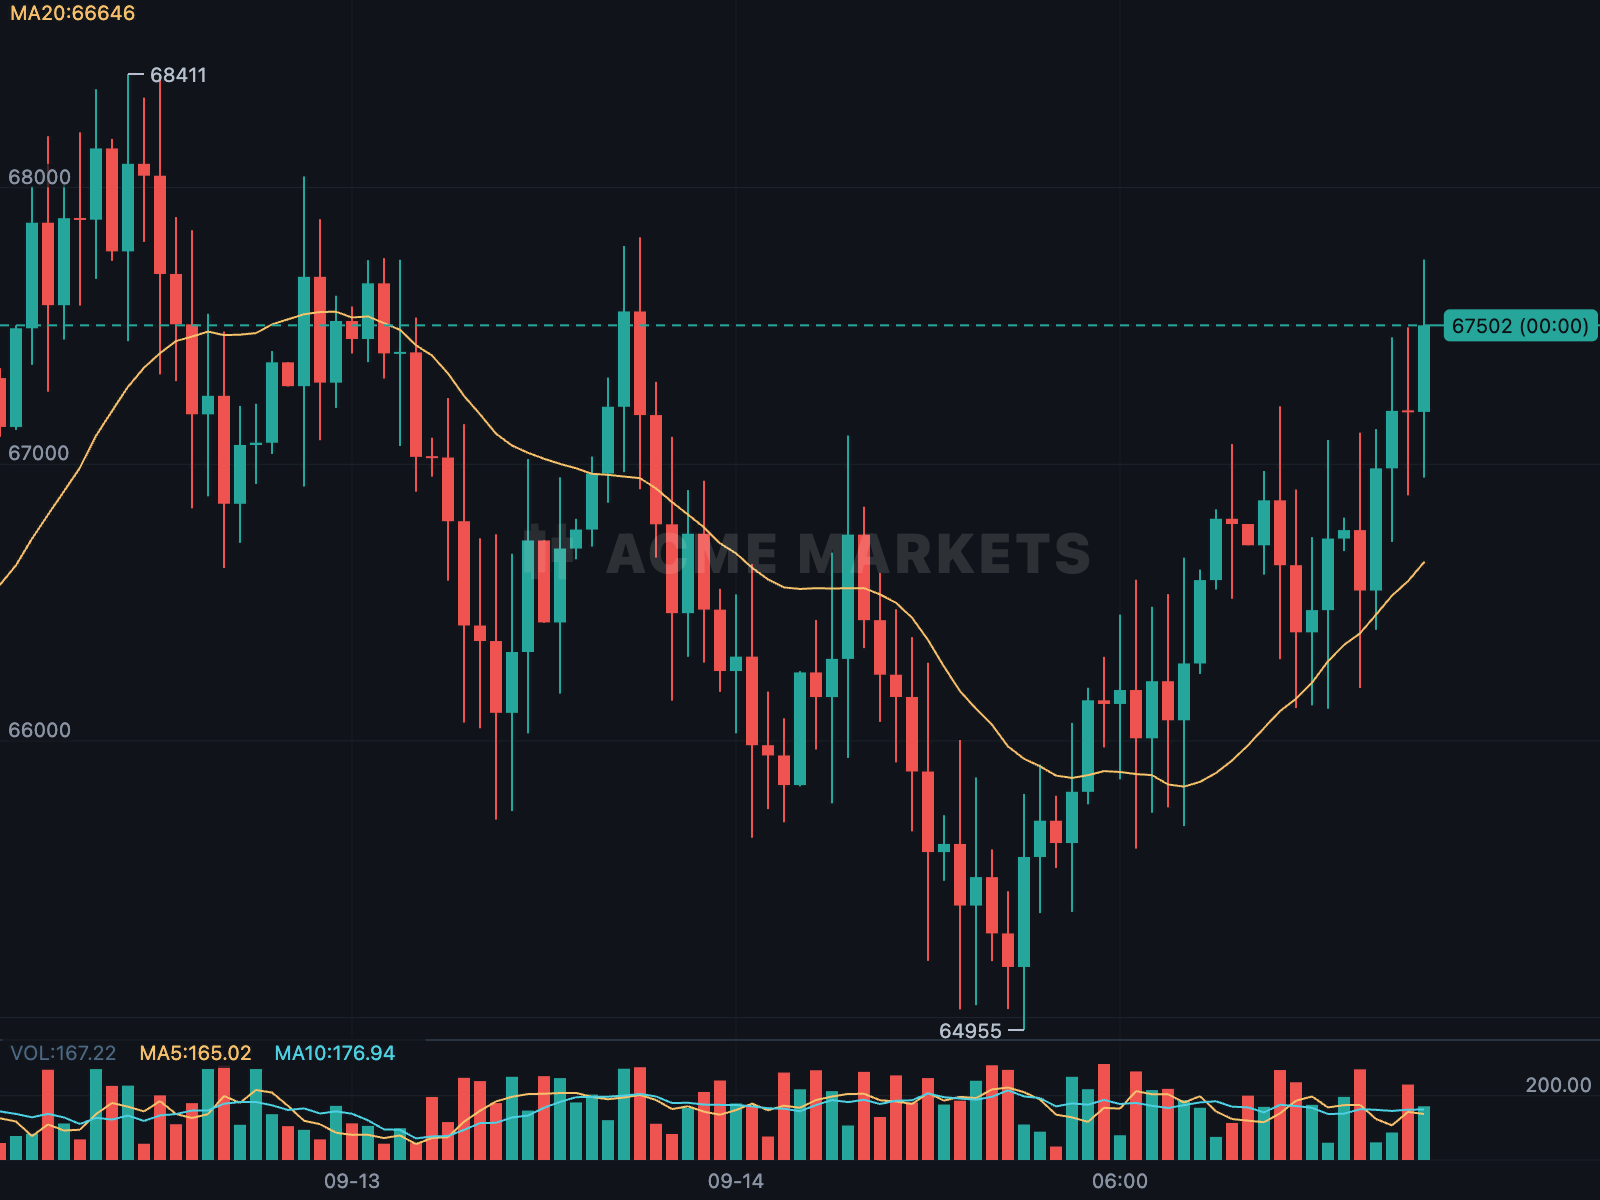
watermark accepts any widget — an Image.asset logo, an icon or text — and
renders it faintly over the candle area:
KChartWidget(
  candles,
  ChartColors(watermarkColor: Colors.white.withValues(alpha: .06)),
  watermark: Image.asset('assets/logo.png'),
  chartStyle: const ChartStyle(
    watermarkScale: .3,                       // width, as a share of the shorter side
    watermarkAlignment: Alignment.bottomRight,
  ),
);- The watermark is painted in a single colour,
ChartColors.watermarkColor(defaulting to a very faintdefaultTextColor), so full-colour logos render as a silhouette. - It ignores pointer events and does not affect chart interaction.
- The package has no SVG dependency. For an SVG watermark, pass
SvgPicture.assetfromflutter_svg.
SeriesChart does not use ChartColors or ChartStyle. Each series defines its
own colour, and axes, grid, tooltip and range selector accept styles directly,
so series charts can follow your app's theme. See
Series charts.