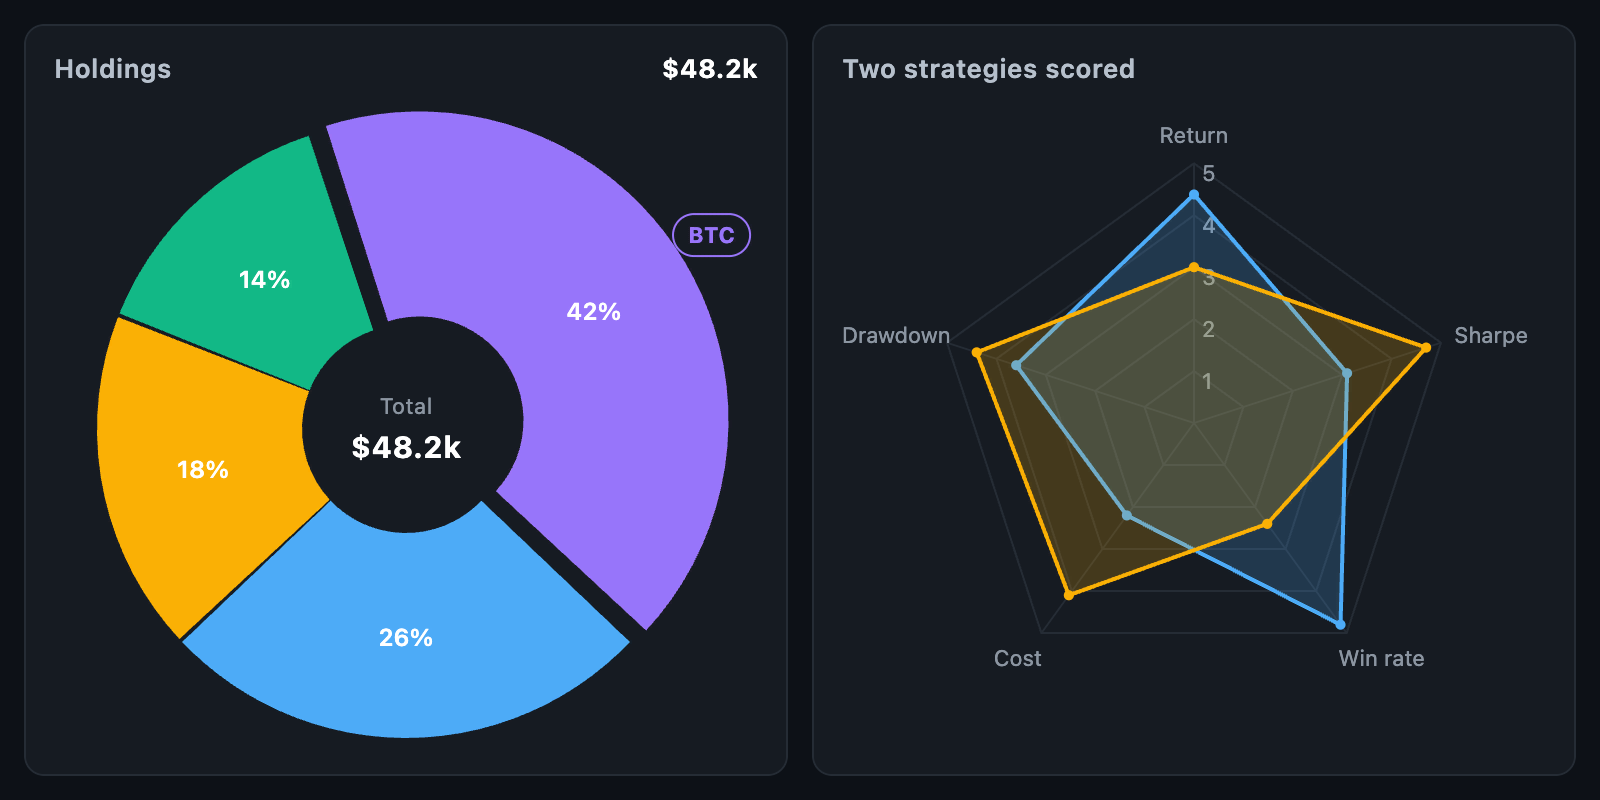
PieChart renders sections proportional to their share of the total. It
supports pie charts, doughnut charts (with an open centre) and single-section
ring gauges. The radar chart in the screenshot is covered in
Radar chart.
PieChart(
  sections: [
    PieSection(value: 40, color: blue, label: '40%'),
    PieSection(value: 35, color: green, label: '35%'),
    PieSection(value: 25, color: amber, label: '25%'),
  ],
  centerSpaceRadius: 40,
  centerChild: const Text('Total'),
);
The chart fills its constraints. When unconstrained, it is a square of
defaultSize.
value is a relative share, not an angle. Values are summed and each section
is sized proportionally, so [40, 35, 25] and [8, 7, 5] produce the same
chart. Sections with a value of zero are omitted; if all values are zero, nothing
is drawn.
| Field | Description |
|---|---|
color |
Fill colour |
gradient |
Fill gradient across the section; takes precedence over color |
label, labelStyle |
Section label and style |
labelPosition |
Label position from 0 (inner edge) to 1 (outer edge) |
radius |
Radius of this section, to make it stand out |
border |
Section outline |
offset |
Distance the section is pushed outwards (exploded slice) |
badge, badgePosition |
Widget attached to the section |
| Field | Description |
|---|---|
radius |
Outer radius; null fills the available space |
centerSpaceRadius |
Radius of the centre hole; 0 draws a full pie |
centerSpaceColor |
Fill colour of the centre hole |
centerChild |
Widget centred in the hole, such as a total or title |
sectionsSpace |
Gap between sections, in pixels at the outer edge |
startDegreeOffset |
Start angle of the first section, clockwise from 12 o'clock |
clockwise |
Direction of section order |
Touch or mouse hover identifies the section under the pointer. The active
section grows by touchedSectionGrowth (the radius is reduced to make room, so
nothing is clipped), and onTouch reports its index, or null when the touch
ends.
PieChart(
  sections: sections,
  onTouch: (details) => setState(() => selected = details?.index),
);The layout functions are public, so you can position widgets relative to a section:
final slices = layOutPie(
  sections: sections,
  radius: 80,
  innerRadius: 40,
);
final at = slices[1].pointAt(centre, 0.5); // the middle of the second section
pieSectionAt performs the reverse lookup: it returns the section containing a
point, or null for the centre hole and the area outside the chart.
When animationDuration is set, sections sweep in from the start angle.
Set animateOnMount: false to skip the animation on the first build.