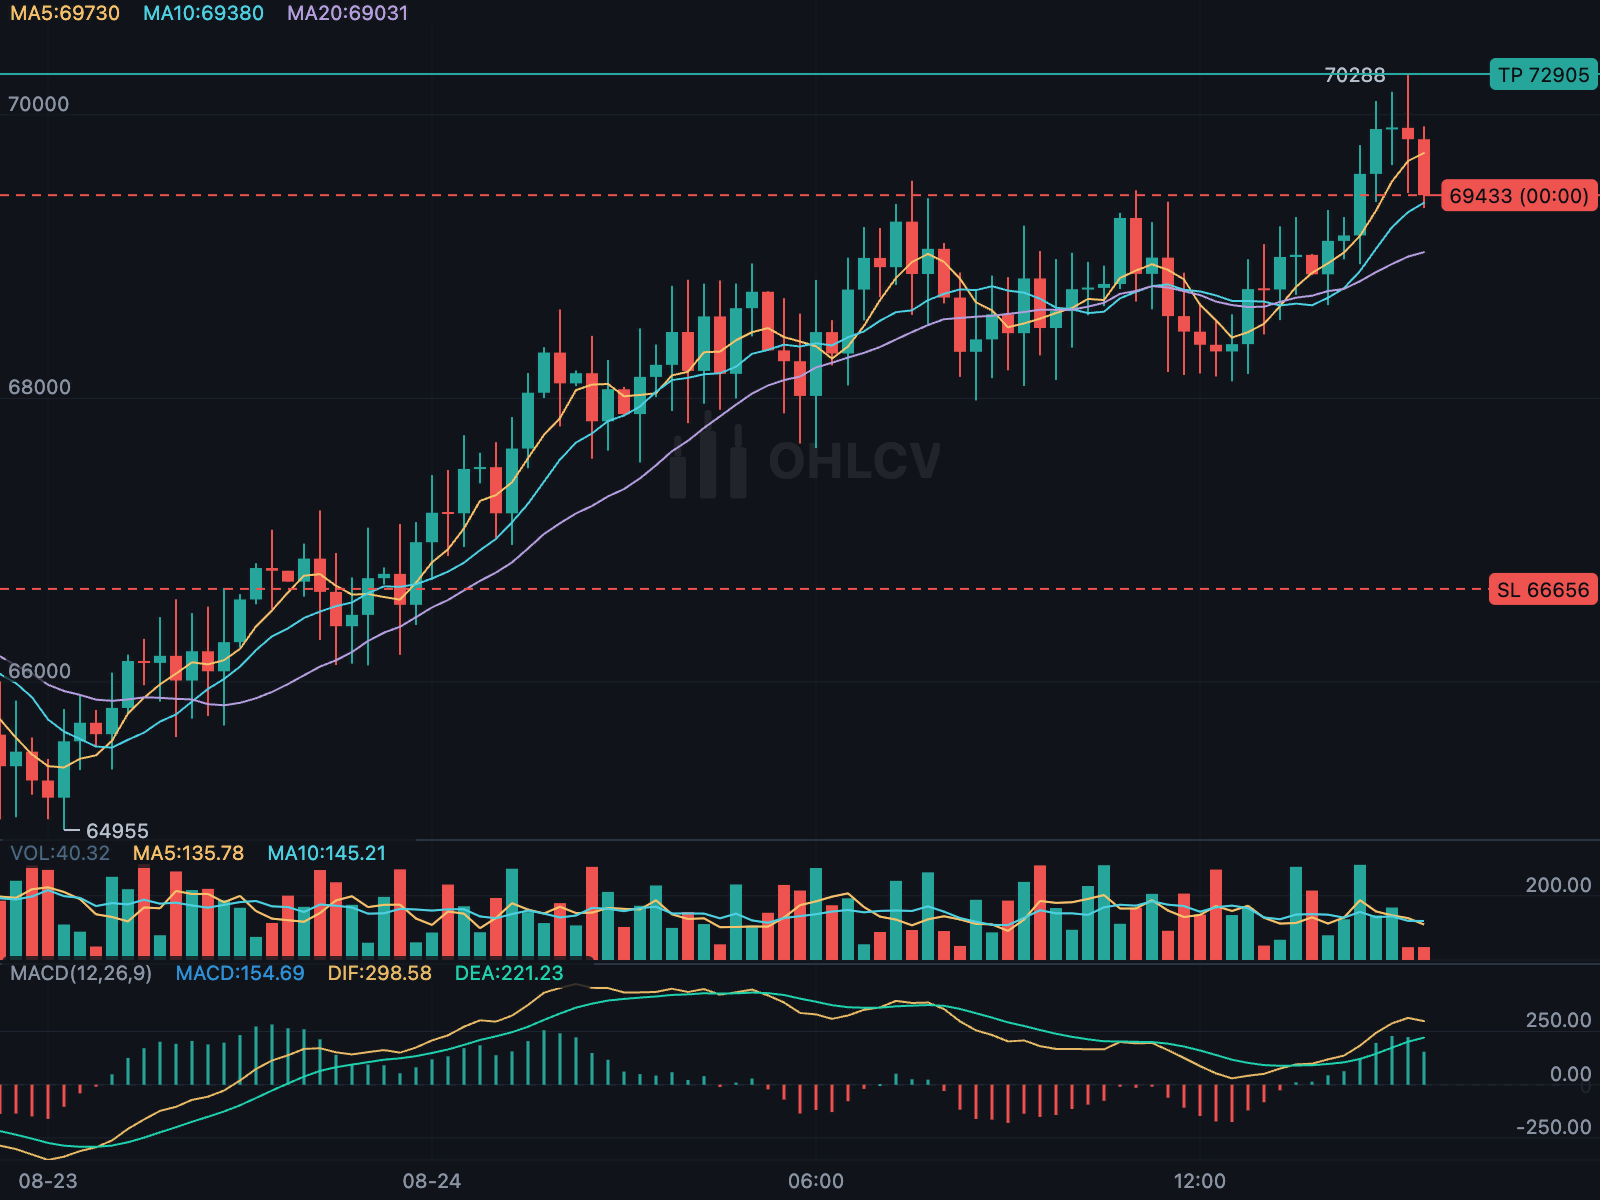
KChartWidget takes a List<KLineEntity>. Call DataUtil.calculate before the
first build, and again whenever new candles arrive, to compute indicator values
in place:
import 'package:ohlcv_chart/ohlcv_chart.dart';

DataUtil.calculate(candles);

KChartWidget(
  candles,
  ChartColors(),
  timeFrame: const Duration(minutes: 15),
  indicators: [MaIndicator(period: 20), BollIndicator(), MacdIndicator()],
  timeFormat: TimeFormat.YEAR_MONTH_DAY_WITH_HOUR,
  fixedLength: 2,
  onLoadMore: (isRight) {
    if (!isRight) fetchOlderCandles();
  },
);Only the candles and colours are required: KChartWidget(candles, ChartColors()) is a complete chart.
| Parameter | Purpose |
|---|---|
timeFrame |
Adds a countdown to candle close on the current-price tag |
isTrendLine |
Enables the drawing tools when true |
watermark |
Any widget, drawn faintly over the chart — see Theming |
KLineEntity.fromJson accepts the common OHLCV shape (open, high, low,
close, vol, time/id). You can also construct entities directly.
onLoadMore is called when scrolling reaches an edge: false at the oldest
candle and true at the newest. It fires once per arrival at an edge, not on
every frame.
To load older data, prepend the fetched candles and pass the longer list to the chart. The chart preserves its position in the data, so the view does not jump.