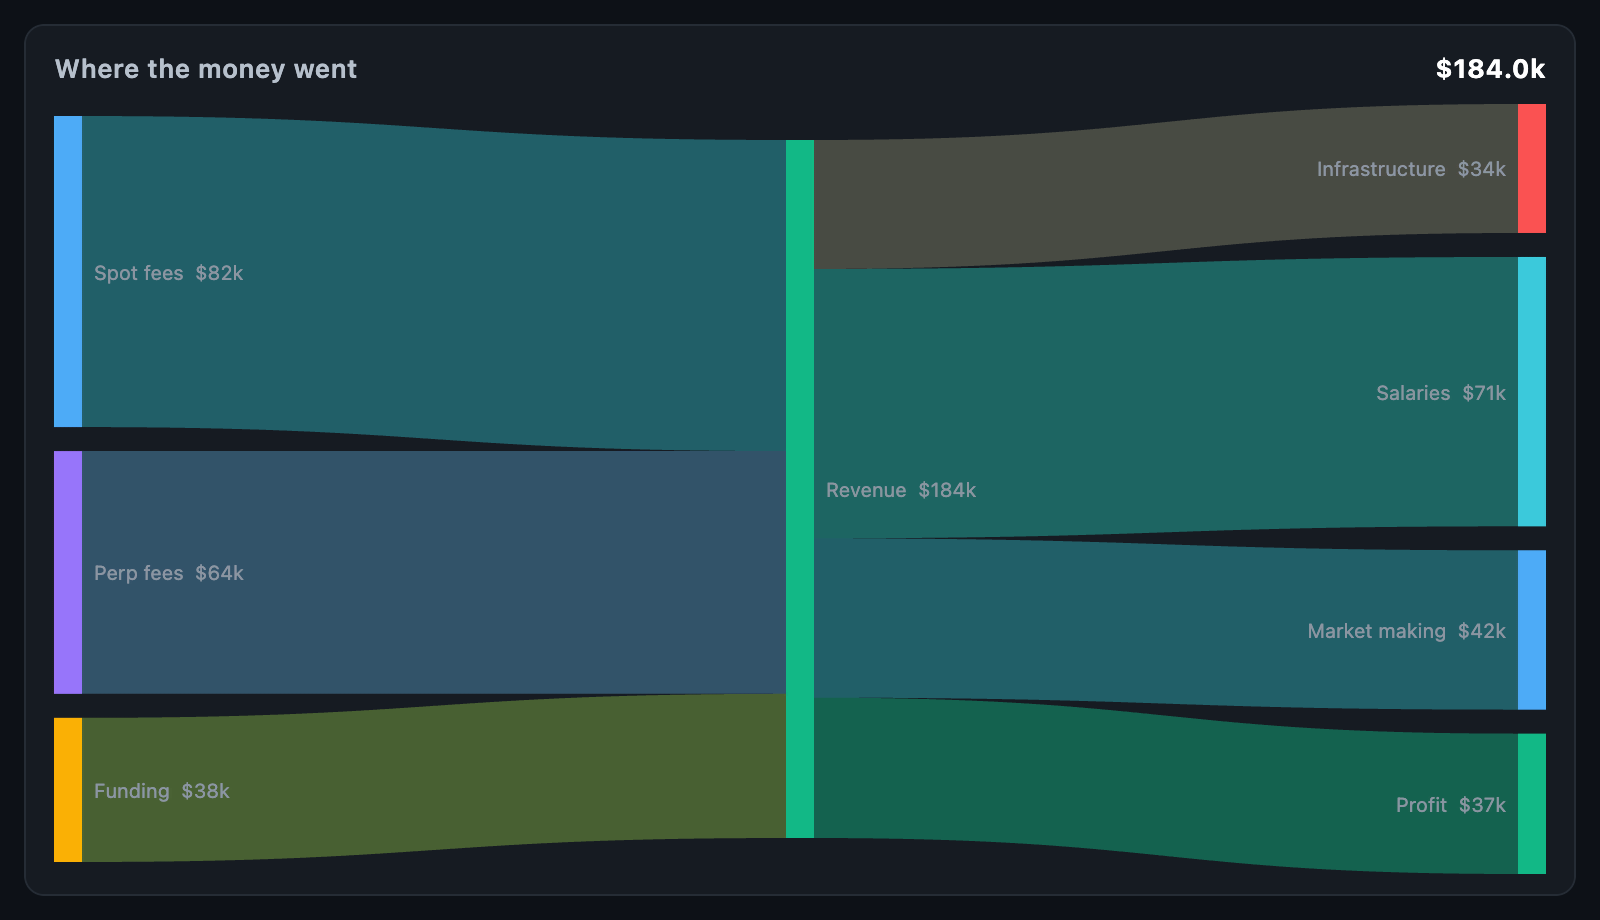
SankeyChart draws flows between nodes as ribbons whose thickness is the
quantity moved. Typical uses include money between accounts, income split into
expenses, order flow between venues and traffic between pages.
SankeyChart(
  nodes: const [
    SankeyNode(id: 'salary', label: 'Salary'),
    SankeyNode(id: 'budget', label: 'Budget'),
    SankeyNode(id: 'rent', label: 'Rent'),
    SankeyNode(id: 'saved', label: 'Saved'),
  ],
  links: const [
    SankeyLink(source: 'salary', target: 'budget', value: 5200),
    SankeyLink(source: 'budget', target: 'rent', value: 1800),
    SankeyLink(source: 'budget', target: 'saved', value: 3400),
  ],
);
The chart fills its constraints. When the height is unbounded, it uses
defaultHeight.
SankeyNode field |
Description |
|---|---|
id |
Name links refer to; unique within the chart |
label |
Display name; otherwise id |
color |
Fixed colour; otherwise taken from palette in order |
data |
Arbitrary app data, returned on touch |
SankeyLink field |
Description |
|---|---|
source |
Id of the node the flow leaves |
target |
Id of the node the flow arrives at |
value |
Quantity moved; sets the ribbon's thickness |
color |
Fixed colour; otherwise a blend of the two nodes' colours |
data |
Arbitrary app data, returned on touch |
Links are ignored when they name an unknown node, when source and target are the same, when the value is zero or not finite, or when they would point backwards (a cycle).
Nodes are placed in columns: a node with nothing arriving stands in the first column, and every other node stands one column to the right of the furthest node feeding it. Bar heights share the height of the tallest column in proportion to the quantity passing through each node.
| Parameter | Description |
|---|---|
nodeWidth |
Width of a node bar (default 14) |
nodePadding |
Gap between two bars in a column (default 12) |
padding |
Space around the chart |
layOutSankey(nodes, links, bounds, …) returns the SankeyLayout the chart
paints, and sankeyNodeAt / sankeyLinkAt hit-test it. Both are public, so a
layout can be computed and tested without a widget.
SankeyNodeBox reports depth (its column), rect, incoming, outgoing and
value (the larger of the two). SankeyLinkRibbon reports its source and
target boxes, where it meets each (sourceTop, targetTop), its thickness
and its path.
| Parameter | Description |
|---|---|
palette |
Colours taken in turn by nodes without one |
linkOpacity |
How opaque a ribbon is drawn (default 0.45) |
showLabels |
Whether node labels are written beside the bars |
labelBuilder |
Custom text for a SankeyNodeBox; default is name and value |
valueFormatter |
Formats values in the default label (default: thousands separators) |
labelStyle |
Style of a node label |
labelGap |
Distance from a bar to its label |
backgroundColor |
Painted behind the chart |
Labels are written to the right of their bar, or to its left when there is no room.
onTouch reports a SankeyTouchDetails as the pointer moves, and null when
it leaves. Either node or link is set, node first when both are under the
pointer.
SankeyChart(
  nodes: nodes,
  links: links,
  onTouch: (details) {
    final node = details?.node;
    final link = details?.link;
    // …
  },
  tooltipBuilder: (context, details) => Card(
    child: Padding(
      padding: const EdgeInsets.all(8),
      child: Text(
        details.node != null
            ? '${details.node!.node.label}: ${details.node!.value}'
            : '${details.link!.link.value}',
      ),
    ),
  ),
);
hoverBorder outlines what is under the pointer, and fadeUntouched (default
true) dims the ribbons that do not touch the hovered node.
animationDuration grows the ribbons and bars in; animationCurve eases it and
animateOnMount controls whether the first build animates. The chart animates
again whenever nodes or links change identity.