





Using Neo4j, Kuzu, or SPARQL? Use our dedicated integrations instead: Neo4j · Kuzu · SPARQL
A graph visualization widget for Jupyter Notebook and JupyterLab powered by yFiles for HTML.
Visualize graphs from many sources out of the box:
- NetworkX ✅
- igraph ✅
- neo4j ✅ (use the dedicated neo4j package)
- pygraphviz ✅
- Native Python dicts/lists ✅
Many more formats are supported via NetworkX imports.
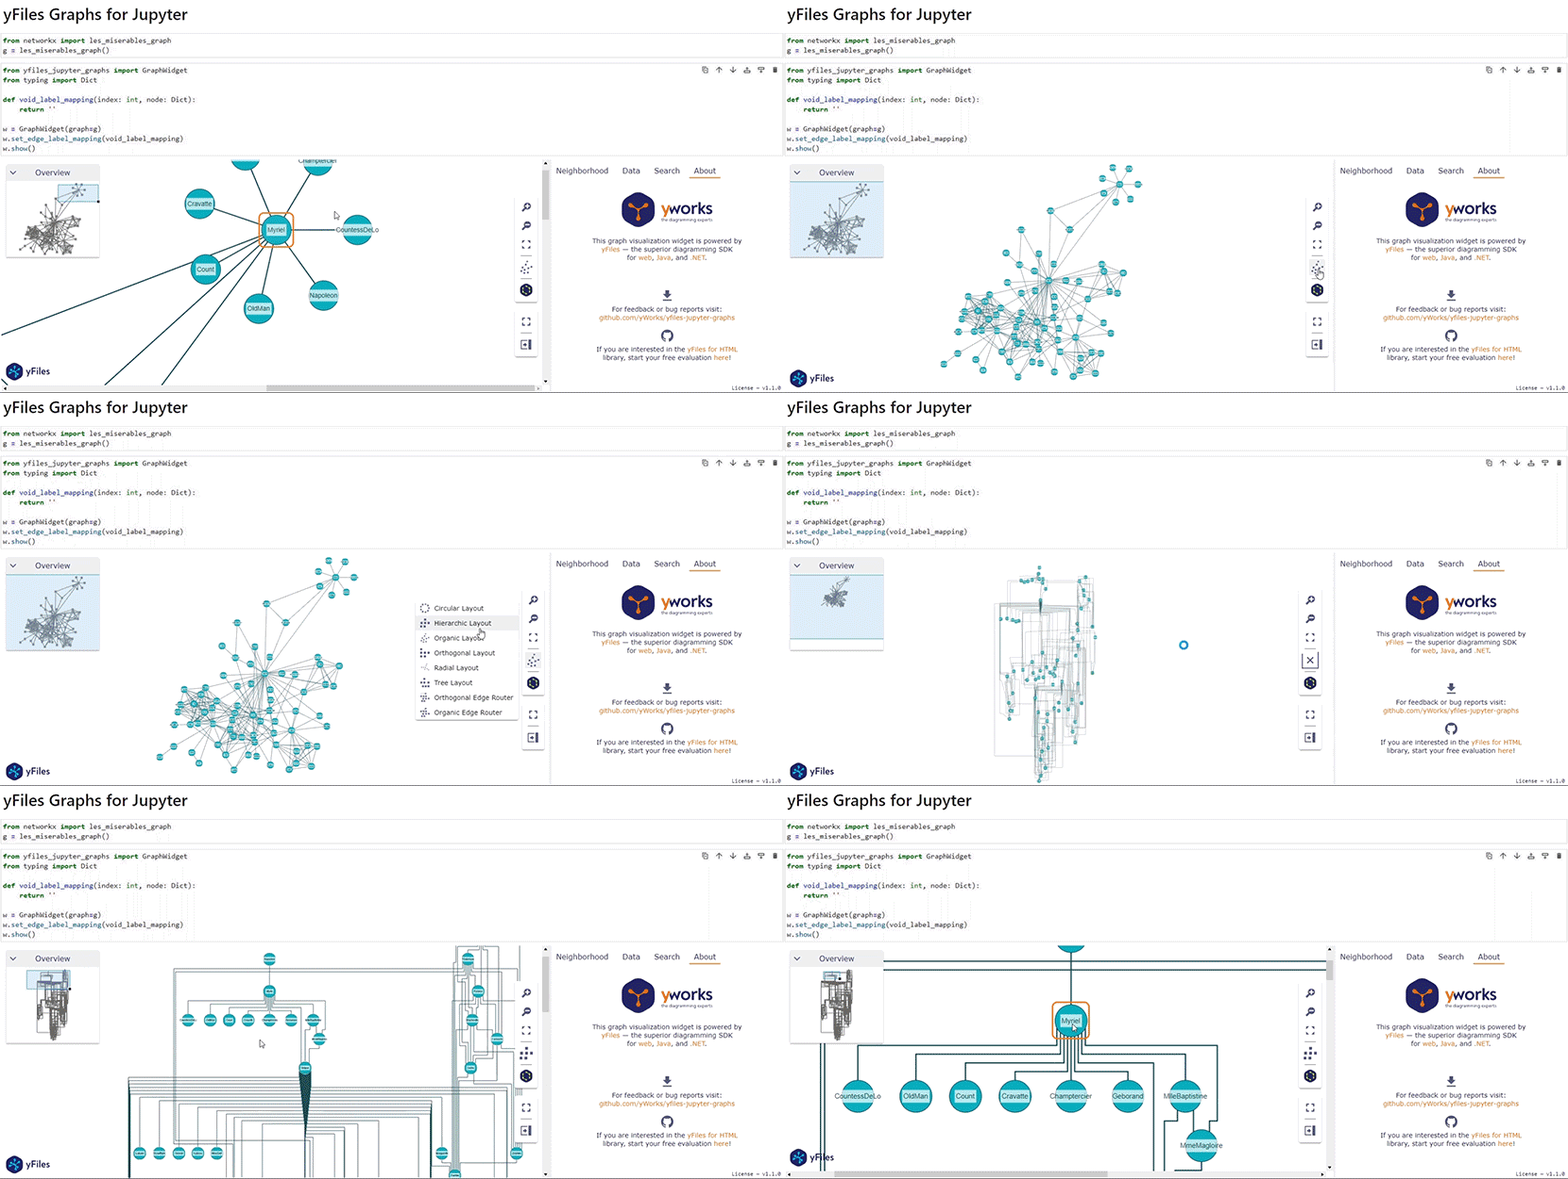
Try the showcase notebook in Colab: https://colab.research.google.com/github/yWorks/yfiles-jupyter-graphs/blob/main/examples/feature-releases/showcase.ipynb
- Fast, production-grade graph rendering (yFiles engine)
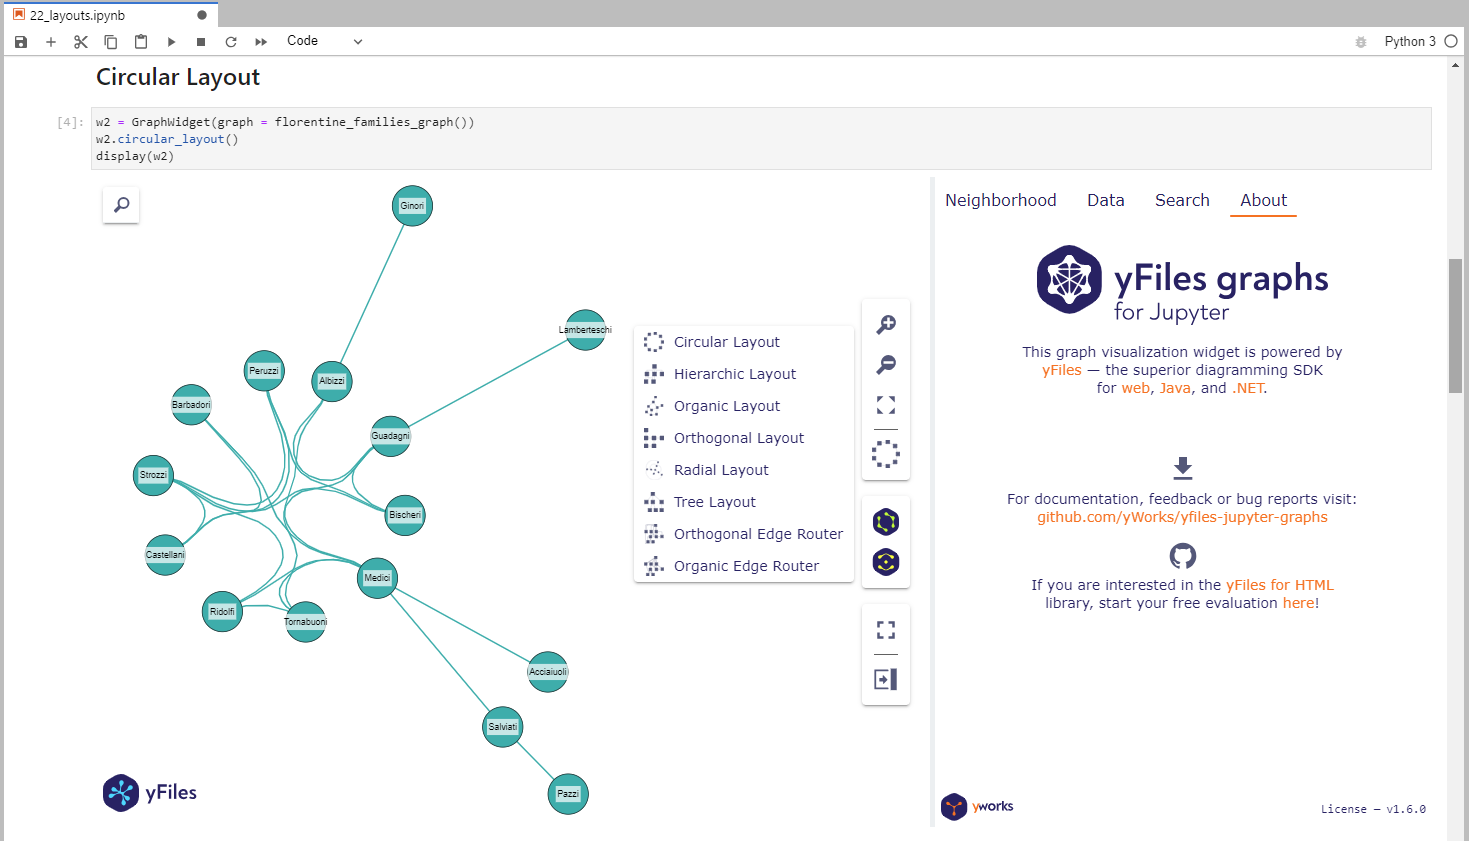
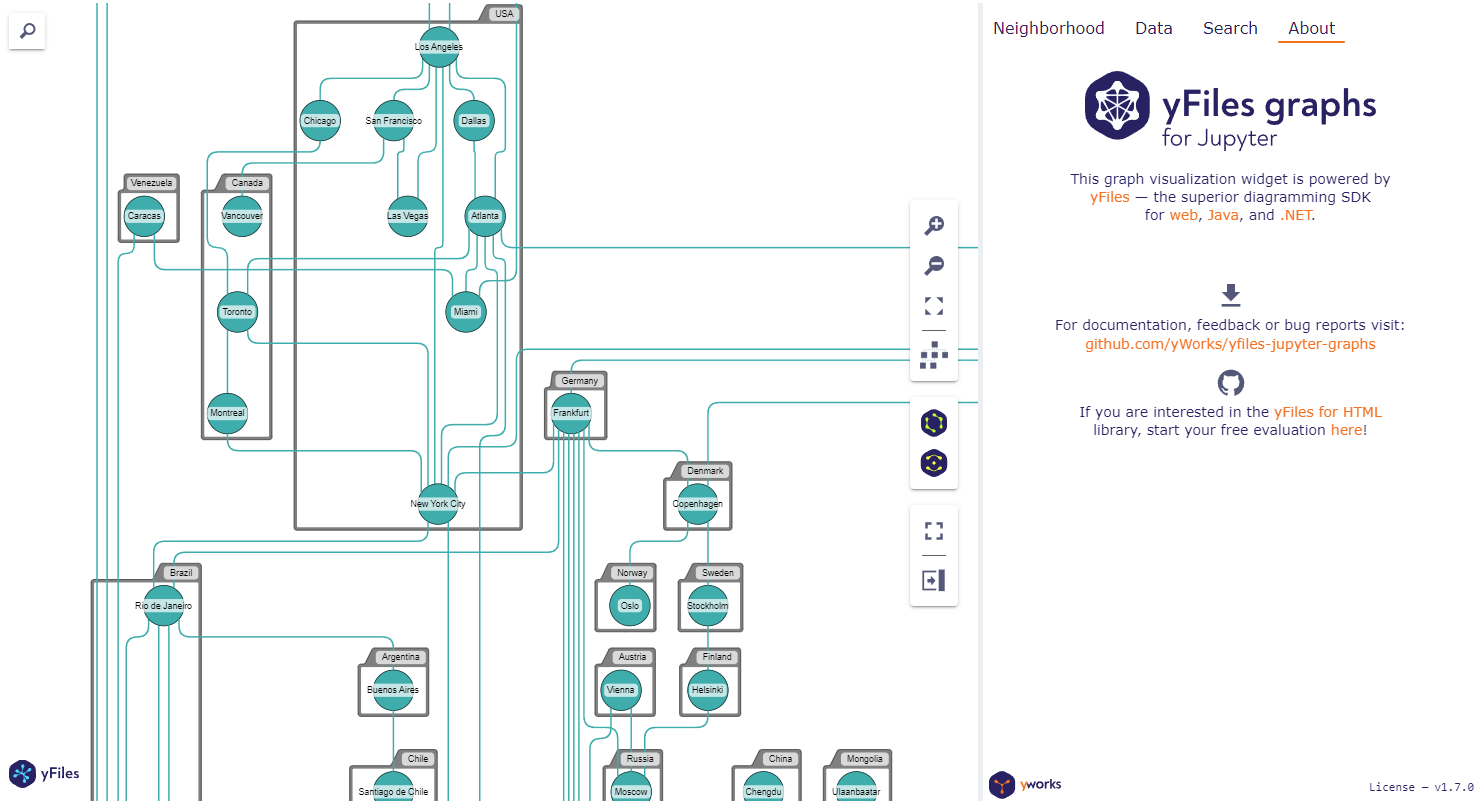
- Multiple automatic layouts (hierarchical, organic, circular, ...)
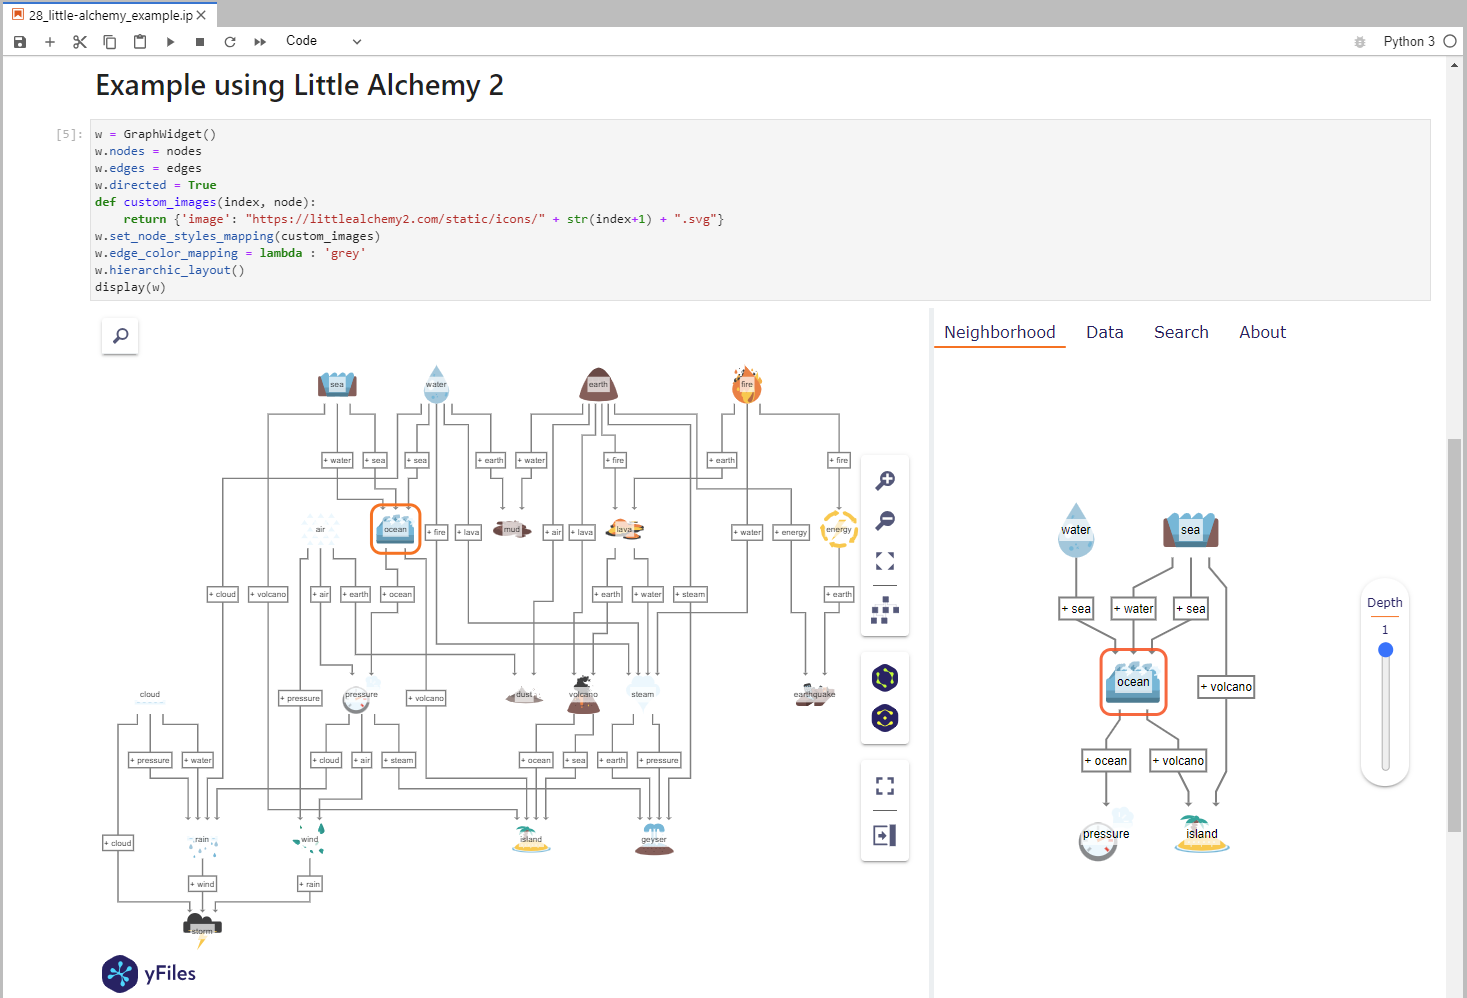
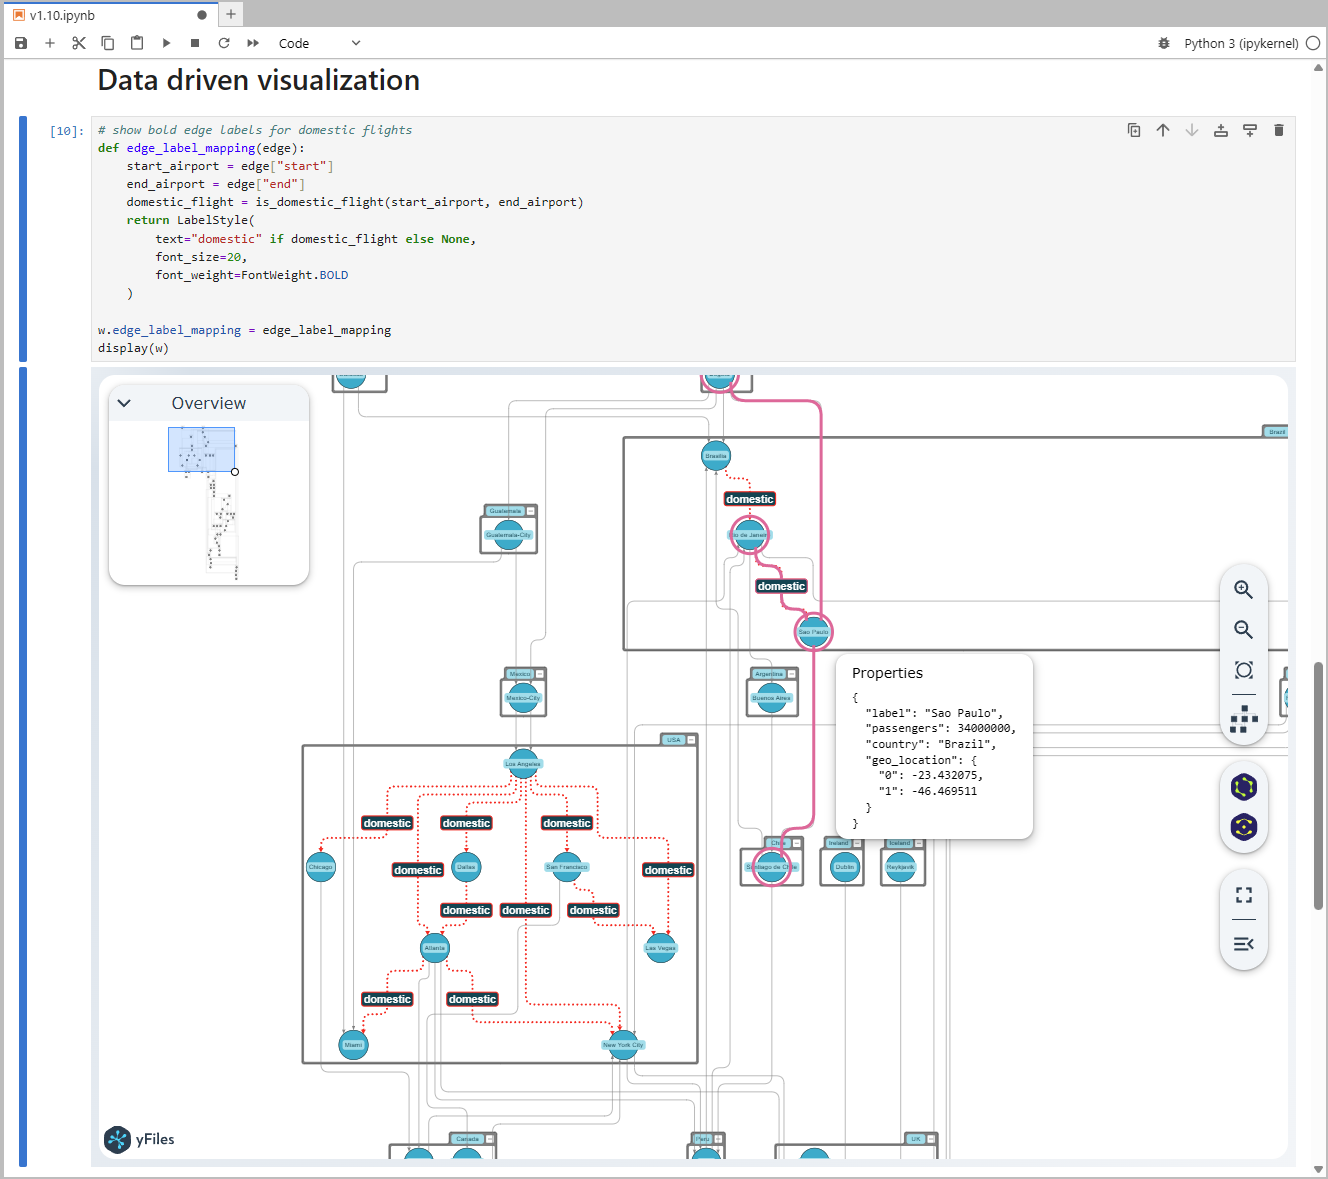
- Data-driven styling (colors, sizes, labels, ...) from node/edge attributes
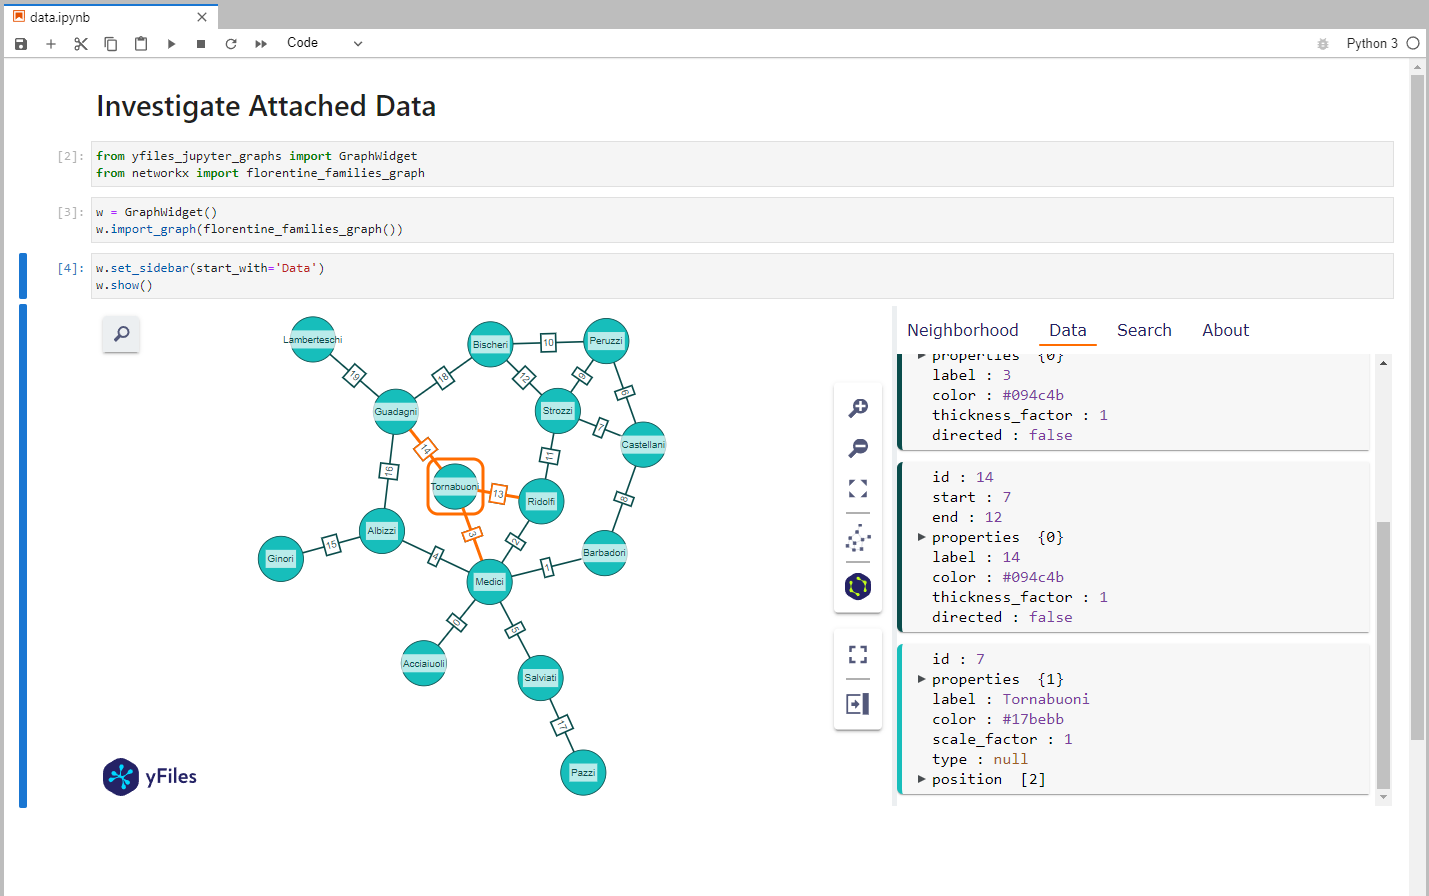
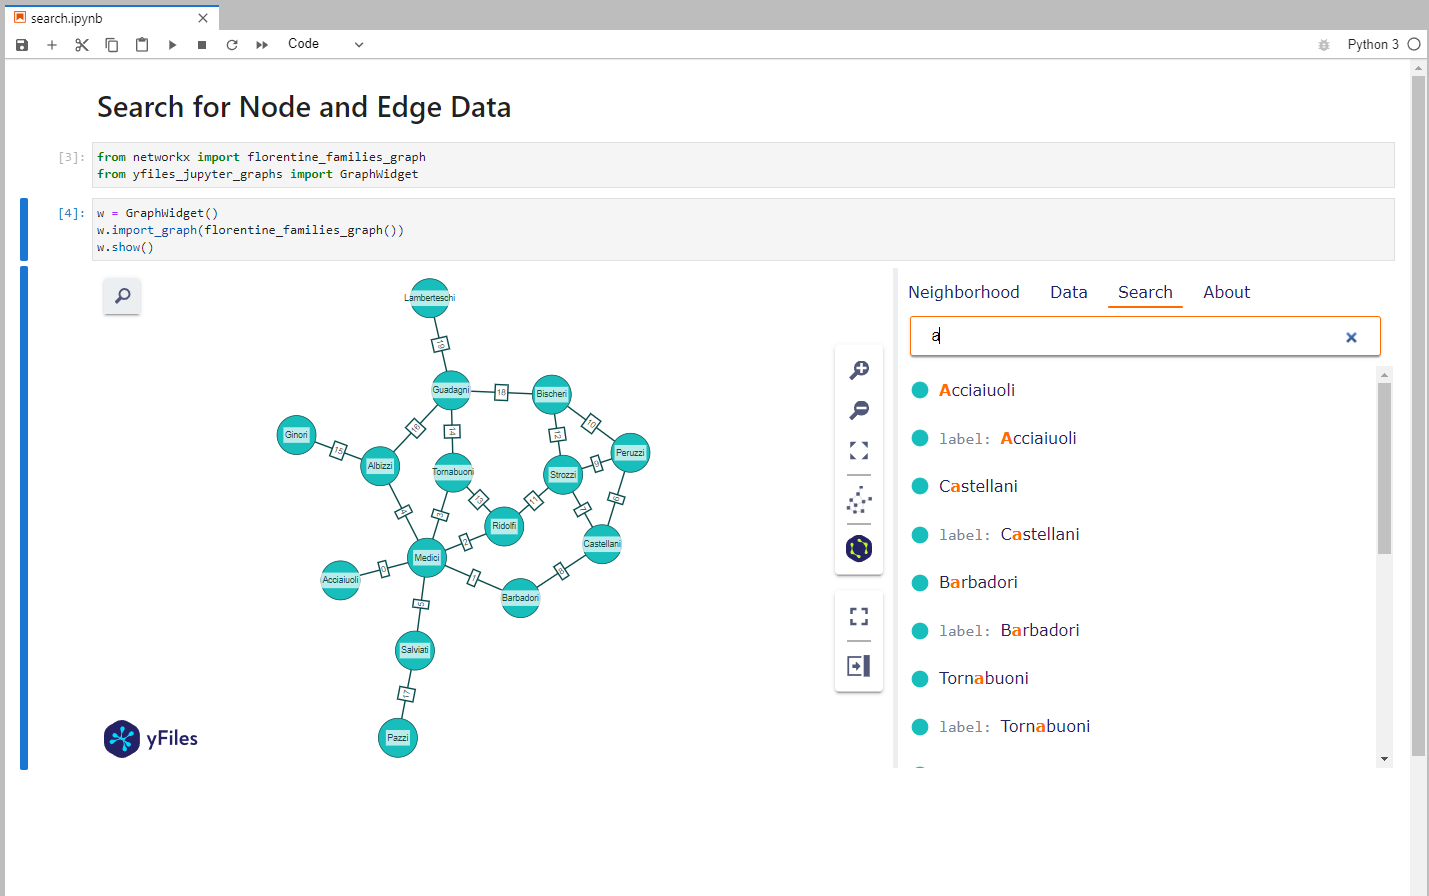
- Sidebars for search, data inspection, and neighborhood exploration
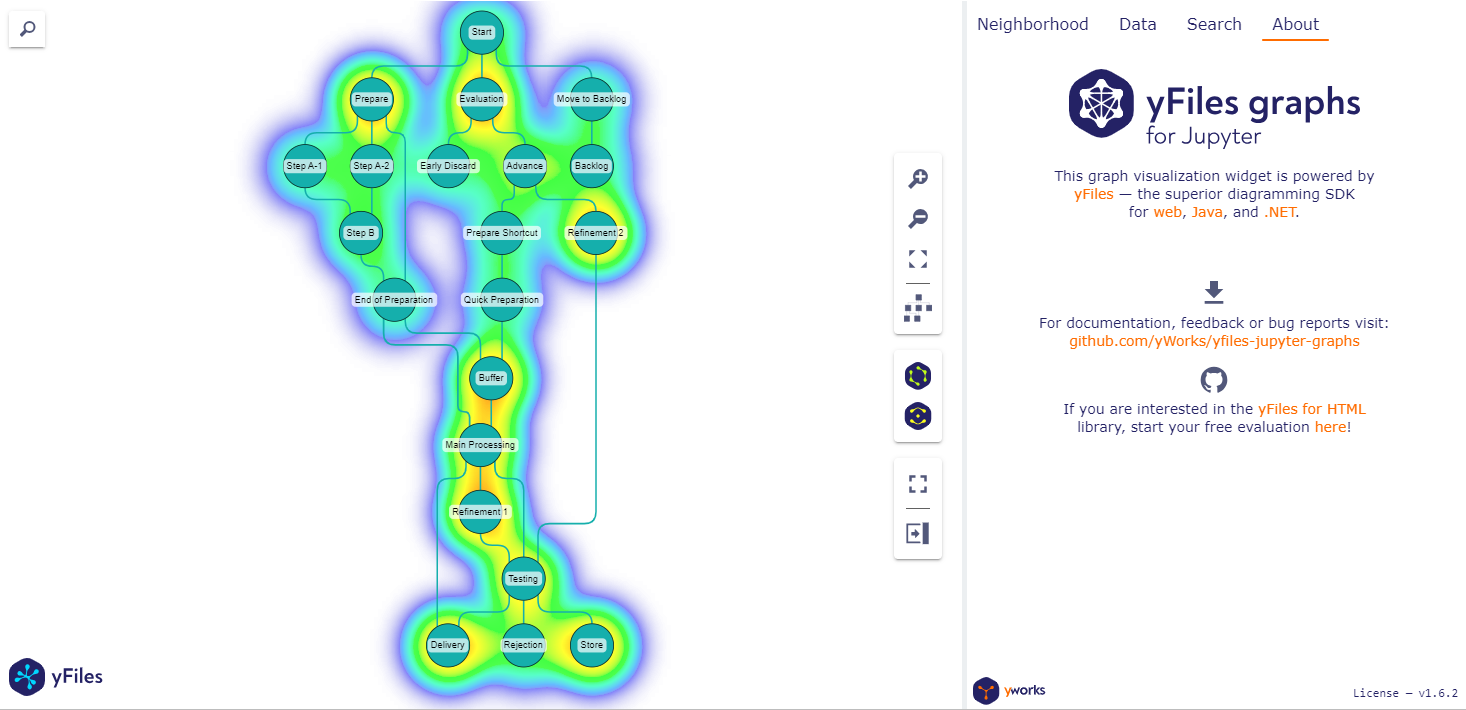
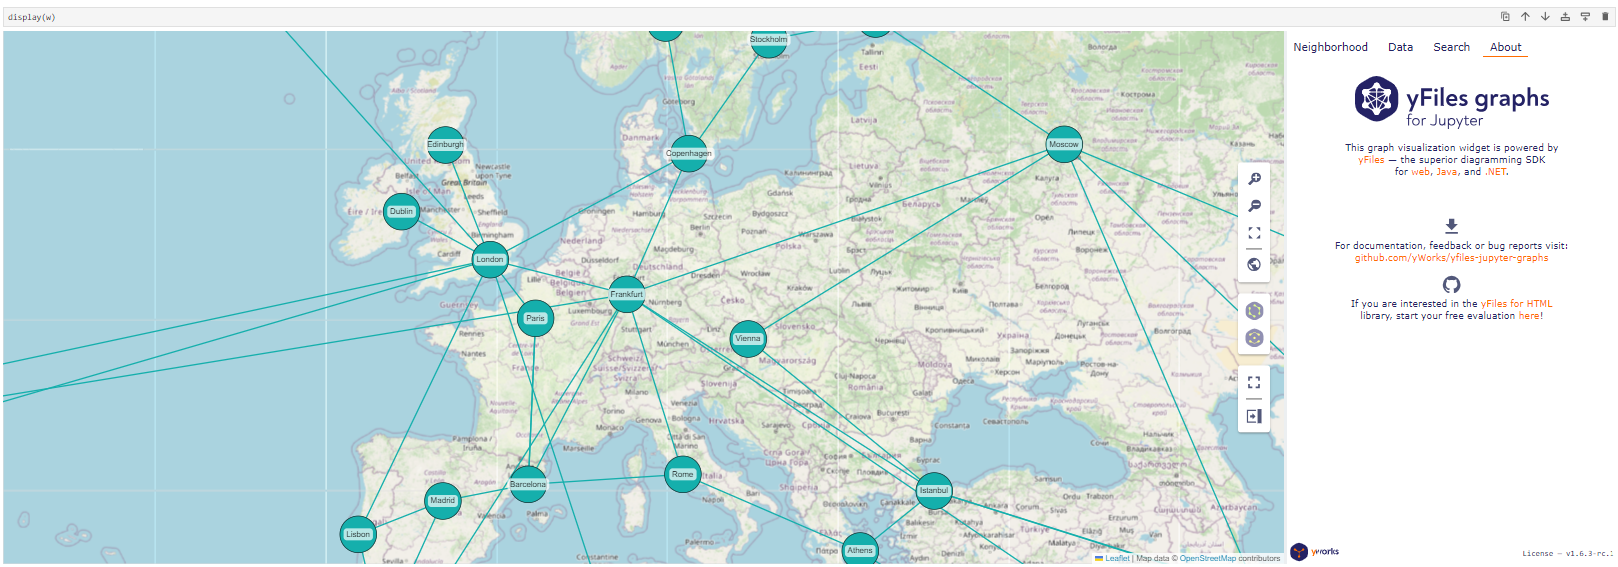
- Heatmaps and map visualization
There are extensions built on top of yfiles-jupyter-graphs that provide tailored APIs and convenient data mapping for their respective ecosystems:
- If you work with Neo4j: use yfiles-jupyter-graphs-for-neo4j
- If you work with Kuzu: use yfiles-jupyter-graphs-for-kuzu
- If you query via SPARQL: use yfiles-jupyter-graphs-for-sparql
Otherwise, continue below with yfiles-jupyter-graphs.
- JupyterLab or Jupyter Notebook
- Visual Studio Code
- Google Colab
- Gemini Enterprise Agent Platform
- Managed Service for Apache Spark
- Azure Machine Learning Studio Notebooks
- Amazon SageMaker
- Kaggle
- Just try it in your preferred platform for Jupyter notebooks
Working with an AI coding agent? Our agent guide contains instructions and best practices for coding agents.
Example start prompt:
Read the instructions at https://raw.githubusercontent.com/yWorks/yfiles-jupyter-graphs/refs/heads/main/agent-guide.md. Then, create a new Jupyter notebook that step-by-step explores the and visualizes it using yfiles-jupyter-graphs. Be creative and design visualizations that highlight interesting insights and aspects of the data.
Prerequisites:
- python >= 3.7
- jupyter notebook or lab
- ipywidgets >= 7.6.0
pip install yfiles-jupyter-graphsImportant: When installing from inside a notebook, prefer
%pip install yfiles-jupyter-graphsover!pip installto ensure the package is installed into the running kernel’s environment.
If you want to start with a clean Jupyter environment that has the widget preinstalled:
mkdir yfiles-jupyter && cd yfiles-jupyter
echo -e "FROM jupyter/scipy-notebook\nRUN pip install yfiles-jupyter-graphs" > Dockerfile
docker build -t yfiles-jupyter-graphs-on-docker .
docker run -it -p 8888:8888 --name yfiles-jupyter yfiles-jupyter-graphs-on-docker
This approach has been verified with
scipy-notebook:lab-3.4.7andyfiles-jupyter-graphs==1.2.1. If you encounter issues with a newer image, please open an issue.
Display a simple graph:
from yfiles_jupyter_graphs import GraphWidget, Node, Edge
w = GraphWidget(
    nodes=[
        Node(id=0, properties={"firstName": "Alpha", "label": "Person A"}),
        Node(id=1, properties={"firstName": "Bravo", "label": "Person B"}),
        Node(id=2, properties={"firstName": "Charlie", "label": "Person C", "has_hat": False}),
        Node(id=3, properties={"firstName": "Delta", "label": "Person D", "likes_pizza": True})
    ],
    edges=[
        Edge(start=0, end=1, properties={"since": "1992", "label": "knows"}),
        Edge(start=1, end=3, properties={"label": "knows", "since": "1992"}),
        Edge(start=2, end=3, properties={"label": "knows", "since": "1992"}),
        Edge(start=0, end=2, properties={"label": "knows", "since": 234})
    ],
    directed=True
)
display(w)
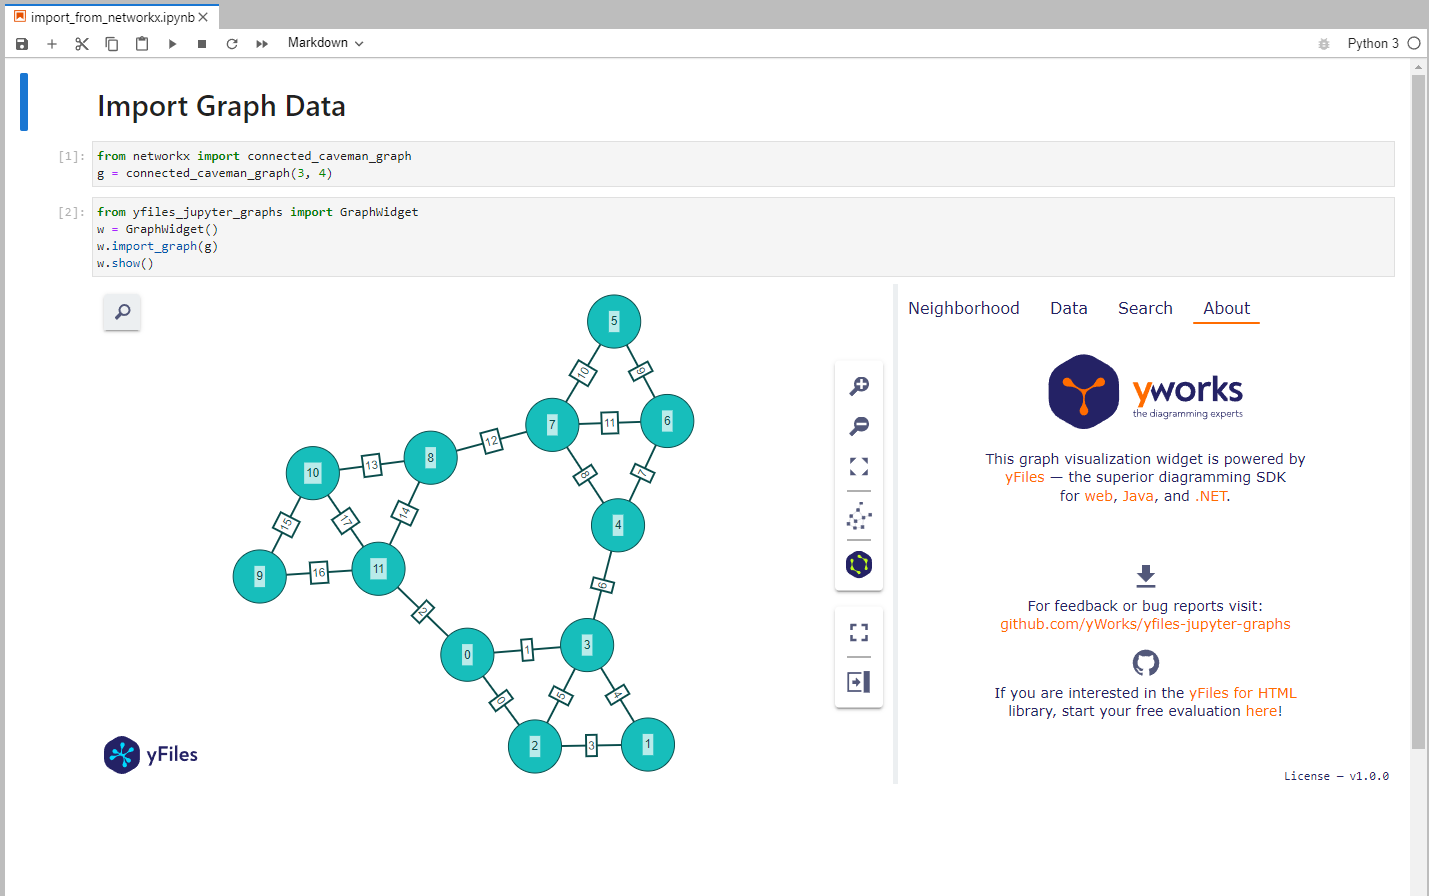
Use the toolbar and sidebar to inspect data, search graph, explore neighborhood and change layouts.
- Check out more examples for the different features.
- Jump directly to the API documentation.

This project is governed by the Code of Conduct. By participating, you are expected to uphold this code. Please report unacceptable behavior to contact@yworks.com.
This widget is by no means perfect. If you find something is not working as expected we are glad to receive an issue report from you. Please make sure to search for existing issues first and check if the issue is not an unsupported feature or known issue. If you did not find anything related, report a new issue with necessary information. Please also provide a clear and descriptive title and stick to the issue templates. See issues.
See LICENSE.md for license information.