The task is very open-ended, and the assignment allows much room for the interpretation. A lot of work was therefore put into extracting the requirements, coming up with reasonable assumptions, making implementation choices etc. - these originally came as tickets. This document compiles the notes for easier reading.
- we assume a torrent-like thing, running in background
- app activity and user interaction are mostly decoupled - user requests/shares files, not expecting immediate arrival/delivery
- the best would be to implement a "watchdog" service on the client side, which would
- track the client session from start of the app to its termination, assigning unique
SessionIDto it - externally measure main processes CPU
- capture internal events from the app by some local lightweight protocol (sockets, named pipes or sth like this)
- format the data as json messages and send to the #7 over the net
- not in scope of this project, but can also terminate/restart main process in case of problems
- track the client session from start of the app to its termination, assigning unique
Which information does the client pass to the service?
We will focus on 1 core metric - %CPU consumed by our app - this is measured periodically. Also, we send events , so that we can relate CPU value at particular moment to application state and other parameters (see Messages object)
How often does the client send data?
Looks reasonable to measure CPU as often as possible, but without impacting client system - needs research. 1-2kb/s is reasonable traffic to consume - enough to send 10 x100-byte messages per second. Current impl. uses streaming protocol allowing request of any length, without need to terminate. It seems good idea for the client just to keep connection open and send data as it comes, in this case server would backpressure if it's overloaded and client could handle this e.g. by taking measures less often.
What happens if the backend is unavailable? What happens if the client fails to send data because it consumed all the CPU?
Client (or watchdog) would also write logs to disk and keep them for some sensible time. When connection/normal operation is restored, logs are sent to collector which parses them and reconstructs the metrics, events and their timestamps. This is likely to be several MB, so we ask the user explicitly before we do this. On the collector side separate endpoint is needed for that - not implemented here.
Please feel free to omit most of the client implementation, and if you want client to send something, like client id, please feel free to assume it does, and place any constraints on it. You can write a simple client implementation or use any API tools available to simulate the requests.
We simulate the client in Integration Tests. The Simulation.scala uses Akka Http testkit together with ScalaCheck generators to feed random data with probabilities tuned for the case, illustrated by our example report (see below)
In order to find out what is going wrong we want you to design a service that handles CPU data reported to our backend.
How does the API look like, which protocol does it use, and why?
We accept messages by http POST, formatted as JSON lines - each line of the request body is a message. They are treated as a stream, fed directly to the database. There's no restriction on the request length, nor need to close it. It seems good idea for the client just to keep connection open and send data as it comes, in this case server would backpressure if it's overloaded and client could handle this e.g. by taking measures less often.
How does the service handle scaling, restarts, crashes etc.?
Since it's stateless, no special handling is needed
Which database or database family to use, if any, and what schema would it have? Do you need to store everything the client sends?
After some research we decided to use InfluxDB - a feature-rich time-series database. And yes - store everything client sends. We store all the information from the messages as tags, except the CPU which is field apart from this distinction InfluxDB is schema-free.
It is very simple http server, implemented with Akka Http and using alpakka connector to write to InfluxDB. Nice detail is that entire pipeline is made of Akka streams, so it can propagate backpressure from the database all the way down to the client. Alpakka connector uses legacy 1.x api, which needed a little hack at setup stage, but having Akka streams all the way through certainly worth it.
The protocol messages are defined in Messages object.
Currently, only /sessions endpoint is implemented, accepting Session messages
The collected data should be processed and aggregated in an intuitive way such that it helps troubleshooting which clients are having a problem with the CPU usage. Service is responsible for generating the report on the data.
Report is intended for Head of Product in FilesForYou, so she can get an idea of how bad the issue is (for an API-based report, assume that we build a web UI).
Aim to design a solution that would cover the problem enough to draw the conclusions about the affected clients, so that the client team can triage their code and locate the faulty changeset
We will focus on 1 core metric - %CPU consumed by our app. Report should relate it to other metrics/properties/events of the app lifecycle. An ideal report would allow drill-downs like:
- over the last 12 hours 30% of the sessions had CPU over 30%, of those:
- 80% where running version 6.04, of those:
- 42% had CPU over 30% when indexing local files
- 5% had CPU over 80% when receiving files, of those:
- 98% where receiving file with name longer than 42 characters
- 10% where running version 6.05, of those:
- 100% had CPU over 80% (oops)
- 80% where running version 6.04, of those:
Our example is a bit more limited: We were able to identify version 700 consuming more than the others (1). Zooming into that version we've localized the peaks to login stage(2).
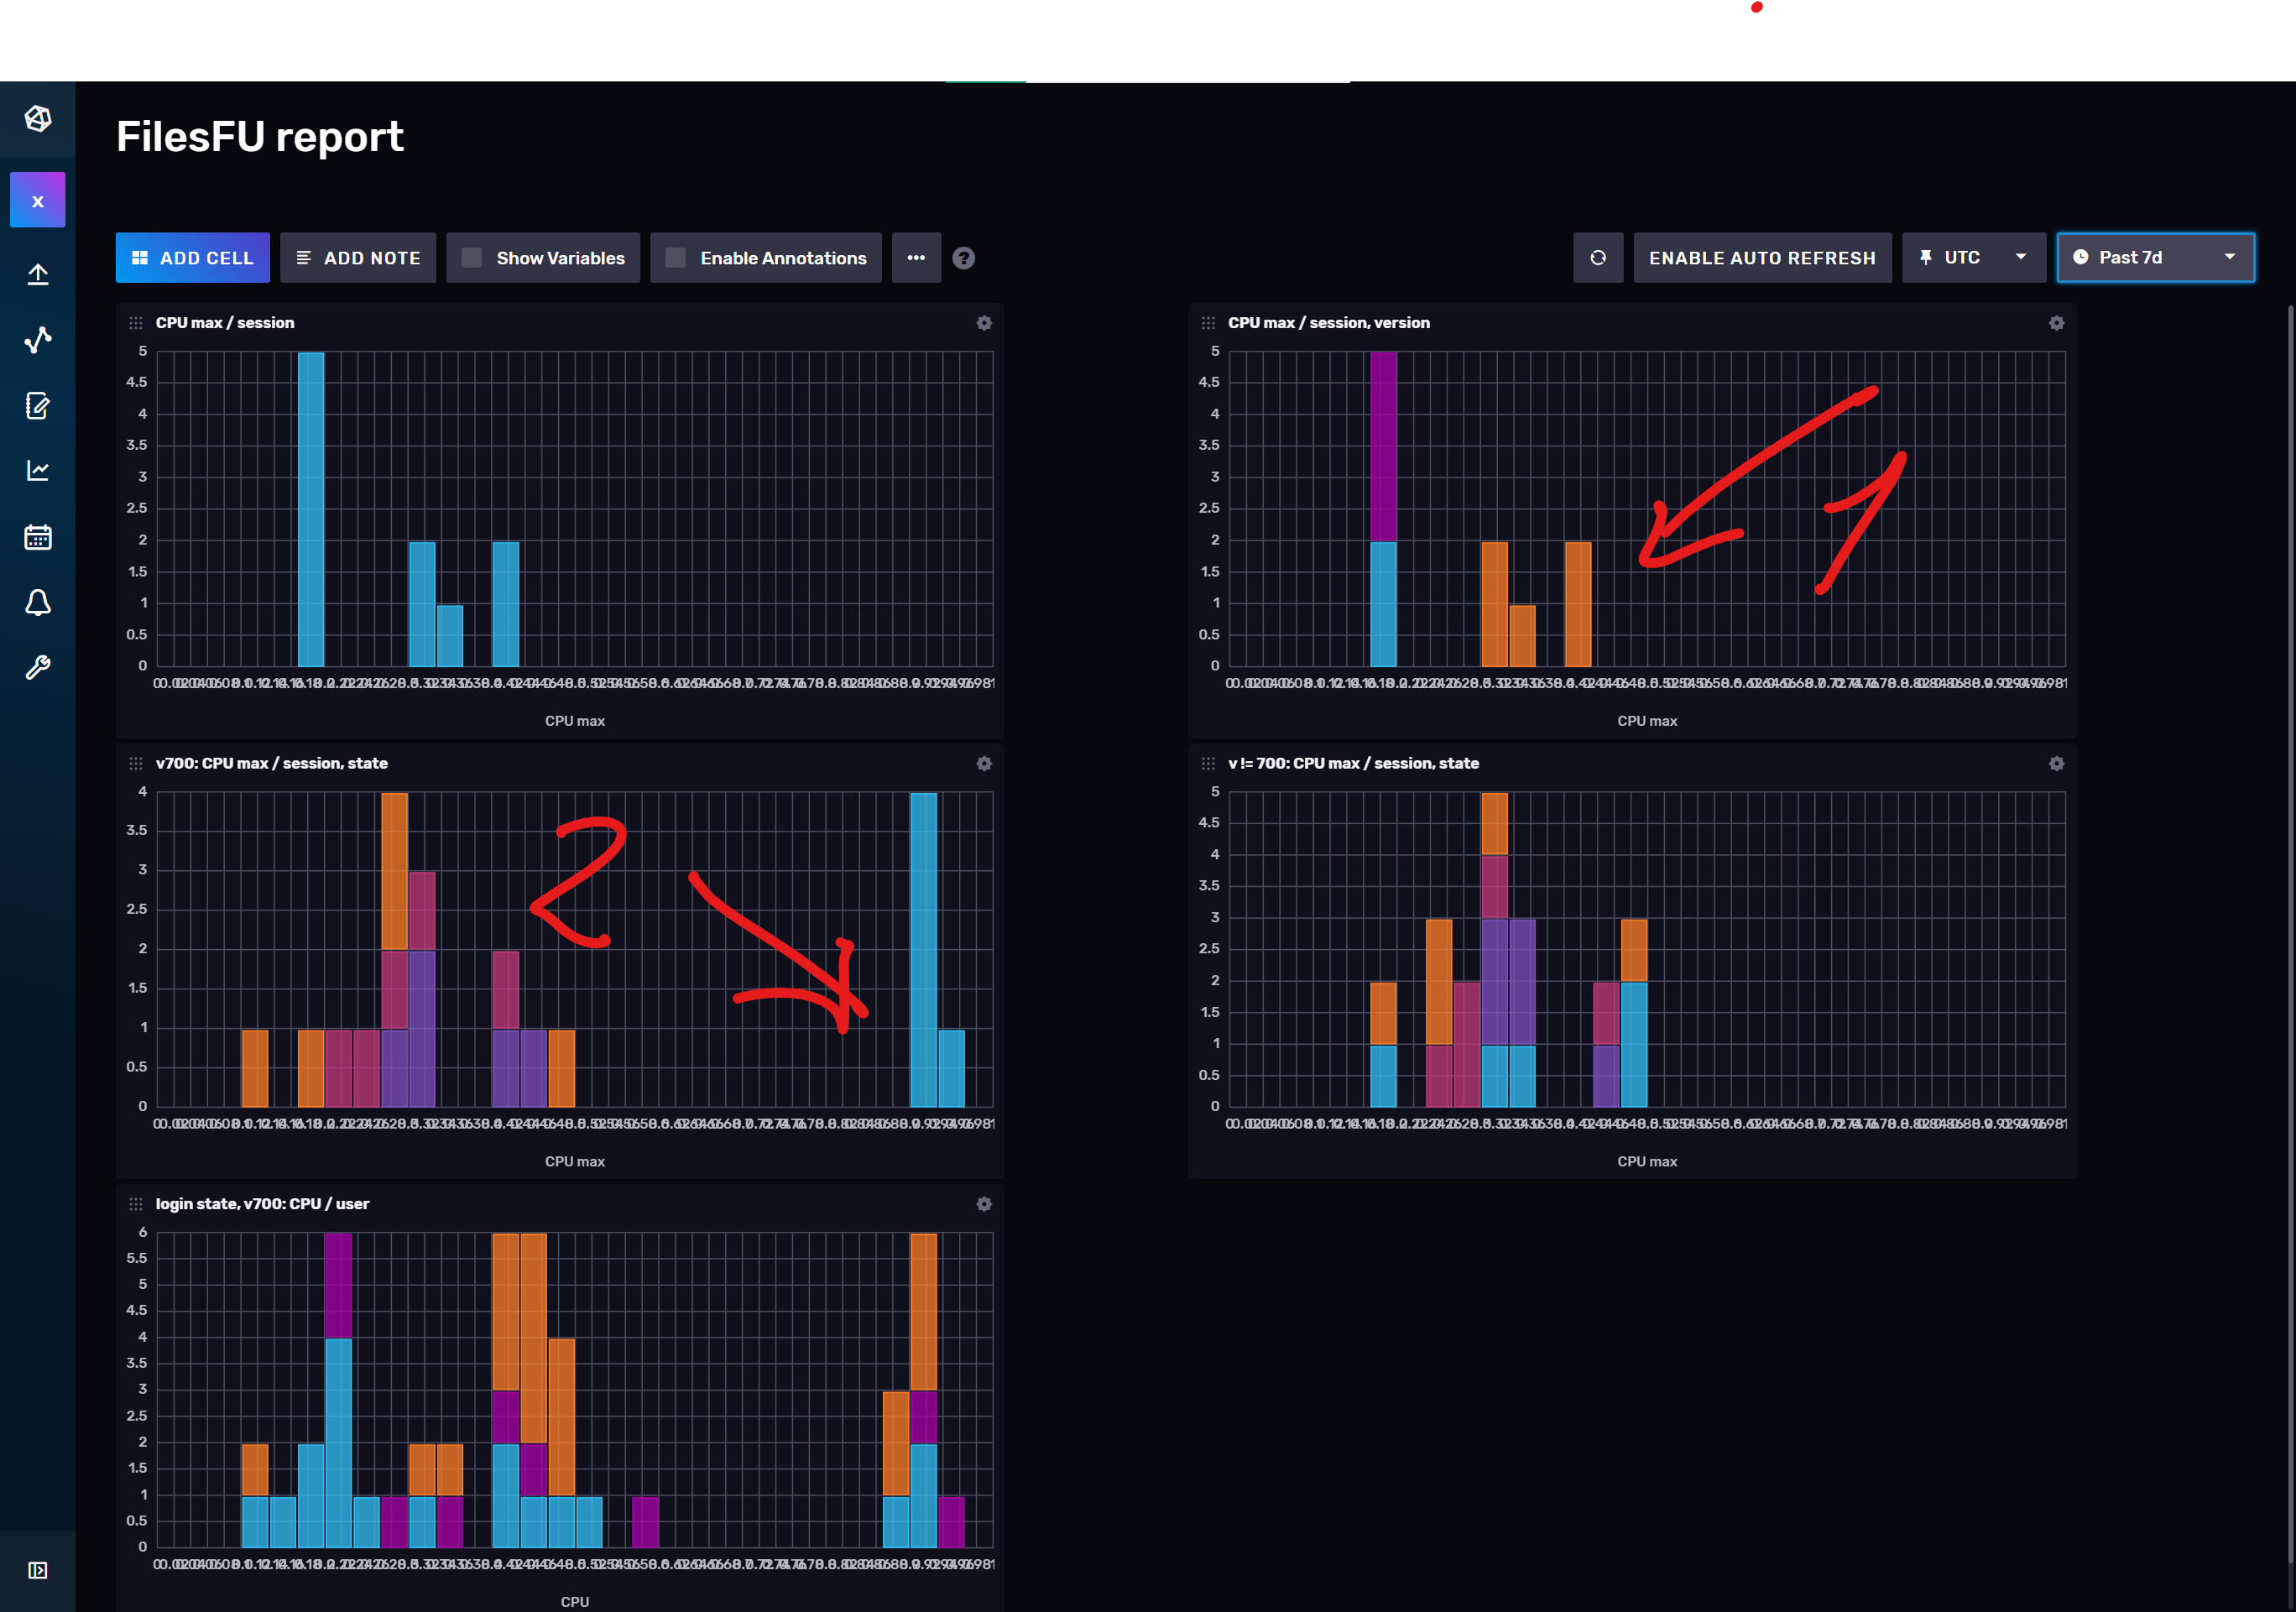
This dashboard in exported as JSON and can be imported to any InfluxDB instance. If it's fed with our simulation data, the dashboard would show something similar. Some queries from this report are also available separately
we spend 10 mins of the interview talking about a less practical approach -- just to explore in which direction you'd take it without Flux. Feel free to take some notes on how the solution could look like;
The main question is about introducing the state in Data Collector layer. If it's stateful - i.e. has to keep some information between messages coming from client - this introduces a lot of questions regarding load balancing, failover etc. In general, I would try to keep it simple and just forward the messages to DB as long as it is able to handle the volume.
If it cannot - some aggregation/reduction has to happen before the data is stored. Here are some possibilities:
- the "watchdog" component could average the measurements over short time windows (like 1-5s)
- but has to be smart send at least one measurement for short events (like login, or incoming file)
- it has advantage of dealing with only one session at time
- if that is not enough the collector has to keep the state for each session and do aggregation by its own
- this can be simply averaging over time windows, like above
- can also reduce it to the session-level. I.e.:
- keep info about particular session in memory
- computing aggregates on the go.
- store running values periodically
- clean the in-memory storage when the session is over
- "memory" can be local memory, but can also use sth like Redis
- load balancer has to care about mapping sessions to instances
- for this we'd change the endpoint path to look like /sessions/{SessionID}
- another idea is to use intermediate storage, capable of keeping reader's position, e.g. Kafka. We have more components in this case:
- simple stateless proxy sending everything it gets from client to kafka
- "aggregator" consuming from kafka and reducing the data to session level
- we set kafka partitioning key to the session id, so single session always go to one aggregator instance
- it will commit to kafka only after things are computed and stored to DB
- no worries about failover this way - if one breaks, other picks up the session as a whole