



mezura counts the lines of a codebase quickly and accurately, along with user-defined keywords like classes and structs.
It tracks how the figures move between runs, and between any two git revisions.
It lets you decide what counts as what, and how the report looks.
The figures can be grouped by language, by module and by file.
Windows, Linux and macOS binaries are built and tested on every release.
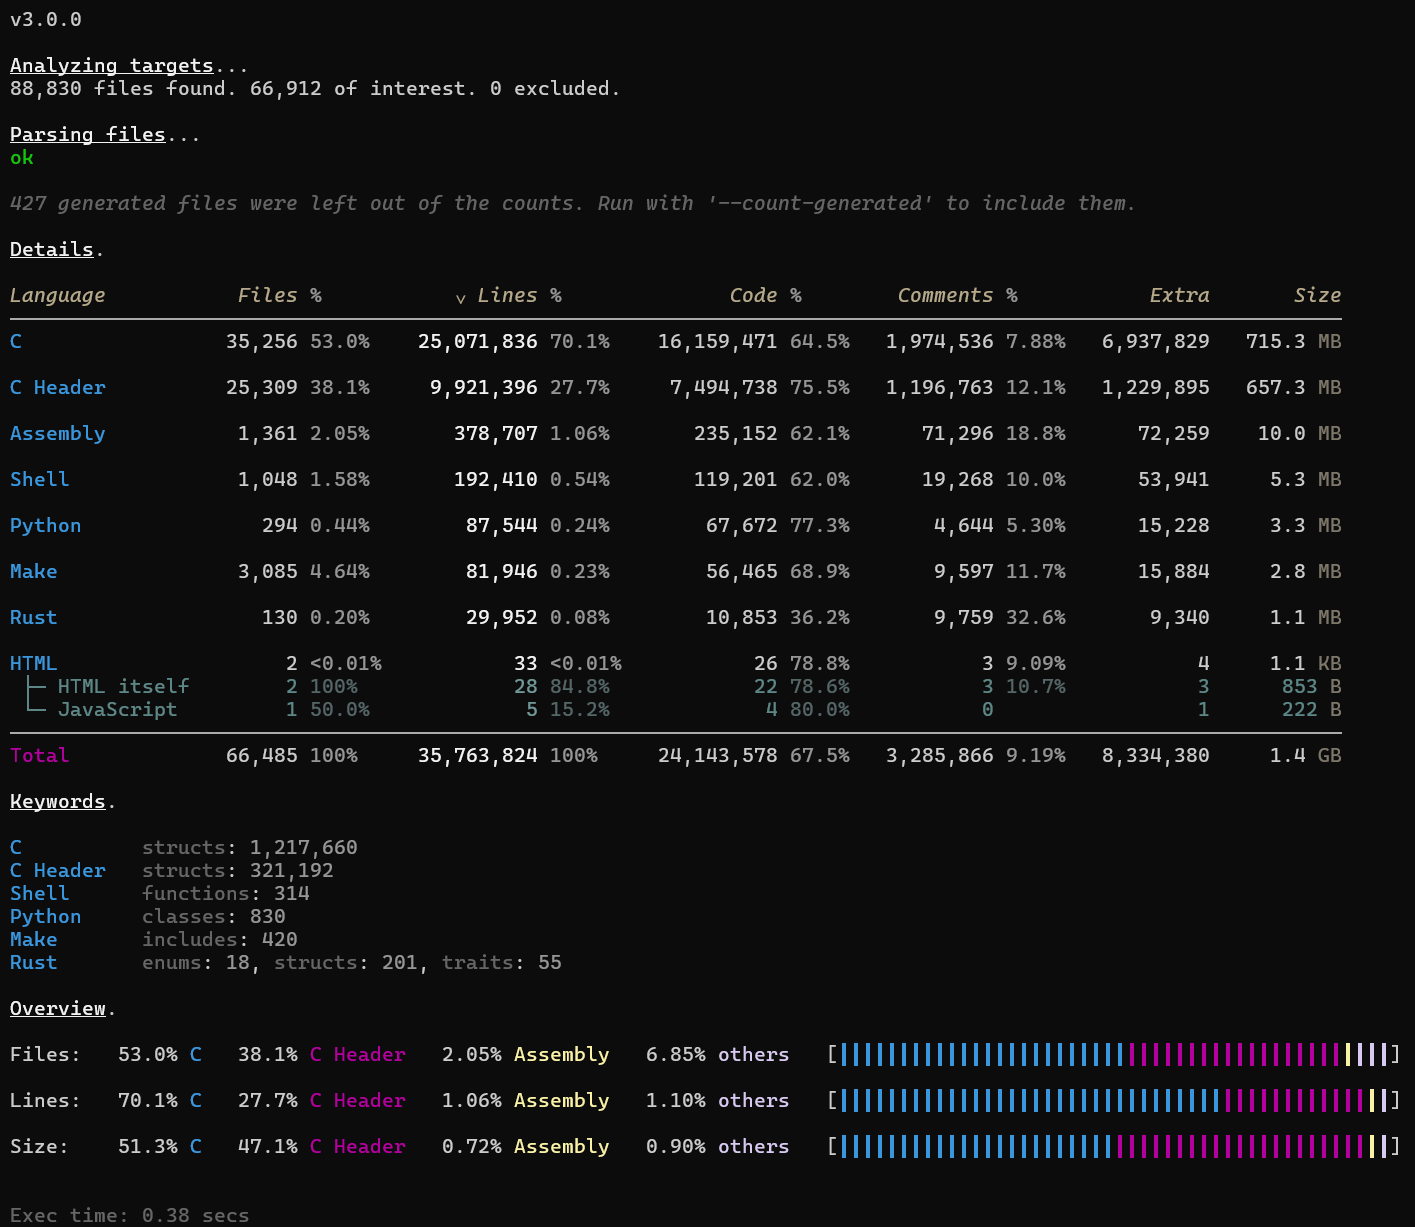
The whole Linux kernel (some languages were cut for screenshot purposes):
- Why mezura
- Installation
- Usage
- What is counted
- Taking the result elsewhere
- Tracking growth
- Configuration
- Themes
- Supported languages
- Accuracy and limitations
- How it compares
- Performance
- Contributing
- License
Things it does that most counters do not:
- Ensures the right language for each file. When two languages claim one extension, the way
.mis MATLAB and Objective-C and Mercury all at once, every file is identified by its own content: a#!line first, then heuristics on its content. And you always have the last word: set your preferences globally inlanguage_conflicts.txt, or per-project through its configuration, or--force-languagefor one run, or even per module in the same run. See Supported languages. - Discards non-code files with a matching extension (no more Make dependency
.dfiles counted as the D language!). Alongside the minified and generated files that are skipped by default, they are reported as skipped. See What is skipped. - Keyword counting. Occurrences of words you pick per language, classes, structs, traits, anything, counted only where they appear as code and never inside a string or a comment.
- Nested languages. The
<script>and<style>blocks of HTML, Vue, Svelte and Astro files are counted as the distinct languages they hold. - Modules. Give a name to parts of a project and the report is grouped by these parts as well as by language. This way you can split your project into e.g. Frontend and Backend and Tests and see distinct reports for each module in the same table in the same run. See Modules.
- Track the history of your codebase. Log runs and compare against earlier ones, or diff against a git revision. See Tracking growth.
- Diff view of git revisions or json files. You can see the diff between the current state and a git revision, or between two revisions, or between an earlier run that was saved in a json file. See Diffs.
- Two counting models to pick from. By default a line counts by what it says: a blank line inside a comment
is blank, a lone
}is neither code nor comment.
--counting regionswitches to the model most other counters use, so the behavior matches theirs.
See The counting model. - Per-line explanations.
--explainshows one file line by line with the verdict for each line, for checking a count that looks wrong. See--explainin COMMANDS.md. - Very customizable output. You have a lot of control about how mezura counts, and also about how it presents the results to you. You don't like the layout? You find it very busy with many sections? You don't want the animations? You can change everything. See Commands.
- Themes. Everything printed can be styled and colored: 78 tokens, 13 bundled themes, and an interactive web editor to experiment. See Themes.
- Output for programs. One JSON document with
--output json, and an MCP server so a coding assistant can run mezura itself. See Taking the result elsewhere. - Data driven. All the files, languages and the settings mezura uses are extracted to your machine, where they can be inspected, changed, or extended very easily. See The data directory.
Also, it's the fastest line counter. See How it compares.
And it's also the most accurate at what it measures. See Accuracy and limitations.
The only thing you need is the binary, and there are 3 ways to get it:
cargo install mezuraTo update an existing installation to the latest version, just run the same command again: it will fetch the newest published version, rebuild, and replace the old binary.
After cloning or downloading the repo:
cargo build --releaseGrab the one for your platform from the latest release.
mezura                                   # count the current directory
mezura ./src                             # count one directory
mezura ./src, ./tests                    # count two; commas separate targets
mezura frontend=./web backend=./api      # group the report by part (modules)
mezura ./src --diff main                 # what changed since main
mezura --by-file                         # show results for every file separately
mezura src/main.rs --explain             # why each line was counted the way it was
In Windows PowerShell a comma needs a backtick before it, or the whole list needs quotation marks:
mezura "./src, ./tests".
Files that a .gitignore ignores are skipped by default, and so are minified and generated files, so build artifacts and dependencies do not pollute the stats. See What is skipped.
A run can be stopped at any time with Ctrl-C: the moving lines never hide the cursor or take over the screen, so the terminal is left as it was.
One line per command, grouped by what it touches:
WHAT IS COUNTED

  --targets            the directories and files to count, and the names to group them under (modules)
  --counting           whether a line counts by where its words are or by where the line sits
  --exclude            paths to leave out, as glob patterns
  --languages          count only these languages and leave every other one out of the report
  --exclude-languages  count everything except these languages
  --force-language     count an extension as the language you pick, even if another one claims it
  --no-gitignore       count the files a .gitignore ignores
  --no-ignore-files    count the files a .ignore or a .rgignore hides
  --search-in-dotted   go into directories whose name starts with a dot
  --count-minified     count the minified files that are left out by default
  --count-generated    count the generated files that are left out by default
  --count-not-code     count the non-code files that are left out by default
  --no-heuristics      never try to automatically resolve the contest when two languages claim the same
                       extension
  --no-shebang         identify every file by its name alone, leaving the '#!' line inside it unread
  --show-languages     print the languages this installation knows, with their extensions, and stop

HOW THE REPORT LOOKS

  --layout             the shape of the details section: a table, a box, a list, or a matrix of modules
  --sort               which column the languages are ordered by
  --top                show only this many languages, and say how many were left out
  --by-file            give every file its own row, or only the biggest few of each language
  --hide               parts of the output to leave unprinted
  --theme              apply a theme, which is a whole look kept in one file
  --style              override the color and attributes of one kind of printed text
  --bar-thickness      the character the overview's percentage bar is drawn with
  --progress-bar       the characters the live progress bar is drawn with
  --number-separator   the character between the thousands of every printed number
  --decimal-separator  the character before the decimals of every printed number
  --show-themes        print the themes this installation holds, each previewed, and stop
  --theme-editor       open a page for tuning the colors of the report, and stop

TAKING THE RESULT ELSEWHERE

  --output             text for a person, markdown for a page, or one JSON document for another program
  --log                append this run to the log of the loaded configuration

COMPARING WITH EARLIER RUNS

  --compare            how many earlier logged runs to show the difference against
  --diff               what changed since an earlier run, or between two of them

YOUR DATA DIRECTORY

  --save               save the flags of this run as a named configuration
  --load               take the flags of this run from a saved configuration file
  --no-default-config  ignore the default configuration of this machine
  --save-theme         save the way this run looks as a named theme
  --show-configs       print the configurations this installation holds and stop
  --restore            put the data directory back to what this version ships, and stop

THE SETTINGS OF A PROJECT

  --save-local         save the flags of this run as the settings of this project
  --no-local           ignore the settings of the project being counted

TUNING AND DIAGNOSTICS

  --explain            show one file line by line instead of printing a report
  --threads            how many threads walk the directories and how many parse the files
  --show-faulty-files  name the files that could not be parsed, and what went wrong with each
  --show-skipped       name the files that were left out as minified, generated or not code

THE PROGRAM ITSELF

  --help               this list, or the full help of the commands you name
  --version            the version of this binary and the day it was released
  --changelog          what changed in this version, or in every version with 'full'
Run --help <command> for the full text of one command, or --help full for all of them. The same
texts are in COMMANDS.md, so they can be read without a terminal.
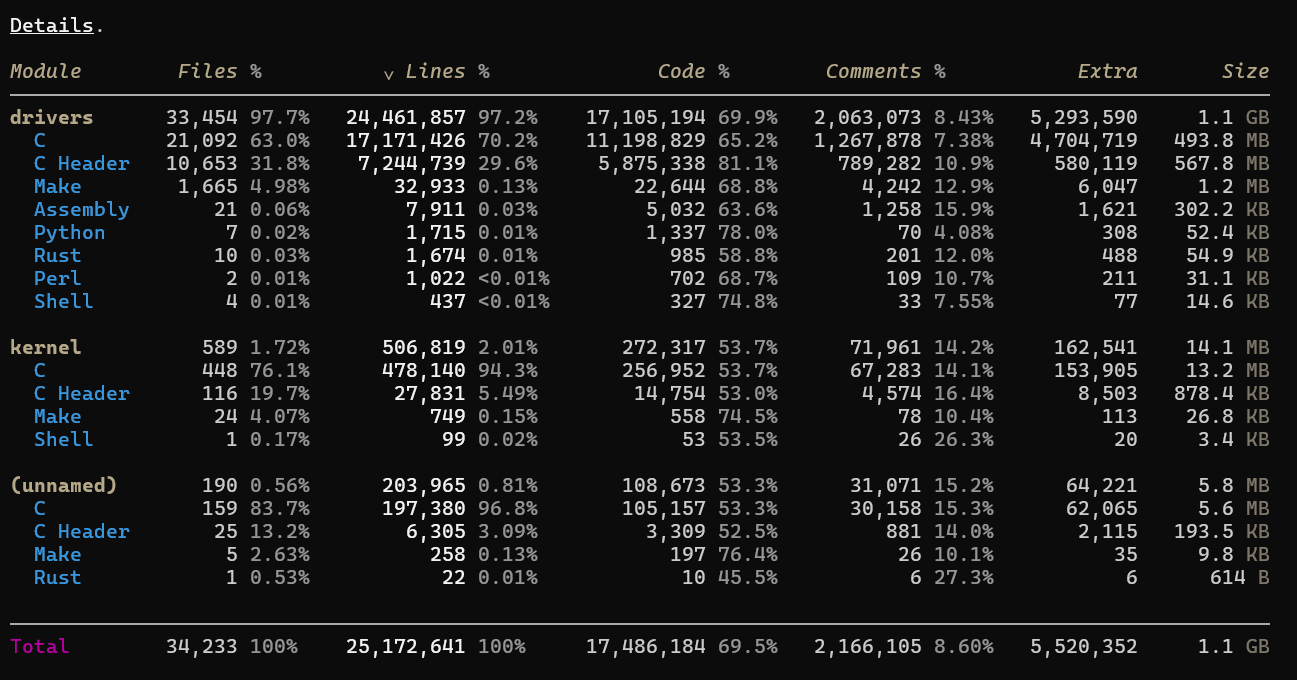
Give a target a name and the report is grouped by that name as well as by language:
mezura frontend=./web backend=./api
mezura ./project tests=./project/tests
Every file belongs to exactly one module and the most specific path wins, so the second example
means "the tests there, the rest of the project here". Targets that were not explicitly claimed by a module
are shown under a row called (unnamed). A comma continues a module and a space ends it,
so tests=./api/tests,./web/tests is one module of two directories.
Each module gets its own block of rows, with its own languages and totals, and the history section then records how each module grew.
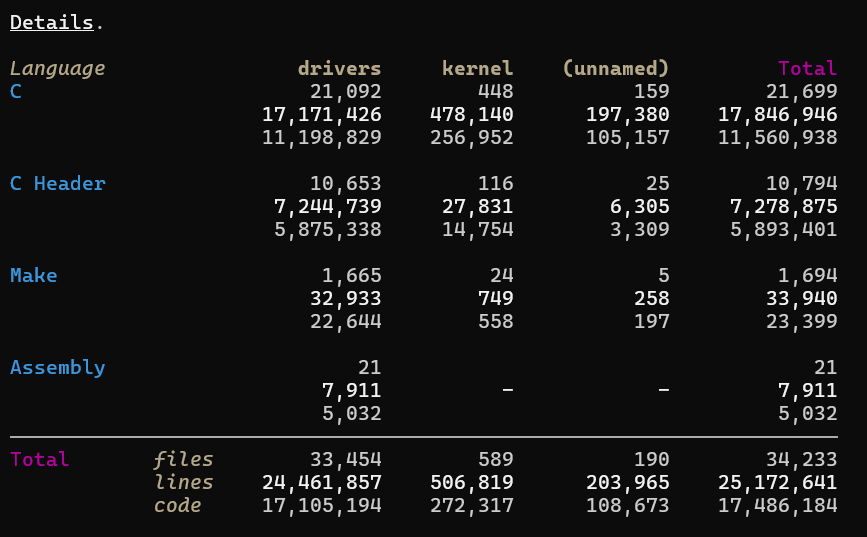
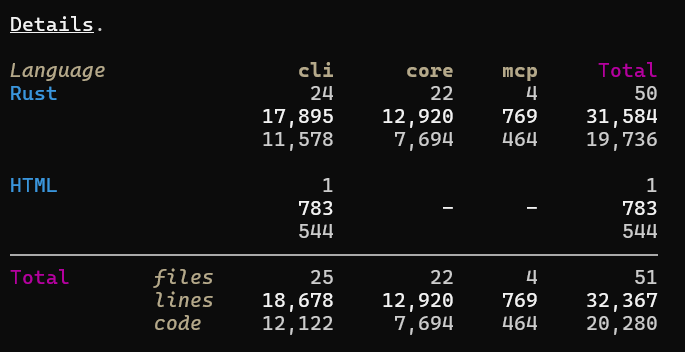
--layout matrix crosses them instead, languages down and modules across, one figure per cell.
The full rules (glob patterns, repeated names, ordering) are under --targets in
COMMANDS.md.
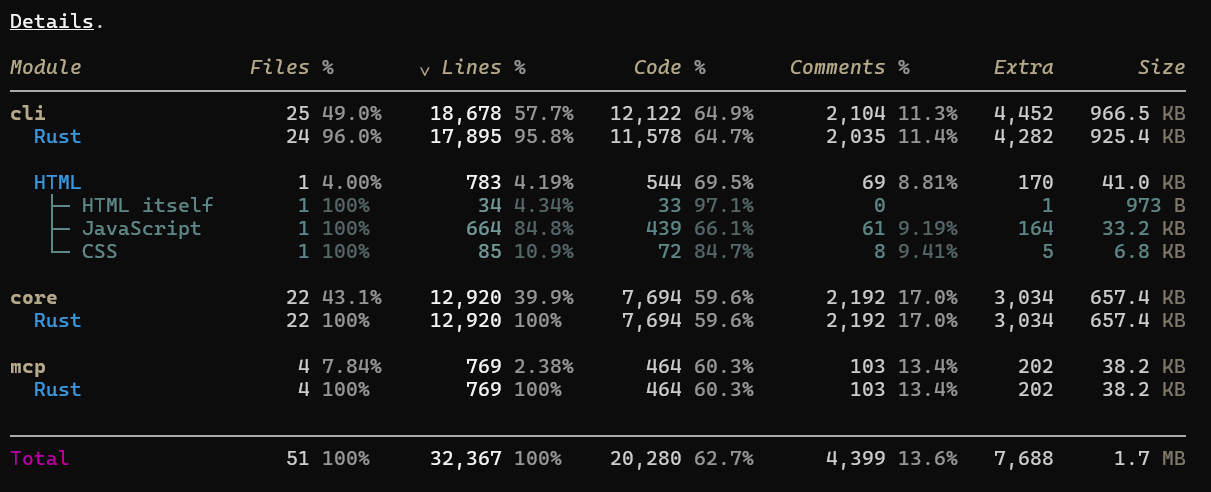
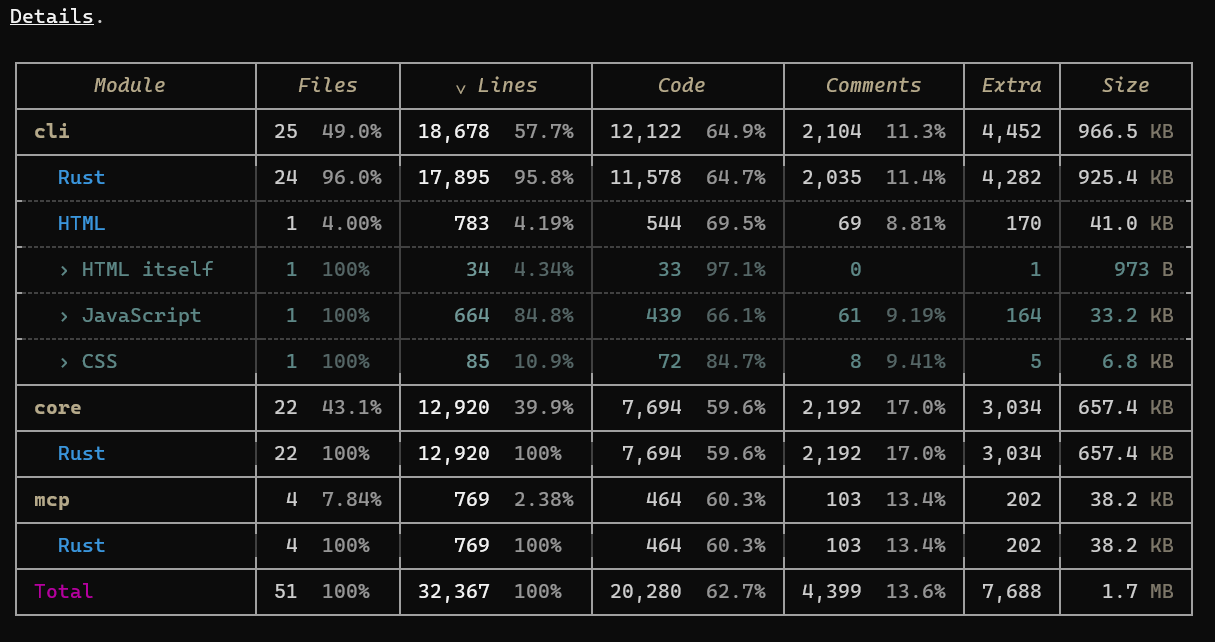
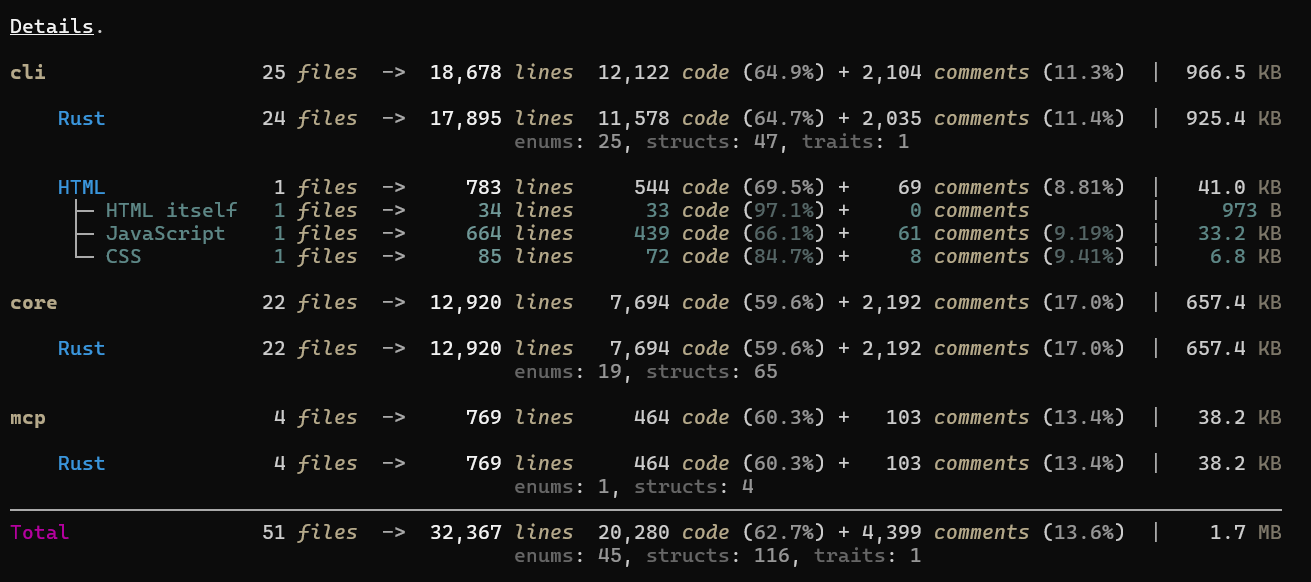
The details section comes in four shapes. table is the default and boxed draws the same figures
inside a frame, both of them aligned so a column can be read down. list gives each language a
sentence instead, reading left to right, and matrix answers a different question, languages down
and modules across.
The four layouts on the same run
--layout table
--layout boxed
--layout list
--layout matrix
--hide takes any part of the output away, whole sections or single columns, and --sort, --top
and --by-file decide what the rows are and in what order. They are all listed in
COMMANDS.md.
By default, mezura asks what a line says, not which block it sits inside. A blank line inside a
block comment is not a comment, because it documents nothing. A line holding only } or ); is
neither code nor comment, because it carries no data and no instruction: those are tokens the
language demands, placed wherever your style puts them, and whether the brace goes on its own line
is not a fact about how much code you wrote.
So under this model code and comments do not add up to lines. What is left over is grouped as
extra, and it is the part of the file that carries nothing. This is the default, and it can be
asked for explicitly with --counting content.
Counters that group by region answer the other question, "which block is this line inside", and
give the blank line to the comment and the brace to the code. Neither reading is wrong, they answer
different questions, and it is worth knowing which one you are reading. For the more conventional
region-based counting, run mezura --counting region.
Files and folders named in a .gitignore, .ignore or .rgignore are skipped (see --no-gitignore
and --no-ignore-files). Directories whose name starts with a dot are skipped unless
--search-in-dotted is given, and .git is never traversed at all.
Three checks on a file's head can also set it aside, each reported above the table with its own
count: minified (an average line of 1000 bytes or more), generated (a marker like do not edit or
@generated in the first 512 bytes), and not code at all (give-away text listed per extension in
language_conflicts.txt, the way a .d dependency file is not the D language and a ProGuard
.pro is not Prolog). Each check has its own flag that turns it off: --count-minified,
--count-generated, --count-not-code. The not-code check is also off under --no-heuristics.
--show-skipped prints the paths, and --explain on such a file says which check set it aside.
The reasoning behind the tests is in Accuracy and limitations.
A path you write out yourself is always counted, even if it is ignored, dotted, a link, minified, generated or not code. The matches of a glob pattern were found by mezura rather than named by you, so those are skipped like any other found path.
--output markdown prints the details as a markdown table, for a build step to leave in a pull request or a job summary.
mezura ./src --diff origin/main --output markdown >> $GITHUB_STEP_SUMMARY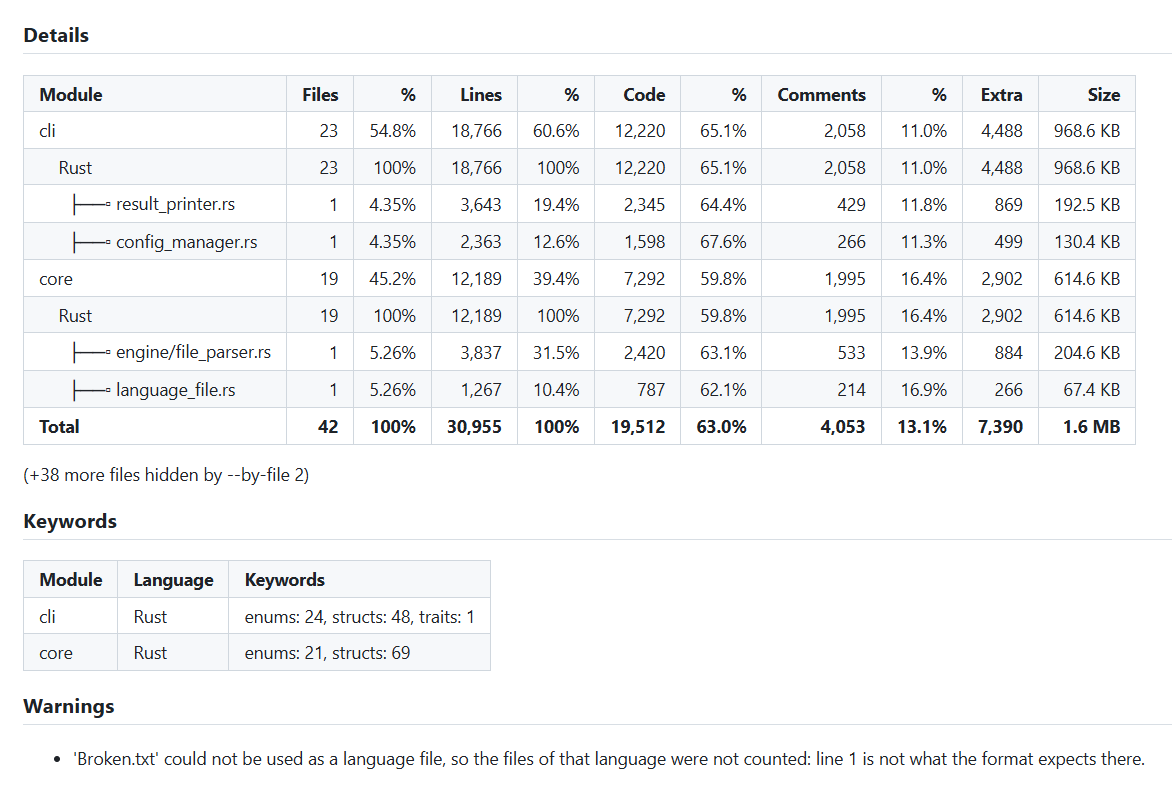
The modules, the languages under them and the changed files under those are all rows of the one table, at the depth the printed report draws them at.
It is the report and not a document of its own, so --hide, --sort and --top cut and order it exactly as they do the printed one, and --by-file hangs the changed files under each language. Markdown has one table shape, so --layout has nothing to choose between and is ignored, and the colours, the overview bar and the history section are left out, all three being terminal drawings.
A warning that puts the numbers in doubt, an unreadable language file among them, is written under the table as well as to the error output, since whoever reads the page is the one deciding on those numbers. The ones that only report an ignored setting stay on the error output alone, where the build log keeps them.
Counting a git revision needs the full history, so a workflow doing the above wants fetch-depth: 0 on its checkout.
--output json writes a single JSON document instead of the printed report, so that a build step, or another program can read a run easier. Everything that is not the document itself,
warnings included, goes to the error output, so mezura ./src --output json > stats.json leaves a file
that a parser accepts. The same holds for --explain --output json, where the document answers for
one file with one verdict per line. The document is written even when there was nothing to count, and even when
every file failed to parse: a consumer never has to tell "no output" apart from "no code found", and
a run that failed says so in the document instead of leaving an empty file.
mezura ./src --output json | jq '.total.code'
mezura ./src --output json | jq -r '.languages[] | "\(.name) \(.lines)"'
scope echoes
the settings that can change a number, so that two documents are not compared when one of them was
produced with a different --exclude or --counting. Every total, language, section and file row
also carries a classes block holding the nine raw per-line counts both counting models fold from,
so a consumer can compute either model whatever the scope names. format is the version of the
document itself, separate from mezura_version, and it only moves when a key is removed or changes
meaning, so a parser can check that one and ignore which build wrote the file.
faulty_files names every file that was found and could not be parsed, and unreadable_dirs every
directory the scan could not open, whose whole contents are therefore missing from every number in
the document.
warnings carries what the run said on the error output, which whoever reads the document never
sees. Each entry has a code that is safe to branch on, a message that is safe to show and free to
be reworded, the subject it is about, and an affects of counts or settings. That last one is
the useful question: an unreadable language file means a whole language went uncounted, while a
setting that was ignored leaves every number intact, and a consumer can gate on it without keeping a
list of every code that exists.
mezura ./src --output json | jq -e '[.warnings[] | select(.affects == "counts")] | length == 0'Exit codes. 0 means mezura ran and told you what it found, including when it found nothing, because zero is an answer. 1 means the run failed: a mistake in what was asked for, a name that does not exist, a set of files where every one of them failed to be parsed, or a scan that found nothing after failing to open a directory, since that zero is not a count of anything. The failing cases still write the whole JSON document, faulty files and unreadable directories included, so the failure can be read and not only detected.
mezura-mcp is a second, separate binary that lets a coding assistant run mezura on its own.
Install it beside mezura:
cargo install mezura-mcpThen add it to whichever file your editor keeps its servers in:
{
  "mcpServers": {
    "mezura": { "command": "mezura-mcp" }
  }
}
It runs the mezura binary rather than counting anything itself, so mezura has to be installed too.
It looks for it next to itself first, then on the path. If it lives somewhere else, name it:
{
  "mcpServers": {
    "mezura": { "command": "mezura-mcp", "env": { "MEZURA_BIN": "/opt/tools/mezura" } }
  }
}
Three tools are offered. count_lines_of_code counts a directory or a file and answers with the
report, which is what to ask for when a person is going to read the answer. count_lines_of_code_as_json
answers with the JSON document instead, for when the numbers are going to be compared or added up.
explain_file goes through one file line by line and says why each line was counted the way it was,
which is what to reach for when a number looks wrong; it takes a range of lines, so a long file can
be asked about without the whole of it coming back.
Every
call starts mezura afresh, so nothing of one answer can leak into the next, and a project's own
.mezura settings apply exactly as they do on the command line. An answer too long to be read at
once is refused with what to ask instead, rather than handed over in full or cut in half.
The counting engine is a crate of its own, mezura-core,
so a program of yours can count a directory without shelling out to a binary and parsing what comes
back.
cargo add mezura-coreYou get the walk, the language identification, the per-line counting, the keywords and
explain_file, and both counting models out of a single run. You do not get the report: the
layouts, the colors and the themes live in the command line program and are not published. The
API documentation has the whole surface.
Inside the 'data/logs' folder, the program will save log files that correspond to saved
configurations every time --log is given. A log is a .jsonl file: one JSON entry per line, the
newest first, so it is read by any JSON tool one line at a time. Each entry records the settings the run was counted with
(the target directories, the counting model, and so on, so you can see if at some point the
configuration got modified).
A run that names its targets records its modules in the entry, and the history section then carries one narrow line per module: which of them grew, and by how much. A module that was not there last time, or that is not there any more, is named as such instead of being compared against nothing. An entry written by a run that named none has no such block.
By using the --compare <N> flag, the (N) previous logged executions will be retrieved from the
file and will be compared and printed to the screen. For example for N = 2, it would look like this:
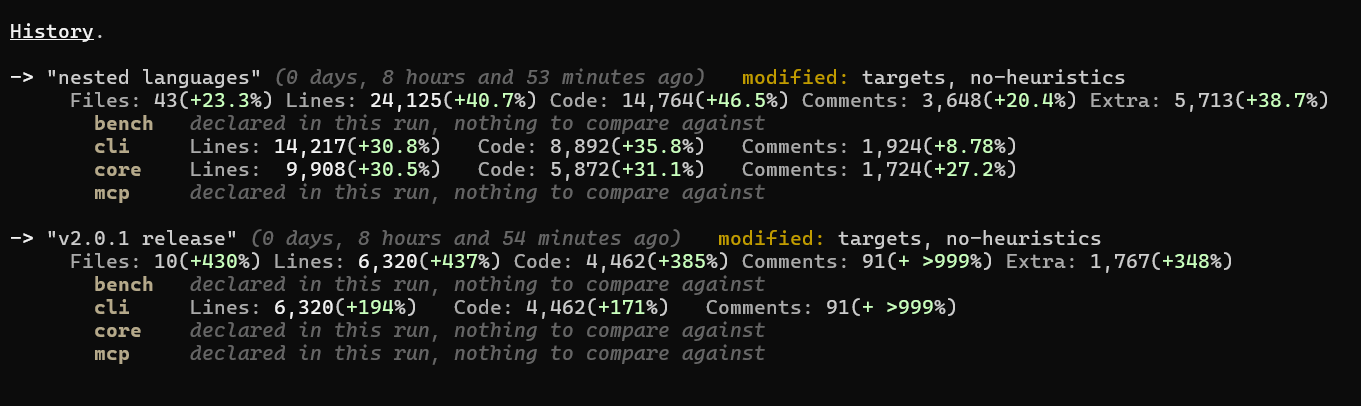
Both --log and --compare need a log to belong to, which means either a configuration loaded by
name or a project with a .mezura folder to be inside.
--diff shows what changed between two runs, in place of the report:
mezura ./src --output json > baseline.json
mezura ./src --diff baseline.json
mezura ./src --diff main
mezura ./src --diff v2.0.1..v3.0.0
A reading is either a JSON document an earlier run wrote, or a git revision, which is checked out to a temporary directory and counted on the spot with this run's settings and targets.
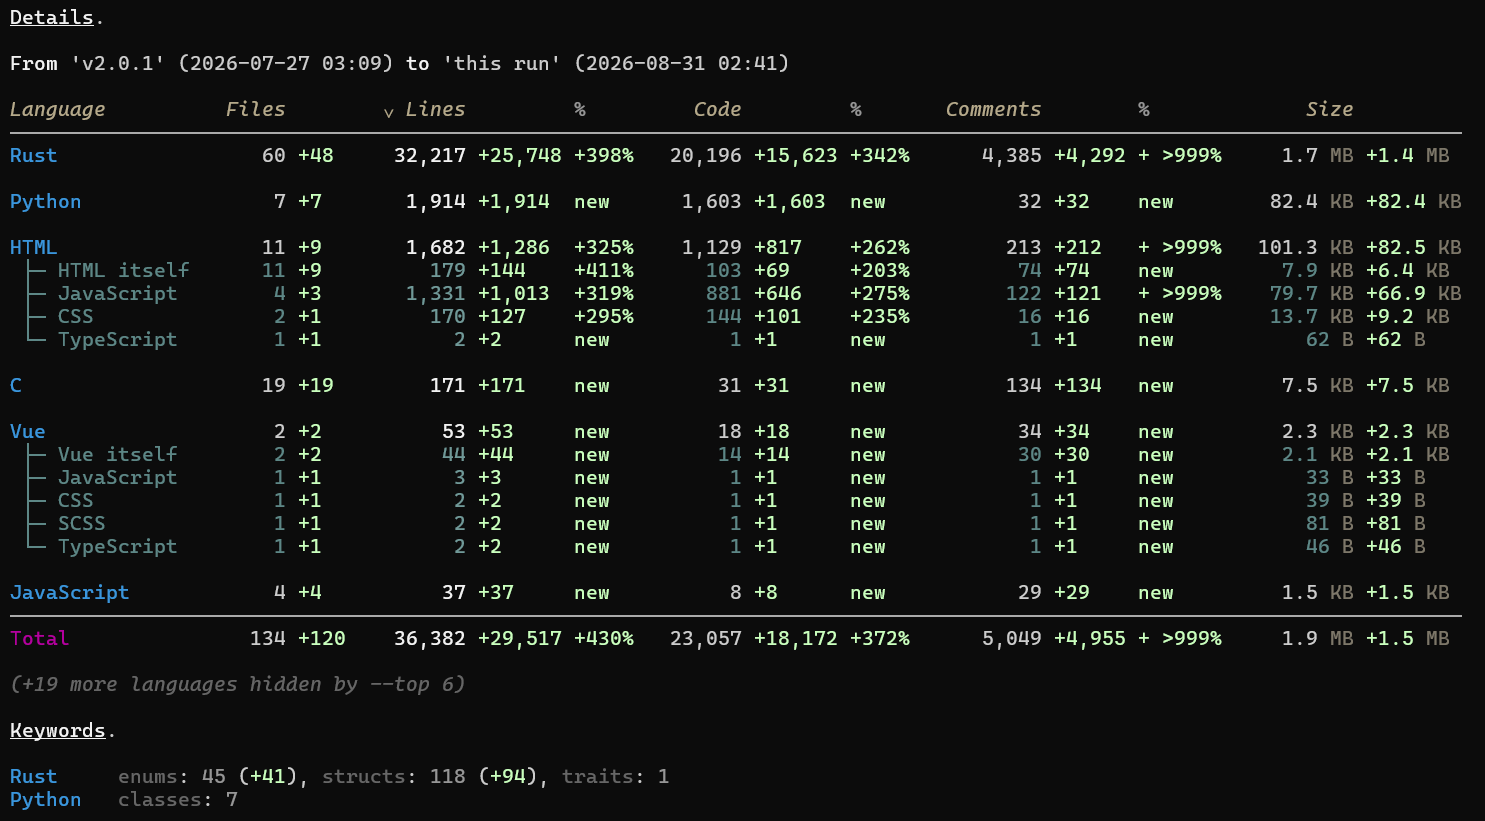
A language only one side has is marked new or gone, and a figure that did not move is a dash.
Add --by-file and the files that changed get rows of their own under each language, marked new
and gone the same way; a number keeps the biggest movers of each language instead of the biggest
files.
With --output json the comparison is a document of its own, every count carrying from, to and
change.
If you plan to run the program many times for a project, it can be bothersome to specify all the
flags every time, especially if they contain a lot of targets and exclude dirs. That's why you can
specify many flags in a configuration file, and have the program just load that file (see
--load).
Configurations can be created automatically by specifying all the flags once, along with the
command --save, and a name for the configuration. Then the program, along with its normal
execution, will automatically create a config file with the name you specified, and dump all the
flags in there. The next time you want to run the program on this project, you can do it like this:
mezura --load <config_name>
By default, there is a configuration file named "default" already present in the "config" folder of
your data directory, that gets loaded on every run. There, you can customize your preferences and they will
apply to all runs, unless overridden by giving a different command on the command line, or by
loading a specific configuration. For example, if you prefer the counting model of the other
counters, you can put a "===> counting" block holding "region" there. --no-default-config leaves that file
out of a single run, so the run answers with mezura's own defaults and counts the same on any machine.
If you want the config to live inside the project instead, so it can be shared through version control, put it in a .mezura folder beside the code:
your-project/
    .mezura/
        config.txt
        log.jsonl
    src/
config.txt is the same format a saved configuration has, and log.jsonl the same format a log has. Write the folder with mezura <flags> --save-local, or by hand.
It is found without being asked for. A run looks for the folder in the directory holding its targets and then in each directory above it, taking the nearest one, so it applies from anywhere inside the project and a project nested in another one shadows it. A run using one says so, naming the file it read. Ignore it for one run with --no-local, and note that a run naming a configuration with --load leaves it out entirely.
It is safe to commit. Its targets are written relative to the folder, so it names the same places on somebody else's disk. And anything it does not set falls back to mezura's own defaults instead of each person's default.txt, for everything that decides a number, so two people get one answer. The theme, the layout and the separators still come from the personal config, since there the point is that everyone has their own.
The priorities of the specified flags are:
- cmd
- Specific config file
- The project's own config file (only when no config file is loaded by name)
- Default config file
- Internal defaults
There is a "data" folder in the repository, that contains some already provided language files, themes and the default configuration file. The program, at compile time, includes the "data" folder in the binary, and during the first execution, it saves it with the same structure in a persistent path, inside the user's computer, according to the platform's specification. More specifically, the paths per operating system are:
    Windows:  %APPDATA%\mezura\data
    Linux:    /home/$USER/.local/share/mezura
    MacOs:    /Users/$USER/Library/Application Support/mezura
The languages, themes, configurations and logs are then read from those folders, on that first execution as much as on every one after it, so you can reach them and change them: add languages of your own, add themes, or edit the default configuration.
Set MEZURA_DATA_DIR and that folder is used instead, created and filled on the first run there
exactly as the usual one was. It is what you need when two versions of mezura have to run on the
same machine without treading on each other, since each one rewrites the shared folder into the
shape it expects. A run using it says so, every time, because a variable set once and forgotten
hides every configuration and theme you saved.
Installing a new version updates the language files there, so a correction to a language reaches
you without you having to do anything. One that you changed yourself is replaced too, since a
language file that has fallen behind counts wrongly, but your copy is kept under
data/replaced/<version>/<date and time>/ and the program names it, so you can carry your changes
over. Each update or --restore writes its own folder there, so two of them never mix and the
newest is the one at the bottom. A language file of your own is never touched, and neither are your
themes or your default configuration: those are written when they are absent and left alone
afterwards. A language_conflicts.txt you have not edited is brought whole to each new version;
an edited one is merged, with your lines kept and your file as it stood saved under replaced.
Everything the program prints can be styled: 78 tokens, each taking a text color, a background color, and any of bold, italic, underline, dim and reverse. Colors are hex values or one of the 16 standard terminal color names, which follow the color scheme of your terminal. You can set just the background and leave the text to the terminal, or the other way round. The live progress bar can also take a gradient between two colors, or a rainbow. Run --help --style for the full list of tokens.
A theme is a plain .txt file of token = value lines, in the "themes" folder of your data directory. It carries only how the output looks, never what is measured, so it can be shared as it is. Apply one with --theme <name>, list the ones you have with --show-themes, and write the current look into a new one with --save-theme <name>.
13 themes are bundled. Mezura is the default look. Catppuccin, Dracula, Forest, Gruvbox, Meadow and Ocean come in two versions each: the plain name dresses the whole report, headings, labels, sub-rows and all, while the -minimal one changes the colors and little else. Edit them, or add your own by dropping a file there.
--show-themes previews each of them on the same figures, which is where these three come from:
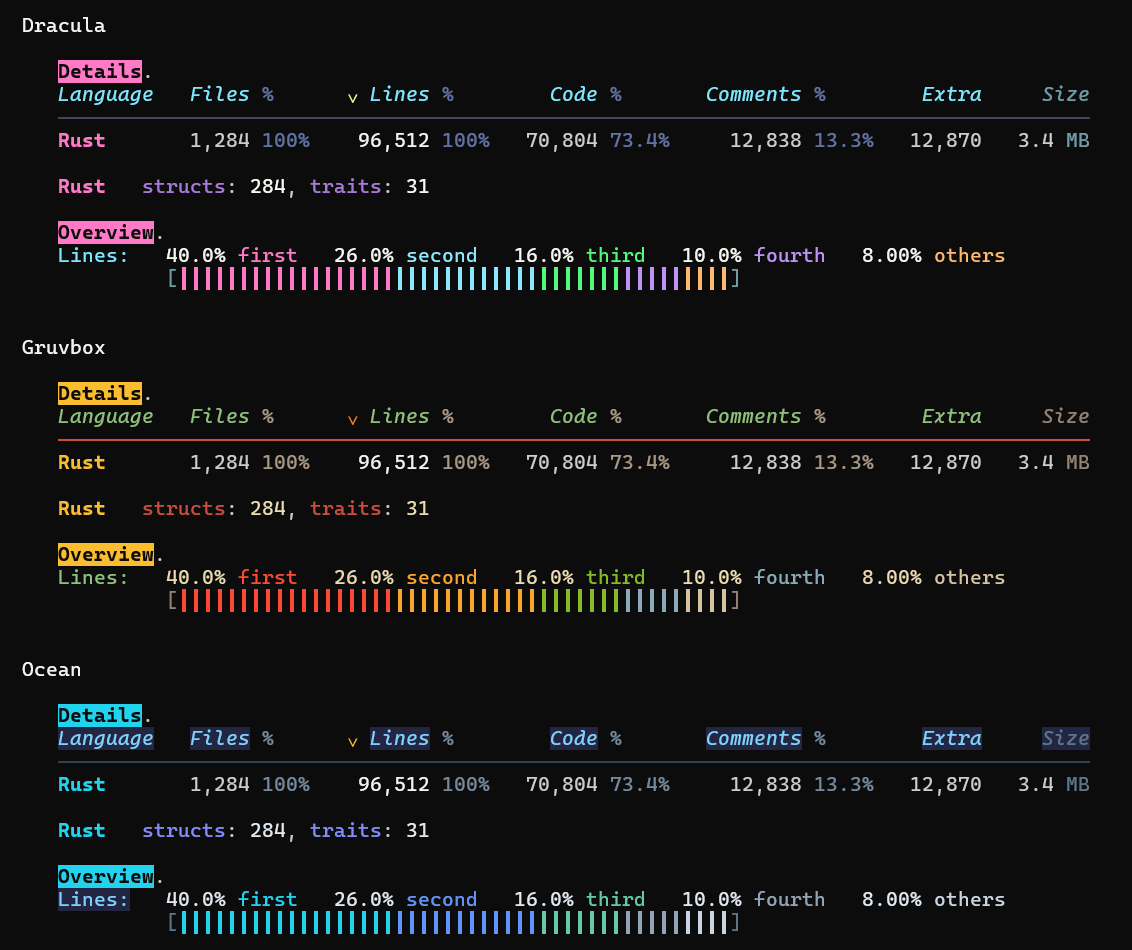
The four languages of the overview and the folded 'others' entry are five ordinary tokens, language-1 to language-4 and language-others, so a theme sets them the same way it sets everything else.
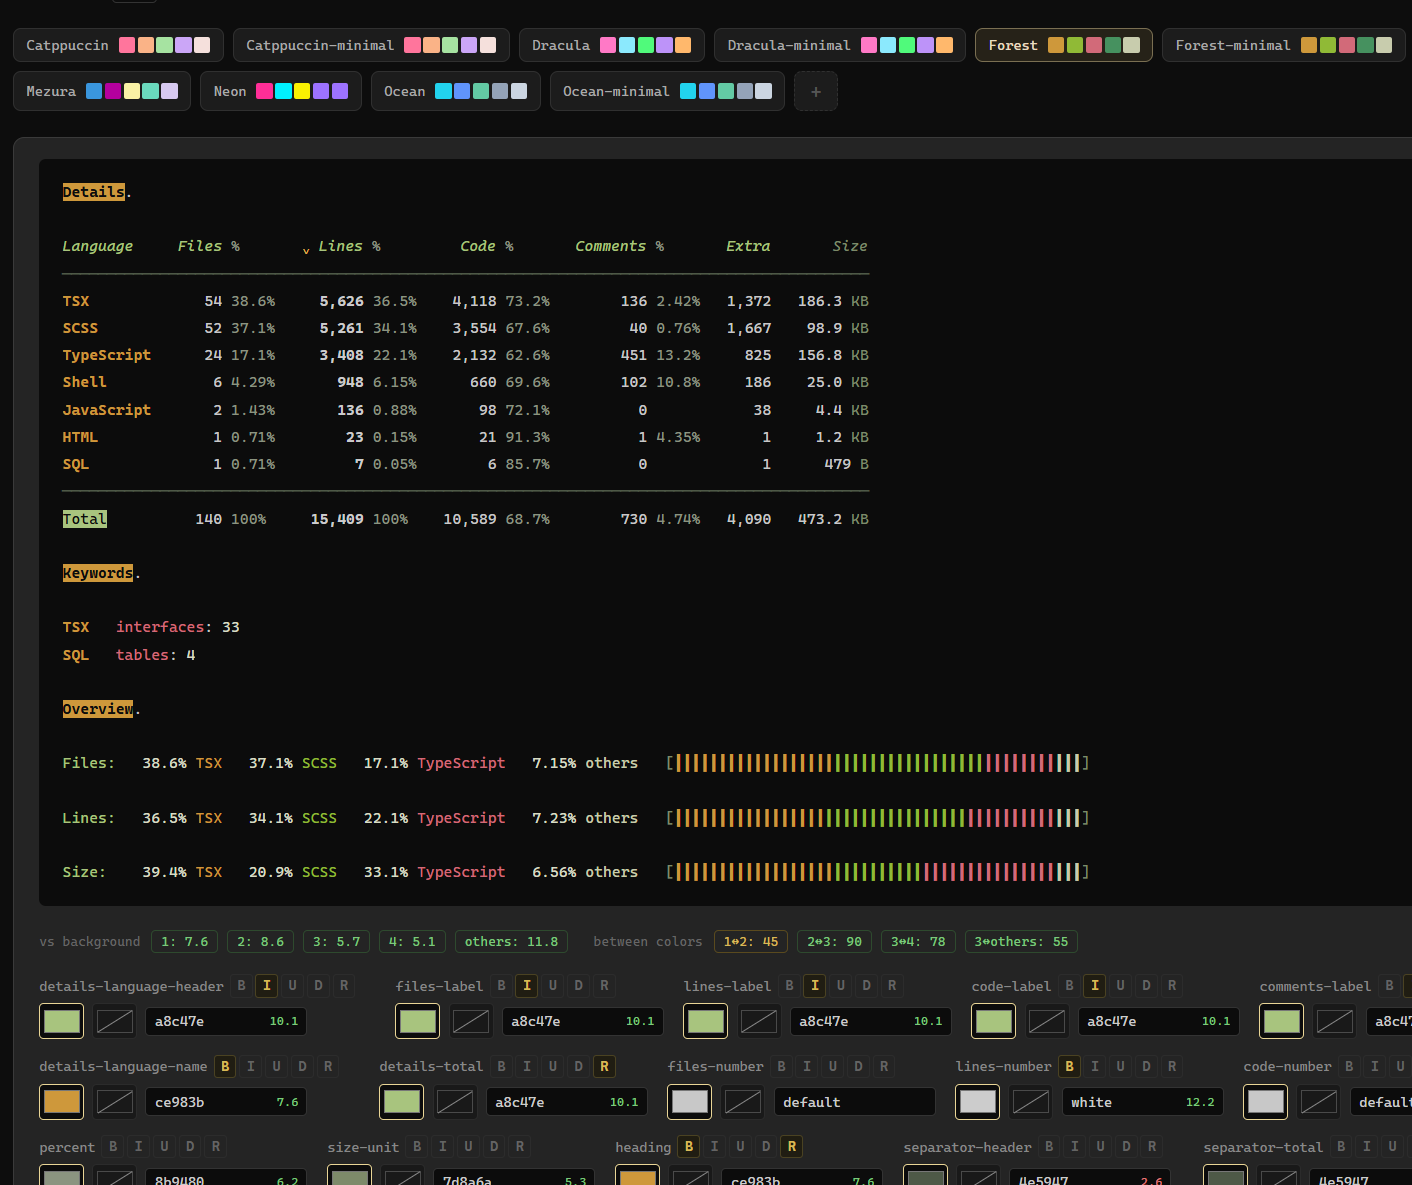
To make authoring one easier, there is an interactive editor: one run of mezura with a picker for every token that draws it, its color, its background and its attributes, contrast readings beside them, and a button that hands back the lines of a theme file.
Open the theme editor online to play with the bundled themes, or run mezura --theme-editor to open it with the themes found on your own machine, including the ones you created.
Mezura ships with over eighty languages, which realistically will contain any real language you will ever use. Still, this number is considerably smaller than the 200+ languages supported by some other counters, and most of the difference is what gets called a language: their lists carry JSON, XML, SVG, Markdown and plain text, which are not code, and a report that counts those is answering a different question than the one you asked. The rest of the difference is that an extension is only worth claiming when the files carrying it really are that language, which has a separate answer for each extension rather than one answer per language: on GitHub, 91 of every hundred .pl files are Perl, and 1 of every hundred .pro files is actually Prolog. A language you are missing is easy to add yourself (see below), and if you think an important one is missing for everyone, open an issue or a PR.
All the supported languages can be found in the data directory. Every language is a text file that can be inspected and even modified, and you can easily expand the collection of languages with your own definitions, by adding more text in files there. --show-languages prints them all with the extensions each one claims, and puts a star on an extension that another language holds.
If two or more language files claim the same extension, each file of it is identified by its own content: a #! line first, then the evidence the language files declare, so a .m opening with @interface counts as Objective-C, one opening with function counts as MATLAB, and one opening with :- module counts as Mercury. A file whose content says nothing falls back to the winner named in the language_conflicts.txt file of the data dir, which ships with an answer for every contest between the languages that come with the program. An extension that nobody has named there goes to the language that comes first alphabetically, and the program reports it, since that is a tie-break and not a decision. --force-language overrides all of it for a single run, or through a configuration file for a single project. It can also answer differently per module in the same run, so mezura ios=./ios analysis=./matlab --force-language ios/m=objective-c,analysis/m=matlab counts one repository's .m files as Objective-C in one folder and as MATLAB in the other.
A file with no extension at all is named by the same #! line, so a script called configure is counted as the language that line names, and a whole file name a language claims, like Makefile, is answered before either. --no-shebang turns that first line off everywhere, which is how a run is made comparable with a counter that only knows extensions: files with no extension go uncounted and are never opened, and a contested extension is settled without it.
Language choices is the short page behind those answers: which language gets each contested extension, and which files are left out of the count.
The language files guide is a page of its own: a whole language file to copy, every block with an example, which of the five string blocks a symbol belongs in, and the two mistakes that cost people the most time.
The program is able to understand and parse correctly arbitrarily complex code structures with intertwined strings and comments. This way it can identify if a line contains something other than a comment, even if the comment is partitioned in multiple positions and it can identify valid keywords, that are not inside strings or comments.
For example in a line like /*class"*/" class" aclass, it will not count "class" as a keyword since the first is inside a comment, the second inside a string and the third has a prefix.
Additionally:
-
It checks for escaped characters, for example
/"will not be counted as a string symbol -
It resolves symbols that are side by side, for example
*/*is normally identified as both a closing and an opening comment symbol, but the program will understand the correct usage. -
A language that writes comments in more than one way gets all of them, and each one ends only with its own closing symbol. Pascal writes
{ }and(* *), D writes/* */and/+ +/, and a stray*)inside a{ }comment is just text. -
A comment written inside another comment does not end it early. This is how OCaml, Rust, Haskell, F#, Scala, Kotlin, Swift, Julia, Elm, Lisp, Scheme, MATLAB and WebAssembly text read their own code, so commenting out a block that already had comments in it counts as the comment it is. In C and the languages that follow it the first
*/really does end the comment, and that is what the program does there. -
Lua's
--[==[comments are read to their real end, so a]]written inside one is text. -
A comment that ends and another that begins on the same line (
]]--[[in Lua,--><!--in HTML) are read as two comments. -
Strings are read with the same care. A quote left open by mistake costs its own line instead of everything below it, a Python docstring or a JavaScript backtick still runs for as many lines as it likes, and the raw forms that end with a different symbol than they started with, like Rust's
r#"..."#or C#'s@"...", end where the language says they do even when they finish with a backslash.
All of this is measured against the LineJudge conformance suite, once per counting model:
--counting content --counting region

With that said, it is important to mention the following limitations:
-
Another language inside a file is only found where its opening tag sits on one line, the way
<script>and<style>do. Languages that interleave mid-line are outside that: the<?php ?>of PHP and the ERB, JSP and Blade family are read as one language from beginning to end. An opening tag split over two lines stays with the file's own language. A section fenced by something that is not a tag is outside it too: the---frontmatter at the top of an Astro file holds TypeScript, and its//lines are counted as code rather than as comments. The<script>and<style>blocks of the same file are read as the languages they hold, as they are in Vue and Svelte. -
Keywords are counted as words, not as meaning. Every
classin code is counted, whatever it means there. -
Hard links count twice. Symbolic links and nested targets are dropped, but a hard link is indistinguishable from an ordinary file.
-
A string delimiter invented on the spot cannot be declared: heredocs, Rust's
r##"..."##past one hash, Lua's[=[ ]=]past the plain form. mezura keeps counting quotes inside them, so one apostrophe looks like a string opening. In languages whose strings may cross lines (Rust, Ruby, the shells, PHP, SQL) that runs on until the next quote. -
A comment opener inside a regex literal, like the
/*in/a[/*]b/, opens a comment. A regex inside a string is fine. -
Case is ignored in extensions, so the Unix convention where
.Cis C++ and.cis C is lost. -
=*in a comment symbol means "any number of=", so a language whose symbol really contained=*could not be declared. None is known. -
Two languages claiming one extension is settled per file, by a
#!line or by evidence the language files declare, and only the files whose content says nothing follow the standing order oflanguage_conflicts.txt, parsed with that winner's symbols.--force-languagedecides outright,--no-heuristicsturns the content reading off, and--no-shebangtakes the#!line out of the whole business, the naming of files that carry no extension included.
Against scc and tokei, the two fastest counters around, on the Linux repository tree, measured with linebench over 3 warmups and 30 timed runs per command, in both command orders.
On native Debian 13:
| tool | time | vs fastest | lines/s | files | lines |
|---|---|---|---|---|---|
| mezura 3.1.1 | 166 ms ± 12 | 1.00x | 216.8M | 63,738 | 36,018,801 |
| scc 4.1.0 | 210 ms ± 3 | 1.26x | 171.4M | 63,738 | 36,018,801 |
| tokei 15.0.0 | 414 ms ± 2 | 2.50x | 86.9M | 63,793 | 36,027,518 |
On Windows 11, the same machine and the same tree:
| tool | time | vs fastest | lines/s | files | lines |
|---|---|---|---|---|---|
| mezura 3.1.1 | 254 ms ± 22 | 1.00x | 141.6M | 63,767 | 36,017,775 |
| scc 4.1.0 | 539 ms ± 61 | 2.12x | 66.8M | 63,767 | 36,017,775 |
| tokei 15.0.0 | 632 ms ± 22 | 2.48x | 57.0M | 63,822 | 36,026,522 |
The comparison is doing equal work: the same languages over the same tree for all three,
mezura pinned to the same counting model the other two use, the gitignore not taken into
consideration by anyone, and each tool's unique feature apart from counting turned off
(keyword counting for mezura, complexity and cost estimates for scc).
The files and lines columns are the proof of the equal work.
Measured on a Ryzen 7 9700X with 16 threads and a Lexar NQ790 PCIe gen4 NVMe disk.
The exact flags, the trust checks every run carries, the full methodology and the recorded numbers of each run for equal work and program defaults are on linebench's example run.
--threads <producers> <consumers> sets how many threads walk the directories and how many parse
the files. Without it both numbers are chosen from the machine, and the default asks for far more
consumers than cores on purpose: a consumer spends most of its life waiting for a file to open, so
the speed comes from how many reads are in flight, not from how many cores there are. Raising the
consumers is worth up to twice the speed on a slow disk, or on the first run after a reboot.
To see what a run actually spent its time on, set the environment variable MEZURA_PHASE_TIMING.
An empty value, 0, no, false and off mean off, the way RUST_BACKTRACE is read, and
anything else means on:
MEZURA_PHASE_TIMING=1 mezura <some_big_directory>$env:MEZURA_PHASE_TIMING = "1"; mezura <some_big_directory>The report goes to the error output:
[startup]: everything before the counting begins, step by step (the arguments, finding the data directory, keeping it in step with the binary, the language files, the conflict rules, the configuration, which languages this run counts with)[phase]: how long the directory walk ran, how long the counting continued after it, and how many files were still queued when the walk ended[phase]: the share of the consumers' time spent starved (an empty queue while the walk was still running), opening, reading and parsing, with the milliseconds behind each, summed over every consumer thread, so the shares are the point[phase]: how many files and megabytes were read, and at what rate per thread[finish]: the counting, the printing, and the whole command
When there are more consumers than the machine has hardware threads, one more [phase] line says
so: the shares are of elapsed time, so a thread waiting for a core is counted in whatever phase it
was in, and a large "open" share can mean threads queued for a core with the disk idle.
A deep queue and little starvation mean the parsing is the constraint, and more consumers pay. An empty queue and heavy starvation mean the walk is the constraint. Measure with a release build on a large directory, or the numbers say nothing.
Opening a file is far more expensive on Windows than on Linux: every open walks the object manager, the security descriptor and the whole filter driver stack, which is where antivirus and other minifilters sit. Since mezura opens one file after another, this dominates: on Windows the program is I/O bound, and most of its time is spent waiting on File::open rather than counting anything. On Linux the same open is nearly free, and the run's cpu goes almost entirely into mezura's own work instead of the operating system's.
The practical consequence is that the same repository on the same machine is measurably faster to analyze from Linux (~1.5x speedup).
That baseline cost is structural and does not go away. What can be removed is what sits on top of it: because every open traverses the filter stack, real-time antivirus protection ends up inside mezura's hot path, inspecting each file as it is opened, and it multiplies an already expensive operation. Excluding mezura from that scanning makes a very big difference on the performance.
To exclude mezura from Windows Defender real-time scanning:
- Open PowerShell as Administrator
- Run:
Add-MpPreference -ExclusionProcess "mezura.exe"
- Restart your terminal
To remove the exclusion later:
Remove-MpPreference -ExclusionProcess "mezura.exe"Note: This is a common requirement for file-scanning tools (similar to build tools, IDEs, etc.). Only add this exclusion if you trust the source of the executable.
The exclusion is matched on the exact filename, so a copy you renamed to anything else does not have it, and on this machine that alone measured 1.28x on a large repository with byte-identical binaries. Worth knowing if you keep several builds around, or if you ever time one against another.
See CONTRIBUTING.md for how to get a change in.
Licensed under either of
- Apache License, Version 2.0 (LICENSE-APACHE or https://www.apache.org/licenses/LICENSE-2.0)
- MIT license (LICENSE-MIT or https://opensource.org/licenses/MIT)
at your option.
Any contribution intentionally submitted for inclusion in this work by you, as defined in the Apache-2.0 license, shall be dual licensed as above, without any additional terms or conditions.