
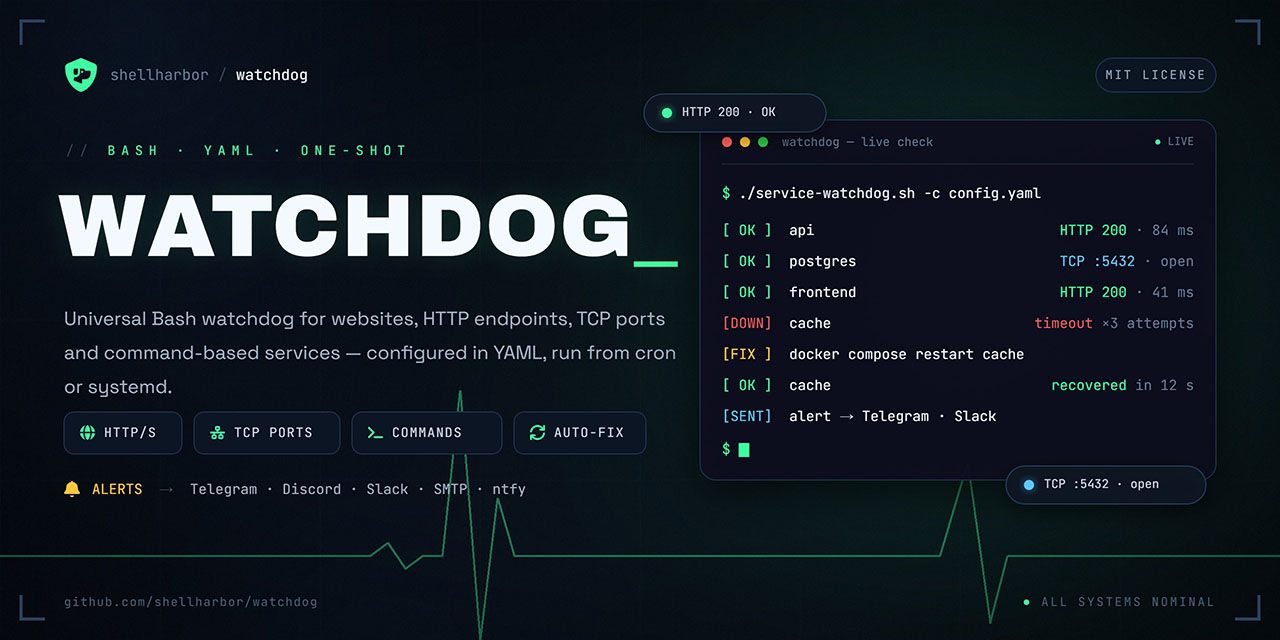


A small, dependency-light Bash watchdog for websites and services. It runs configured health checks and executes an explicit command sequence when a target stays unavailable after all retry attempts.
The watchdog is intentionally a one-shot program. Run it from a systemd timer, cron, or another scheduler.
For task-oriented guides and additional runnable examples, see the project Wiki.
- Contributing guide — development workflow and quality checks
- Security policy — private vulnerability reporting and secure deployment
- Code of Conduct — community standards and enforcement
- Support guide — documentation, issues, and safe troubleshooting
- Release guide — verified version and release workflow
- Changelog — user-visible release history
- OpenSSF Scorecard audit — verified findings, CI hardening, and remaining maintainer actions
- Fuzzing and release signatures — mutation targets, crash replay, and verification before installation
- HTTP/HTTPS checks with redirects, timeouts, response assertions, latency SLOs, and expected statuses
- TCP port checks using Bash
/dev/tcp - Optional DNS record checks and ICMP ping loss/latency checks
- Arbitrary command checks
- Opt-in disk-space checks with free GiB and percentage thresholds
- Opt-in TLS certificate expiry checks with SNI support and remaining-day thresholds
- Opt-in ClamAV and event-count threshold checks for security monitoring
- Ordered command and remote HTTP remediation without
eval - Per-service action cooldown
- Optional persistent flapping guard and exponential action backoff
- Dependency-ordered checks and separate liveness/readiness endpoints
- Bounded incident history, Prometheus textfile metrics with scheduler heartbeat, and opt-in action allowlist
- Ready Grafana dashboard and Prometheus/Alertmanager observability assets
- Optional per-check history, uptime reports, ASCII trends, and static observed-availability bars
- Optional health verification after remediation
- Failure and recovery hooks with environment variables
- Built-in SMTP email alerts with YAML-configured templates and recipients
- Telegram, Discord, Slack, ntfy, PagerDuty, and Opsgenie alerts
- Per-service notification routing, severity, and runbook context
- Persistent state and transition-only hooks
- Global non-blocking lock to prevent overlapping runs
- In-memory YAML lookup cache to avoid repeated parser processes during each run
- Dry-run and single-service modes
- Strict YAML validation and bounded command execution
- Linux and Bash 4.3 or newer
- Mike Farah
yqv4 curl,flock, GNUtimeout/coreutils (includingbase64), andunzipfor ZIP installationopensslonly when one or more services usecheck.type: tls_cert
On Debian or Ubuntu, install the system packages with:
sudo apt-get install bash curl util-linux coreutils unzipInstall yq v4 using its official package or release instructions. The Python
package with the same name is not compatible.
For example, on Ubuntu with Snap:
sudo snap install yq
yq --version # Must report Mike Farah yq version v4.x.xDownload the stable v1.7.9 source archive from GitHub:
curl -fL \
  https://github.com/shellharbor/watchdog/archive/refs/tags/v1.7.9.zip \
  -o watchdog.zip
unzip watchdog.zip
cd watchdog-1.7.9
Alternatively, clone the repository with Git:
git clone https://github.com/shellharbor/watchdog.git
cd watchdog
Install and configure the watchdog:
sudo install -d -m 0755 /opt/service-watchdog
sudo install -m 0755 service-watchdog.sh /opt/service-watchdog/
sudo install -m 0644 VERSION /opt/service-watchdog/
sudo install -m 0640 config.example.yaml /opt/service-watchdog/config.yaml
sudoedit /opt/service-watchdog/config.yaml
sudo /opt/service-watchdog/service-watchdog.sh -n
sudo /opt/service-watchdog/service-watchdog.sh
Or run sudo ./install.sh to verify dependencies, install the script and
example configuration, create runtime directories, install the systemd units,
and reload systemd. The installer preserves an existing configuration.
The optional shellharbor-watchdog Python distribution runs the same Bash
engine, not a rewritten monitor. It requires Python 3.11+ on Linux (including
WSL), Bash 4.3+, Mike Farah yq v4, curl, flock, and GNU coreutils. Native
installation, systemd, Docker, and Kubernetes do not gain a Python dependency.
Install the published v1.7.9 package from PyPI:
python3 -m venv .venv
.venv/bin/python -m pip install shellharbor-watchdog==1.7.9
.venv/bin/python -m shellharbor_watchdog --version
.venv/bin/python -m shellharbor_watchdog validate -c /etc/watchdog/config.yaml
.venv/bin/shellharbor-watchdog status -c /etc/watchdog/config.yaml --json
.venv/bin/shellharbor-watchdog-discover --help
For local development, use pip install . from this checkout instead. Do
not install the unrelated watchdog filesystem-event package. Publication
uses a separate manually approved GitHub Actions workflow with Trusted
Publishing; local builds and GitHub releases do not upload to PyPI.
The Python launchers forward the existing CLI arguments literally and replace
themselves with Bash, retaining signals, standard streams, and exit codes
0 / 1 / 2. Set WATCHDOG_CONFIG or pass -c; otherwise they look for
config.yaml in the caller's current directory. They never write configuration
or state into the installed package, install OS dependencies, or create a timer.
Use an explicit config and absolute launcher path in a scheduler.
See the Python package guide for installation,
examples, tests, and manual TestPyPI/PyPI Trusted Publishing. A safe first
configuration is available in examples/python-package.yaml.
The verified production publication includes wheel/sdist hash checks, publisher-attestation identity checks, and clean Linux installation/runtime tests. The earlier TestPyPI trial remains separate; do not use the test index for production deployment.
Docker is an additional deployment option, not a replacement for the native
single-file, cron, or systemd installation. The production image is built from
packaging/docker/Dockerfile; the root
Dockerfile belongs only to the GitHub Marketplace validation
Action described below.
Release images are published to GitHub Container Registry as
ghcr.io/shellharbor/watchdog. The official Docker Hub mirror is
shellharbor/watchdog.
Pin a complete release tag in production:
docker pull ghcr.io/shellharbor/watchdog:<version>
# Or pull the same image from Docker Hub.
docker pull shellharbor/watchdog:<version>
docker build --file packaging/docker/Dockerfile --target runtime \
  --tag watchdog:local .
The container is a one-shot job. Its exit code is the monitoring result: 0
means the selected targets were healthy, 1 represents an unavailable target
or attempted remediation, and 2 is a Watchdog configuration or runtime
error. It does not run a scheduler or background daemon. Schedule
docker compose run --rm watchdog with the host scheduler if a container-only
deployment is desired.
Start with the supplied configuration and Compose files:
cp packaging/docker/config.example.yaml config.yaml
mkdir -p state
# On a Linux host, give the non-root image user write access to persisted data.
sudo chown -R 10001:10001 state

# Replace the illustrative URL in config.yaml, then validate without checks.
docker compose -f docker-compose.example.yml run --rm watchdog validate

# Run one monitoring cycle.
docker compose -f docker-compose.example.yml run --rm watchdog
The Compose example mounts only a read-only configuration file and a writable
./state volume. Its example configuration keeps state and the operational log
under /var/lib/watchdog; enable history, metrics, or a generated status page
only on paths mounted deliberately for those outputs. The container root
filesystem is read-only, it runs as UID/GID 10001, drops all Linux
capabilities, uses no-new-privileges, and has a small writable /tmp tmpfs.
It does not use privileged mode, host networking, host filesystem mounts, or a
Docker socket by default.
Container checks observe the container network and only the filesystems that
you mount. In particular, a disk check does not report host disk capacity
unless the relevant host filesystem is explicitly mounted read-only, and a
127.0.0.1 target means the Watchdog container itself—not the host. Host
systemctl commands are unavailable; Docker CLI remediation requires the
separate socket profile below. A ClamAV check also needs a deliberate readable
scan path and current virus definitions; they are not baked into the image.
Keep notification credentials outside YAML and the image. For an ad-hoc run,
use a protected environment file containing only the variables named by the
configuration's *_env fields:
docker run --rm \
  --env-file /etc/watchdog/notification.env \
  --volume "$PWD/config.yaml:/etc/watchdog/config.yaml:ro" \
  --volume "$PWD/state:/var/lib/watchdog" \
  ghcr.io/shellharbor/watchdog:<version> notify-test --channel all
For Compose scheduling, add the same protected file through a local,
uncommitted Compose override (env_file:), or inject those variables through
the host scheduler's secret mechanism. Never pass a token or password as an
image build argument, label, command argument, or committed YAML value.
A host cron entry can trigger the job every minute without keeping a monitor daemon alive:
* * * * * cd /srv/watchdog && /usr/bin/docker compose -f docker-compose.example.yml run --rm --no-deps watchdogThe image health check runs validate against the mounted configuration. It
confirms that the Watchdog binary, configuration, and required dependencies are
usable, but deliberately does not indicate whether the monitored services
are healthy. Use the exit code from each scheduled run and Watchdog's alerts,
metrics, and status command for target health.
ENTRYPOINT forwards stop signals through Watchdog and its check subprocesses, then
waits for the normal cleanup trap so docker stop retains Watchdog's exit-code
contract.
The container contract for a future external scheduler or agent is intentionally
small: mount a readable config at /etc/watchdog/config.yaml (or set
WATCHDOG_CONFIG), mount the required output paths, supply secrets as
environment variables, invoke a single command, and consume its exit code.
The default image intentionally does not include the Docker CLI and the default
Compose service never mounts /var/run/docker.sock. If—and only if—configured
remediation commands need to control the host Docker daemon, use the separate
-docker image and explicit profile:
export WATCHDOG_DOCKER_GID="$(stat -c '%g' /var/run/docker.sock)"
docker compose -f docker-compose.example.yml \
  --profile docker-actions run --rm watchdog-docker-actions
Give that profile a dedicated, reviewed config such as config-docker.yaml.
Docker socket access effectively grants control of the host Docker daemon and
can lead to host-level compromise; it is not made safe by running the container
as a non-root UID. Prefer remote HTTP remediation or narrowly scoped host
automation when possible.
The Publish Watchdog container images workflow runs for a published GitHub
Release, or manually for an existing release tag that already contains this
distribution after it verifies that the tag matches VERSION. It
publishes multi-platform (linux/amd64 and linux/arm64) images to GHCR with
full, minor, and major semantic-version tags.
latest (and latest-docker) is updated only for a release that GitHub does
not mark as a prerelease. The Docker-enabled variant uses the same tags with a
-docker suffix.
The workflow adds OCI source/version/revision labels and attaches BuildKit
provenance and an SBOM. Docker Hub is optional: set repository secrets
DOCKERHUB_USERNAME and DOCKERHUB_TOKEN to publish the same tags under
docker.io/<username>/watchdog; without both secrets its job is skipped while
GHCR publication continues. Make the first GHCR package public in GitHub's
package settings if it should be anonymously pullable.
Watchdog is a finite monitoring cycle, so Kubernetes support uses a Helm 3
CronJob rather than a long-running Deployment. The chart supports Kubernetes
1.31+ and starts with its schedule suspended. It creates a ConfigMap from the
same Watchdog YAML, mounts persistent state by default, and runs the existing
non-root production image. A Job's completion and its 0/1/2 exit code are
the health signals; Kubernetes does not use the image's Docker HEALTHCHECK.
Install it in the namespace that owns the state PVC. Copy the safe starting values, replace the endpoint, choose storage, and validate before enabling the schedule:
cp examples/kubernetes/values.yaml values.yaml
helm lint charts/watchdog --strict -f values.yaml
helm upgrade --install watchdog ./charts/watchdog -n monitoring -f values.yaml \
  --set manual.enabled=true

# The optional Job runs `validate` with the mounted configuration.
kubectl -n monitoring wait --for=condition=complete job/watchdog-watchdog-validate --timeout=10m
kubectl -n monitoring logs job/watchdog-watchdog-validate
Disable manual.enabled after the completed Job, run one actual CronJob-derived
cycle, then set schedule.suspend: false only after that cycle succeeds.
Persistent state is important: it retains failure/recovery transitions and the
existing lock between CronJob Pods. The chart creates a retained state PVC by
default; set state.existingClaim to use an operator-owned PVC, or disable
persistence only when losing transition continuity is acceptable. Production
deployments should pin image.digest after verifying the desired published
image.
The chart never creates Kubernetes Secrets. Use the normal Watchdog *_env
fields in config, create a Secret outside Helm, then set envFromSecret to
its name. It creates no RBAC resources, disables service-account token mounts,
and permits no host paths, host networking, privileged containers, Docker
socket, or Docker CLI profile. It cannot execute host systemctl or Docker
remediation; prefer remote HTTP remediation or Kubernetes-native automation.
See the Kubernetes deployment guide for the
full storage, Secret, scheduling, upgrade, and rollback procedure.
Use the bundled Docker Action to run the same read-only validate command in
pull requests before deployment. It includes Bash, Mike Farah yq v4, and the
optional Watchdog check tools; it does not run checks, remediation, hooks, or
notifications, and it never creates Watchdog state.
name: Validate Watchdog configuration

on: [pull_request, push]

permissions:
  contents: read

jobs:
  validate:
    runs-on: ubuntu-latest
    steps:
      - uses: actions/checkout@v7
      - uses: shellharbor/watchdog@v1
        with:
          config: monitoring/watchdog.yaml
config is relative to the checked-out workspace and cannot escape it. The
action exits 0 for a valid configuration and 2 with a field-specific error
otherwise. If enforce-mode remediation refers to executables that exist only on
the production host, validate that policy there as part of deployment too.
VERSION is the source of the release version. The CLI reads it
from the same directory as service-watchdog.sh; install or copy both files
together. The Release metadata GitHub Actions workflow verifies that a pushed
vX.Y.Z tag, VERSION, --version, the stable source archive in this README,
and the matching changelog entry agree.
Before creating a release tag, run the same check locally with the intended tag. It fails with a specific mismatch instead of leaving GitHub Actions to discover it after publication:
bash ./scripts/release-preflight.sh vX.Y.ZTo test the development branch instead, clone the repository as shown above or
download main.zip.
The installed monitor remains the portable single-file
service-watchdog.sh. For development, edit the smallest relevant source file
in lib/watchdog/, then regenerate the distribution before committing:
bash ./scripts/build-watchdog.sh
bash ./scripts/build-watchdog.sh --check
The generated script does not load modules at runtime, so installer, cron, and
systemd deployments continue to need only service-watchdog.sh and VERSION.
Commands are YAML arrays, not shell strings. This preserves argument boundaries and prevents accidental shell interpolation:
services:
  - name: api
    check:
      type: http
      url: https://api.example.com/health
      success_status: [200, 204]
      timeout: 10
      attempts: 2
      retry_delay: 2

    actions:
      cooldown: 300
      verify_after: 5
      commands:
        - command: [docker, compose, restart, api]
          working_directory: /srv/api
          timeout: 120
See config.example.yaml for HTTP, TCP, and command
examples. Additional ready-to-adapt configurations are available in the
examples directory, including Docker Compose, systemd, combined
multi-service monitoring, and failure/recovery hooks.
The Draft 2020-12 JSON Schema provides YAML
completion, field descriptions and immediate error highlighting in editors.
The first line of config.example.yaml and every top-level YAML example
associates the file with the published schema:
# yaml-language-server: $schema=https://raw.githubusercontent.com/shellharbor/watchdog/main/schema/watchdog.schema.jsonIn VS Code, install the YAML extension by Red Hat and keep that line at the
top of your own config.yaml. A JetBrains IDE with JSON Schema/YAML support
can use the same URL as a custom schema mapping. To use the schema from a
checkout before it reaches main, point the editor at the local
schema/watchdog.schema.json instead.
The schema covers the monitor config and the optional discovery: section.
Templates are intentionally partial: the schema allows a service's check to
inherit fields from a template. It does not replace
./service-watchdog.sh validate -c config.yaml, which expands templates and
checks dynamic rules such as dependency cycles, installed time zones, existing
working directories and remediation allowlists. The offline discovery command
validates its own enabled settings when invoked.
watchdog-discover.sh generates a draft services: YAML fragment from
Docker Compose files and/or systemd .service files. It runs only when called
explicitly; the normal one-shot monitor does not scan sources or change its
state, checks, actions, or notifications. The generator needs Bash 4.3+ and
yq v4. Docker and systemctl are optional for static file discovery.
The installer places the generator alongside service-watchdog.sh.
Copy the discovery: section from config.example.yaml into your config, set
discovery.enabled: true, enable the desired sources, and replace the sample
paths. Then preview the output:
bash ./watchdog-discover.sh --config ./config.yaml --dry-run
bash ./watchdog-discover.sh --config ./config.yaml --source docker --format stdout
bash ./watchdog-discover.sh --config ./config.yaml --source systemd --dry-run
Compose sources may be files or directories containing one of
docker-compose.yml, compose.yml, docker-compose.yaml, or compose.yaml.
Systemd sources may be unit files, directories, or glob patterns such as
/etc/systemd/system/myapp-*.service. Published TCP ports only are used for
Compose checks: configured HTTP ports become http://localhost:PORT (HTTPS on
443/8443), other published ports become TCP checks. Services without a usable
published port are skipped. A systemd ExecStart port is a best-effort guess;
otherwise the generated check uses systemctl is-active --quiet UNIT. The
generator never executes a Compose healthcheck or remediation command.
If discovery.output_dir is empty, output goes to stdout. Otherwise an ordinary
run atomically writes auto-discovery.yaml (or your chosen prefix) inside that
directory. An existing file is left untouched; --force explicitly replaces
it. --dry-run and --format stdout always print a preview without writing.
Logs and generated-service counts go to stderr. Generated files in config.d/
are not automatically loaded by watchdog: review and merge the services
into your active config.yaml, then validate that file with
./service-watchdog.sh validate -c ./config.yaml. Check URLs, TLS, ports,
timeouts, action commands, and security policy before enabling scheduled runs.
A complete fixture and draft output are
in examples/auto-discovery.
Required fields: type: http and url. By default, any final 2xx response is
successful. Set success_status to an explicit list when needed. A timeout,
connection error, empty response, HTTP 000, or unexpected status is a failed
attempt.
headers adds request headers. Use value_env for credentials rather than a
literal value: Watchdog validates the variable name, reads it only at request
time, and never writes its value to logs, state, metrics, history, or the status
page. expect.content_type compares a response media type while ignoring its
parameters; expect.body_regex requires an extended-regex match in a temporary
response capture limited to 64 KiB. expect.json can also assert selected
JSON scalars without exposing response content in logs. Its paths are
deliberately limited to $, .field, and zero-based [index] segments—no
wildcards, filters, recursive descent, or expressions. Each of up to 20
assertions uses exactly one of equals (a string, number, or boolean with its
JSON type) or regex (an extended regular expression for a string). The body
must be valid JSON and a missing or null value fails the check.
services:
  - name: authenticated-api
    check:
      type: http
      url: https://api.example.com/health
      headers:
        - name: Accept
          value: application/json
        - name: Authorization
          value_env: WATCHDOG_API_TOKEN
      expect:
        content_type: application/json
        json:
          - path: $.status
            equals: ok
          - path: $.ready
            equals: true
          - path: $.release.version
            regex: '^v[0-9]+\\.[0-9]+\\.[0-9]+$'
        max_total_ms: 800
HTTP checks can use a private CA, mutual TLS client credentials, and an HTTP(S) proxy. TLS hostname and certificate verification remain enabled; do not work around an internal CA with insecure verification. Certificate and key paths must be absolute, regular, readable files. A client certificate and its key must be configured together. Encrypted private keys are not supported: keep an unencrypted key readable only by the Watchdog account rather than passing a passphrase through a process command line.
services:
  - name: private-api
    check:
      type: http
      url: https://api.internal.example/health
      tls:
        ca_cert_file: /etc/watchdog/pki/internal-ca.pem
        client_cert_file: /etc/watchdog/pki/watchdog-client.crt
        client_key_file: /etc/watchdog/pki/watchdog-client.key
      proxy:
        url: http://proxy.internal.example:8080
        username_env: WATCHDOG_PROXY_USERNAME
        password_env: WATCHDOG_PROXY_PASSWORD
proxy.url must be an HTTP(S) URL without embedded credentials. Keep proxy
credentials in the paired *_env fields: Watchdog passes them through a
private mode-0600 curl config file, never through curl argv, logs, state,
metrics, history, or the status page. The same transport fields work in
health.liveness and health.readiness. See
examples/http-mtls-proxy.yaml.
If an accepted response takes longer than max_total_ms, Watchdog records the
service as degraded, sends the usual transition notification, and exports its
latency metrics. It intentionally does not run remediation, affect circuit
breakers/backoff/flapping protection, or increment unavailable counters. An
unexpected content type, body, or JSON assertion remains an ordinary failed
check. JSON assertions parse the same bounded private response capture as
body_regex; neither the response body nor the compared value is logged.
See examples/smart-http.yaml for a complete,
safe-to-adapt configuration.
Required fields: type: tcp, host, and port. The check succeeds when a TCP
connection can be opened before the timeout.
type: dns queries dig +short for A, AAAA, CNAME, MX, NS, or TXT
records. name is required; resolver selects an optional resolver,
min_answers defaults to one, and expected_answers requires every listed
answer line to be present exactly as emitted by dig +short.
services:
  - name: public-api-dns
    check:
      type: dns
      name: api.example.com
      record_type: A
      resolver: 1.1.1.1
      expected_answers: [203.0.113.42]
      timeout: 5
DNS checks need dig only when enabled; validate reports a clear error if it
is absent. See examples/dns-ping.yaml.
type: ping uses the Linux ping utility to check host reachability. Set
count, max_packet_loss_percent (default 0), and optionally
max_avg_rtt_ms to turn loss or latency into an unavailable state.
services:
  - name: upstream-router
    check:
      type: ping
      host: 192.0.2.1
      count: 3
      max_packet_loss_percent: 0
      max_avg_rtt_ms: 50
ping is optional and is checked only for services that select this type. ICMP
may be filtered by a healthy host, so use an HTTP or TCP check when it better
matches the service contract.
Required fields: type: command and commands. Commands run sequentially and
the check fails on the first non-zero exit status.
Use type: disk to monitor the filesystem containing an absolute path:
services:
  - name: root-disk-space
    check:
      type: disk
      path: /
      min_free_gb: 10
      min_free_percent: 10
      attempts: 1
Set at least one threshold. When both are set, the check fails if either
minimum is missed. It measures available space with GNU df; a missing path
or failed df call also fails the check. This monitors filesystem capacity,
not drive hardware health (SMART). For a separately mounted volume, df can
fall back to the parent filesystem if the mount disappears; add a separate
mountpoint command check if mount loss must also trigger an alert. The disk
check does not run remediation unless you explicitly configure
actions.commands. The normal transition rules send one
failure alert and one recovery alert through every enabled email/webhook
channel; maintenance windows still suppress delivery. See
examples/disk-space.yaml for all five channels.
Use type: tls_cert to alert before the leaf certificate presented by a TLS
endpoint expires. host and min_days_remaining are required; port defaults
to 443, and server_name defaults to host and is sent as TLS SNI.
services:
  - name: public-api-tls
    check:
      type: tls_cert
      host: api.example.com
      server_name: api.example.com
      min_days_remaining: 21
      timeout: 10
      attempts: 1
The check needs openssl only when it is enabled. It records the expiry time
and whole days_remaining in the regular check detail, which is available to
notifications, hooks, history, and the operational log. A certificate that is
already expired always fails, including when min_days_remaining: 0.
tls_cert intentionally monitors the presented leaf certificate's expiration,
not its chain or hostname trust. Pair it with an HTTPS http check when endpoint
availability and normal CA/hostname verification are also required. See
examples/tls-certificate.yaml for a complete
schema-annotated configuration.
Security checks use the same state transitions and enabled global email/webhook
channels as other services. A threshold check becomes unavailable when its
comparison is true; a clean result returns to healthy and sends recovery
notification. Scanner or source errors also fail the check rather than being
mistaken for zero threats.
| What to watch | Check | Source |
|---|---|---|
| Uploaded files | clamav |
clamscan on an absolute path |
| SSH login failures | threshold |
journald unit, since, and regex pattern |
| SYN-flood socket count | threshold |
netstat source using ss, or netstat fallback |
| Nginx 444/429 bursts | threshold |
logfile recent lines and regex pattern |
| Custom detector | threshold |
Direct argv command, returning a count or matching lines |
services:
  - name: ssh-bruteforce
    check:
      type: threshold
      source:
        type: journald
        unit: sshd
        since: "5 minutes ago"
        pattern: "Failed password"
      threshold: 10
      comparator: ">"
      attempts: 1
Comparators are >, >=, <, <=, ==, and !=; the default is >.
logfile reads the last tail_lines lines (default 10,000), which is only
an approximation of a time window. Use journald for a true --since window.
clamav defaults to a 300-second timeout and nonrecursive scanning; install
ClamAV and refresh signatures with freshclam before enabling it. Watchdog
only invokes the scanner; it does not install signatures or quarantine files.
The optional clamscan, journalctl, and ss/netstat tools are required
only when those checks are configured, and validate reports missing tools or
unreadable paths with the config field name.
Notification templates can use {{node_id}}, {{match_count}},
{{threshold}}, {{comparator}}, and {{since}} in addition to the existing
variables. Hooks and actions receive WATCHDOG_MATCH_COUNT,
WATCHDOG_THRESHOLD, WATCHDOG_COMPARATOR, and WATCHDOG_SINCE as environment
variables; command argv items are not template-expanded. In particular,
{{attacker_ip}} extraction and automatic bans are not implemented. Add a
reviewed actions.commands rule if you want remediation. See
examples/security-monitoring.yaml.
- The check is attempted
attemptstimes. - If every attempt fails, the target changes to
unavailableand transition notifications run once. actions.commandsrun sequentially when the cooldown allows remediation.- After
verify_afterseconds, the complete check is repeated. - A successful verification changes the target back to
healthyand sends one recovery notification.
Set cooldown: 0 to allow an action on every scheduled run. Commands stop at
the first failure, matching shell && semantics. A continuing outage can retry
remediation after its cooldown, but it does not repeat the failure email.
actions.http invokes a remote API without a shell. Requests run after any
actions.commands, stop on their first failure, and participate in the same
cooldown, backoff, circuit-breaker, flapping, maintenance, post-action verify,
and --dry-run rules as local remediation.
services:
  - name: api
    check: {type: http, url: http://127.0.0.1:8080/health}
    actions:
      http:
        - method: POST
          url: https://portainer.example.com/api/endpoints/3/docker/containers/api/restart
          headers:
            - name: X-API-Key
              value_env: WATCHDOG_PORTAINER_API_KEY
          body: '{"force":true}'
          success_status: [204]
          timeout: 30
method is POST, PUT, PATCH, or DELETE; accepted statuses default to
2xx. Keep credentials in headers[].value_env or body_env, never YAML.
Payloads and secret headers are delivered through private mode-0600 temporary
files, not curl command-line arguments. In enforce mode, allow the exact pair:
security:
  remediation_policy:
    mode: enforce
    allowed_http:
      - method: POST
        url: https://portainer.example.com/api/endpoints/3/docker/containers/api/restart
See examples/remote-http-remediation.yaml.
Existing check configurations keep their original two-state behavior: a
successful check is healthy, and an exhausted check is unavailable. A
service may instead configure both health.liveness and health.readiness
as HTTP checks. It must not also configure check.
health:
  liveness: {type: http, url: http://127.0.0.1:8080/liveness, success_status: [200]}
  readiness: {type: http, url: http://127.0.0.1:8080/readiness, success_status: [200]}
Liveness failure may trigger remediation when required dependencies are
healthy. Liveness success with readiness failure is degraded: it sends the
normal failure notification on the initial transition, but never restarts the
service merely for readiness. After an action restores liveness, pending
readiness is recovering. Full recovery and its one notification require both
checks to pass. Required dependency failure produces dependency_failed and
records the blocking service, without checking or restarting the dependent.
The legacy unavailable state remains the externally visible failed state;
failed and blocked are incident phases in the incident ledger.
Each service retains its original <name>.state file. It also has an atomic
<name>.incident.json snapshot and up to 100 completed JSONL records in
<name>.incident-history.jsonl, with ID, start/change times, attempts,
remediation result, and duration. Recovery email/webhook templates may use
{{incident_id}}, {{incident_duration}}, and
{{incident_remediation_result}}; hooks receive corresponding
WATCHDOG_INCIDENT_ID, WATCHDOG_INCIDENT_DURATION, and
WATCHDOG_INCIDENT_REMEDIATION_RESULT variables. Maintenance suppresses
notifications as before; an outage that persists beyond the window gets one
deferred failure alert.
For a Go Market Data Server, /liveness should return HTTP 200 when the
process can serve basic requests, regardless of temporary backfill or data
lag. /readiness should return 200 only when it can serve useful market-data
requests and its required dependencies and initialization are ready; otherwise
it should return 503. Both endpoints should answer within the configured
timeout, with no credentials or sensitive data in response text. The Go server
must implement these endpoints in its own repository and perform gap detection
and backfill after startup. Watchdog does not restore market data. See
examples/market-data-server.yaml.
flapping.enabled defaults to false. When enabled, window_seconds counts
state transitions; reaching threshold opens a persistent flapping guard,
sends one flapping notification (unless notify: false or in maintenance),
and blocks automatic remediation. The guard remains open for at least
hold_seconds and closes only after recovery_seconds of uninterrupted
successful checks. Any failed check resets that stable period. The current
service state continues to reflect health; the incident phase and
flapping_active metric show the guard separately.
actions.backoff.enabled also defaults to false. Failed or unconfirmed
remediation schedules the next attempt after initial_delay, then multiplies
that delay by multiplier up to max_delay. Both the existing
actions.cooldown and backoff deadline must have elapsed. A confirmed full
recovery resets the failure count and deadline. If the wall clock moves
backwards, the current attempt is skipped and cooldown/backoff is rebased;
logs and blocked-action metrics explain the skip. All delays are seconds.
flapping: {enabled: true, window_seconds: 300, threshold: 4, hold_seconds: 600, recovery_seconds: 120}
actions:
  cooldown: 300
  backoff: {enabled: true, initial_delay: 60, multiplier: 2, max_delay: 1800}
Built-in email is sent only on state transitions:
unknown/healthy → unavailable: one failure message before remediation;- repeated
unavailablechecks: no duplicate failure messages; unavailable → healthy: one recovery message after a successful check.
Set enabled: false to disable built-in email without removing its settings.
The following example uses authenticated SMTP over implicit TLS on port 465:
notifications:
  email:
    enabled: true
    smtp:
      url: smtps://smtp.example.com:465
      from: watchdog@example.com
      username: watchdog@example.com
      password_env: WATCHDOG_SMTP_PASSWORD
      tls_required: true
      insecure_skip_verify: false
      timeout: 30
    recipients:
      - administrator@example.com
      - on-call@example.com

    failure:
      subject: "[watchdog] {{service}} is unavailable"
      body: |-
        Watchdog detected a service availability problem.

        Service: {{service}}
        Time: {{timestamp}}
        Check type: {{check_type}}
        Detail: {{detail}}
        HTTP status: {{http_status}}
        Check exit code: {{check_exit}}
        Remediation: {{action_status}}

        This message is sent once and will not repeat until recovery.

    recovery:
      subject: "[watchdog] {{service}} recovered"
      body: |-
        Watchdog confirmed that the service is available again.

        Service: {{service}}
        Time: {{timestamp}}
        Check type: {{check_type}}
        Detail: {{detail}}
        Remediation: {{action_status}}
SMTP fields:
urlis the SMTP endpoint. Usesmtps://host:465for implicit TLS orsmtp://host:587for SMTP upgraded with STARTTLS.fromis the envelope sender and the value of the emailFromheader.usernameis optional for SMTP servers that do not require authentication.password_envnames the environment variable containing the password. The variable itself, not its value, is written to YAML.passwordis an optional inline alternative topassword_env. Do not set both fields;password_envis recommended.- For authenticated SMTP, Watchdog writes credentials only to an ephemeral
mode-
0600curl configuration file. The file is removed immediately after delivery, so the password is not exposed in acurlprocess command line. tls_required: truerequires a secure SMTP connection. Keep this enabled for Internet-facing SMTP servers.insecure_skip_verify: falseverifies the SMTP server certificate. Set it totrueonly for a trusted server with a deliberately self-signed certificate.timeoutlimits both connection establishment and the complete SMTP request and must be between 1 and 60 seconds.recipientsmust contain at least one address. Every notification is sent to every address in this list.
For STARTTLS on port 587, only the URL needs to change:
notifications:
  email:
    enabled: true
    smtp:
      url: smtp://smtp.example.com:587
      from: watchdog@example.com
      username: watchdog@example.com
      password_env: WATCHDOG_SMTP_PASSWORD
      tls_required: true
      insecure_skip_verify: false
      timeout: 30
    recipients:
      - ops@example.com
    failure:
      subject: "[watchdog] Problem with {{service}}"
      body: "Check failed: {{detail}}"
    recovery:
      subject: "[watchdog] {{service}} is healthy"
      body: "The service recovered at {{timestamp}}."
failure.subject and recovery.subject must be single-line strings. Their
body fields can be either short quoted strings or YAML multiline blocks.
Messages are generated as UTF-8, so templates can contain non-ASCII text:
failure:
  subject: "[watchdog] Сервис {{service}} недоступен"
  body: |-
    Обнаружена проблема с сервисом {{service}}.

    Время: {{timestamp}}
    Проверка: {{check_type}}
    Описание: {{detail}}
    Статус исправления: {{action_status}}

recovery:
  subject: "[watchdog] Сервис {{service}} восстановлен"
  body: |-
    Сервис снова доступен.

    Время: {{timestamp}}
    Статус исправления: {{action_status}}
Available template variables:
{{service}}: service name fromservices[].name;{{event}}:failureorrecovery;{{timestamp}}: local date, time, and UTC offset at message creation;{{check_type}}: the configured type, such ashttp,tcp,command,disk,tls_cert,clamav, orthreshold;{{detail}}: diagnostic message from the most recent check;{{http_status}}: HTTP response code, orn/afor another check type;{{check_exit}}: check command exit code, orn/awhen unavailable;{{action_status}}: remediation state such aspending,cooldown,not-configured,successful, ornot-required.
For the included systemd unit, store the password in its optional environment file instead of YAML:
sudo install -m 0600 /dev/null /etc/service-watchdog/environment
sudoedit /etc/service-watchdog/environment
sudo chmod 0600 /etc/service-watchdog/environment
Add the variable named by password_env to that file:
WATCHDOG_SMTP_PASSWORD=replace-with-the-real-password
The included systemd unit reads this file automatically. Restarting the timer is not required after changing the password; the environment file is read each time the one-shot service starts. Test the settings by manually starting the service and then inspecting its log:
sudo systemctl start service-watchdog.service
sudo journalctl -u service-watchdog.service -n 50 --no-pager
sudo tail -n 50 /var/log/service-watchdog/service-watchdog.log
Email is emitted only when a configured service changes state. Starting the service while every target remains healthy validates the configuration but does not send a test message.
When running from root's crontab instead of systemd, the password can be set as a crontab environment variable above the scheduled command:
WATCHDOG_SMTP_PASSWORD=replace-with-the-real-password

* * * * * /opt/service-watchdog/service-watchdog.sh -c /etc/service-watchdog/config.yaml >> /var/log/service-watchdog/cron.log 2>&1
The less secure smtp.password YAML field is supported for environments where
an external secret cannot be provided:
smtp:
  url: smtps://smtp.example.com:465
  from: watchdog@example.com
  username: watchdog@example.com
  password: "replace-with-the-real-password"
  tls_required: true
Do not combine password and password_env. See
examples/smtp-email.yaml for a complete example.
If delivery fails, the error is logged; the state transition is still recorded
so the watchdog does not flood recipients with repeated attempts. A successful
SMTP request is written to the operational log as result=email-sent; a failed
request is written as result=email-failed.
Webhooks are sent on the same transitions as email: once when a service becomes unavailable and once when it later recovers. They are not sent for repeated failed checks. All secrets are read from environment variables at delivery time; do not put a bot token, webhook URL, or ntfy token in YAML.
notifications:
  webhooks:
    telegram:
      enabled: true
      bot_token_env: WATCHDOG_TG_BOT_TOKEN
      chat_id: "-1001234567890"
      # thread_id: "42"  # optional forum topic
      template:
        failure: "🚨 <b>{{service}}</b> DOWN\n\nDetail: {{detail}}\nTime: {{timestamp}}"
        recovery: "✅ <b>{{service}}</b> recovered at {{timestamp}}"

    discord:
      enabled: true
      webhook_url_env: WATCHDOG_DISCORD_WEBHOOK_URL
      template:
        failure: '{"content":"🚨 **{{service}}** is unavailable: {{detail}}"}'
        recovery: '{"content":"✅ **{{service}}** recovered"}'

    slack:
      enabled: true
      webhook_url_env: WATCHDOG_SLACK_WEBHOOK_URL
      template:
        failure: '{"text":"🚨 {{service}} DOWN: {{detail}}"}'
        recovery: '{"text":"✅ {{service}} recovered"}'

    ntfy:
      enabled: true
      url: https://ntfy.sh/watchdog-alerts
      token_env: WATCHDOG_NTFY_TOKEN  # optional
      priority: urgent
      template:
        failure: "🚨 {{service}} unavailable: {{detail}}"
        recovery: "✅ {{service}} recovered"
Telegram uses HTML parse mode, so use HTML tags such as <b>...</b> for
formatting. Discord and Slack templates must be valid JSON payloads; dynamic
template values are JSON-escaped before delivery. ntfy sends the rendered text
as the request body with Title: watchdog and the configured priority.
Supported variables are the same as email templates: {{service}}, {{event}},
{{timestamp}}, {{check_type}}, {{detail}}, {{http_status}},
{{check_exit}}, {{action_status}}, {{severity}}, and {{runbook_url}}.
Run service-watchdog.sh -n after setting the relevant environment variables:
dry-run validates enabled webhook configuration and that each configured secret
or webhook URL environment variable is non-empty. At delivery time a missing
variable is logged as result=webhook-failed with its variable name, never its
value. Webhook URLs and tokens are not written to the operational log. See
examples/telegram-notifications.yaml
for a Telegram-only starting point.
PagerDuty and Opsgenie are opt-in on-call channels under notifications.webhooks.
Failure and escalation events create or update an alert; recovery resolves the
same alert. Watchdog derives the provider deduplication key (PagerDuty) and
alias (Opsgenie) from its incident ID, so repeated failed checks do not create
new on-call incidents.
notifications:
  webhooks:
    pagerduty:
      enabled: true
      routing_key_env: WATCHDOG_PAGERDUTY_ROUTING_KEY
    opsgenie:
      enabled: true
      api_key_env: WATCHDOG_OPSGENIE_API_KEY
      region: eu  # us is the default
Both credentials are read from the environment, stored only in private
temporary curl files during delivery, and never logged. notify-test supports
both provider names as --channel pagerduty and --channel opsgenie.
See examples/oncall-notifications.yaml.
Channels remain globally configured, but a service can opt into a smaller
delivery set with notify.channels. Omitting notify.channels preserves the
original behavior: every globally enabled channel receives the service event.
severity is available to email and webhook templates as {{severity}}; it
also becomes the PagerDuty Events API severity and maps to Opsgenie priorities
critical → P1, error → P2, warning → P3, and info → P5.
Without an explicit severity, Watchdog retains its prior defaults of error
for a failure and critical for an escalation; recovery template context is
info.
services:
  - name: payments-api
    check: {type: http, url: https://payments.example.com/health}
    notify:
      channels: [telegram, pagerduty, opsgenie]
      severity: critical
      runbook_url: https://runbooks.example.com/payments-api
runbook_url must be a non-secret HTTP(S) URL. It is available as
{{runbook_url}} in templates and is included in PagerDuty and Opsgenie
trigger payloads. Do not place credentials or secret query parameters in a
runbook URL. See
examples/notification-routing.yaml for
a complete configuration.
Maintenance windows keep health checks and persistent state updates active, but
suppress remediation commands, email, webhooks, and state-change hooks. Define
them per service using IANA time zones (or omit timezone to use the system
time zone):
services:
  - name: api
    # check and actions omitted
    maintenance:
      timezone: Europe/Moscow
      windows:
        - name: nightly-backup
          days: "Sun,Wed"
          time: "02:00-04:00"
        - name: weekend-deploy
          days: "Sat,Sun"
          time: "00:00-06:00"
days accepts Mon through Sun (case-insensitive), comma-separated, or *
for every day. time is a half-open 24-hour interval: the start is included
and the end is excluded. Windows may not cross midnight, so 22:00-02:00 is
invalid; use two same-day windows instead.
If a service first becomes unavailable during a maintenance window and remains unavailable afterwards, Watchdog sends one deferred failure notification and runs the failure hook on the first check after the window ends. A service that recovers during the window does not generate a recovery notification. Existing outages keep their state throughout a window and do not receive duplicate failure alerts afterwards.
Escalation adds a higher-level response when a service remains unavailable for several consecutive watchdog runs. The counter is incremented once per unavailable run, including runs where ordinary remediation is in cooldown. It resets when the service becomes healthy.
services:
  - name: api
    # check and actions omitted
    escalation:
      enabled: true
      after_consecutive_unavailable: 3
      cooldown: 3600
      notify: true
      levels:
        - after_duration_seconds: 900
          notify: true
        - after_failed_remediations: 5
          notify: true
          manual_intervention: true
Once the root threshold is reached and the service is still unavailable after
its ordinary actions (or after the current check when no action runs), Watchdog
sends an [ESCALATION] email and escalation webhooks to enabled channels.
Explicitly configured escalation commands and hooks also run; failures in
those commands do not prevent notifications. cooldown: 0 allows an
escalation on every subsequent unavailable run after the root threshold; a
positive cooldown limits repeats.
Escalation is suppressed during a maintenance window. Watchdog persists the
counter, escalation count, and last escalation timestamp in sidecar files next
to its existing state file, preserving compatibility with existing state files.
The existing root threshold and cooldown retain their behavior. Optional
after_duration_seconds and after_failed_remediations thresholds use OR
semantics with after_consecutive_unavailable. Optional levels are
notification-only and fire once per incident; manual_intervention: true
blocks further automatic remediation until confirmed recovery. No escalation
command runs unless explicitly configured under escalation.actions.commands.
When only readiness fails, escalation may notify but does not run its action
commands or hooks. An active flapping guard, manual-intervention block, or
open circuit breaker likewise suppresses escalation action commands and
hooks, while notification policy remains available.
Watchdog can write Prometheus text exposition data for node_exporter's textfile collector. It does not run an HTTP server or require another exporter.
metrics:
  enabled: true
  textfile_directory: /var/lib/node_exporter/textfile_collector
  filename: watchdog.prom
  prefix: watchdog
  static_labels:
    instance: prod-web-01
    datacenter: msk-1
  heartbeat:
    enabled: true
Configure node_exporter to collect the directory:
--collector.textfile.directory=/var/lib/node_exporter/textfile_collector
After every normal watchdog run, the .prom file is atomically replaced. It
includes service state (0 healthy, 1 unavailable, 2 unknown, 3 dependency
failed, 4 degraded, 5 recovering), check/error counters, remediation attempts
and outcomes, incident count and current/last duration, last successful check,
escalation count, dependency/backoff/flapping blocks, flapping guard, and
backoff time remaining. HTTP services also export
watchdog_service_http_last_total_seconds and
watchdog_service_http_latency_slo_seconds; the SLO value is zero when no
max_total_ms is configured. Labels are limited to configured service/check type
and optional static labels; incident IDs, command output, response bodies, and
secrets are not labels. For example, alert when
watchdog_service_state{service="api"} == 1.
metrics.heartbeat.enabled additionally emits
<prefix>_heartbeat_timestamp_seconds with only the configured static
labels. It records the time at which Watchdog completed a full ordinary monitor
run, even if a service is unhealthy, so it detects a missing timer/cron run
rather than a service incident. It is deliberately omitted for validate,
status, reports, notify-test, --dry-run, configuration/runtime failures,
and the first manual -s SERVICE partial run. After a full run establishes a
heartbeat, a partial run re-exports the previous timestamp without refreshing
it; it therefore cannot make the scheduler look healthy.
Ready-to-import observability assets are included in
observability/: a Grafana overview dashboard, Prometheus
alert rules for stale heartbeat/unavailable/degraded services, and an
Alertmanager routing snippet. Import the dashboard, load the rules through
Prometheus, then set the heartbeat threshold to at least twice the interval of
your systemd timer or cron job. The bundled queries use the default
prefix: watchdog; replace watchdog_ in the assets if you set another prefix.
The worked
prometheus-heartbeat.yaml example uses
the same layout.
watchdog → watchdog.prom → node_exporter → Prometheus → Grafana
templates removes repetitive service defaults such as HTTP timeouts, retry
counts, and action cooldowns. A service selects one named template with
template; its own fields then override the template. Templates are expanded
once when Watchdog starts, before configuration validation and checks. Edit a
template and let the next timer run start a new process to apply the change.
templates:
  default_http:
    check:
      type: http
      timeout: 10
      attempts: 3
      retry_delay: 2
      success_status: [200, 204]
    actions:
      cooldown: 300
      verify_after: 10

services:
  - name: api
    template: default_http
    check:
      url: https://api.example.com/health
    actions:
      commands:
        - command: [docker, compose, restart, api]
The default deep mode recursively merges maps, so api inherits
check.type, timeouts, retries, and action defaults while keeping its own URL
and remediation command. Values supplied by the service take precedence.
Use template_mode: shallow when a service must replace a whole top-level
section instead of extending it:
templates:
  default_http:
    check: { type: http, timeout: 10, attempts: 3 }

services:
  - name: special-probe
    template: default_http
    template_mode: shallow
    check: { type: command, commands: [{ command: [/usr/local/bin/probe] }] }
Here check is taken entirely from special-probe; it does not inherit the
HTTP type, timeout, or attempts. Template names must be unique simple names,
and templates cannot inherit from other templates. name, template, and
template_mode inside a template are ignored with a warning.
Use only_if to gate an entire service run. Every listed condition must pass;
if one does not, Watchdog skips the health check, remediation, hooks, and
notifications. The service's state is not changed, so it remains at its last
known value until a later run meets the conditions.
| Type | Required fields | Passes when |
|---|---|---|
command |
command array |
Its exit code matches exit_code (default 0) |
file_exists |
absolute path |
The file or directory exists |
time_window |
days, time |
Current time is inside the configured window |
load_average |
one or more max_*min values |
Load is at or below every supplied maximum |
filesystem |
absolute path, free-space threshold |
The filesystem has sufficient free space |
Set invert: true on an individual condition to reverse its result. This is
useful for backup marker files and for checks that should run outside a time
window.
services:
  - name: staging-api
    check: { type: http, url: https://staging.example.com/health }
    only_if:
      # Run only outside Moscow working hours.
      - type: time_window
        days: "Mon,Tue,Wed,Thu,Fri"
        time: "09:00-18:00"
        timezone: Europe/Moscow
        invert: true

  - name: api
    check: { type: http, url: https://api.example.com/health }
    only_if:
      # Do not restart a service if the host is overloaded.
      - type: load_average
        max_1min: 4.0
      # Do not check while a backup is in progress.
      - type: file_exists
        path: /var/run/backup-in-progress
        invert: true
Command conditions are executed directly, without eval, and support a
per-condition timeout and one or more accepted exit codes:
only_if:
  - type: command
    command: [test, -f, /var/run/allow-external-check]
    timeout: 5
    exit_code: [0]
  - type: filesystem
    path: /
min_free_gb: 5.0Declare service dependencies to prevent alert storms and pointless downstream remediation when a shared prerequisite is unavailable. Watchdog topologically orders services so dependencies are checked before their consumers.
services:
  - name: db
    check: { type: tcp, host: 127.0.0.1, port: 5432 }

  - name: api
    check: { type: http, url: http://127.0.0.1:8080/health }
    depends_on:
      - name: db
        required: true

  - name: frontend
    check: { type: http, url: http://127.0.0.1:3000 }
    depends_on:
      - name: api
        required: true
db [required] → api [required] → frontend
When a required dependency is unavailable or dependency_failed, the
downstream service is recorded as dependency_failed; its check, remediation,
and transition notifications are skipped. A downstream service already marked
unavailable retains that state to avoid masking its own incident. Set
required: false for a soft dependency: Watchdog logs a warning but continues
the downstream check. Missing dependency names and circular graphs are rejected
as configuration errors.
For installations with many independent services, enable parallel health checks to reduce the duration of each one-shot run. Remediation commands, state changes, hooks, and notifications remain strictly sequential: only the read-only check phase runs concurrently.
parallel:
  enabled: true
  max_jobs: 10     # 0 means no concurrency limit
  timeout: 60      # fallback per-check timeout; check.timeout wins
  temp_dir: ""     # empty uses a private /tmp/watchdog.* directory

services:
  - name: api
    check: { type: http, url: https://api.example.com/health }

  - name: legacy-job
    parallel: false # explicitly keep this check sequential
    check: { type: command, commands: [{ command: ["/usr/local/bin/check-job"] }] }
Without dependencies, all eligible checks form one batch. Dependency chains run level by level: Watchdog collects and processes the root batch before it starts checks that rely on those roots. A required failed dependency therefore still prevents a downstream check and remediation.
For example, twenty three-second checks take about sixty seconds one at a time
and about three seconds in a sufficiently large parallel batch. Set
max_jobs conservatively for the host and its network; an unlimited batch is
useful for small configurations but can overload DNS, file descriptors, or the
services being monitored. Check worker output and results are isolated in a
temporary directory, then replayed in service order by the main process.
Federation keeps local checks local while sending a compact snapshot to a central one-shot hub. Agents never receive commands from the hub, and the hub does not open a listening port. It reads reports that an existing delivery mechanism has placed in its incoming directory, then sends one consolidated transition notification through the usual email and webhook configuration.
┌───────────┐
│ Agent × N │ ── HTTP POST or file delivery ──> ┌──────────────┐
│ watchdog  │                                   │ Hub watchdog │ ──> summary alerts
└───────────┘                                   └──────────────┘
Enable the agent on each monitored host. With heartbeat: true (recommended),
it reports on every run so the hub can distinguish a healthy host from an
offline one. With heartbeat: false, it reports an initial snapshot and then
only after a local state transition or while a service remains unavailable or
dependency-failed.
federation:
  enabled: true
  node_id: web-01                 # omit to use `hostname -s`
  agent:
    enabled: true
    transport: http
    hub_url: https://reports.example.internal/api/v1/report
    token_env: WATCHDOG_HUB_TOKEN
    timeout: 10
    heartbeat: true
  hub:
    enabled: false
For HTTP delivery, point hub_url at an existing authenticated receiver behind
nginx, Caddy, or another reverse proxy. That receiver must validate the bearer
token and atomically write the request body as {node_id}.json in the hub's
incoming_dir; Watchdog deliberately does not implement an HTTP server.
For file delivery, set transport: file and provide an absolute report_path.
The agent writes it atomically. Use rsync, scp, Syncthing, S3 synchronization,
or your preferred deployment tool to deliver it to the hub as
{node_id}.json.
Run the hub with its own configuration and an empty service list. It accepts
only JSON whose filename matches its node_id, chooses the newest report for
each node by the timestamp inside it, archives valid inputs, and marks expected
nodes offline after max_report_age seconds. major_outage means at least one
reported service is unavailable; degraded means a dependency failure,
unknown service state, or expected offline agent; and unknown means no fresh
valid report exists.
services: []

federation:
  enabled: true
  hub:
    enabled: true
    incoming_dir: /var/lib/watchdog-hub/incoming
    archive_dir: /var/lib/watchdog-hub/archive
    max_report_age: 300
    archive_retention_days: 7
    expected_nodes: [web-01, web-02]
    notify_on:
      overall_change: true
      agent_offline: true
      any_service_change: false
The hub stores its aggregate state in
settings.state_directory/federation-hub-state.json. Its optional templates
support {{overall_status}}, {{previous_status}}, {{timestamp}},
{{unhealthy_services}}, {{offline_nodes}}, {{node_id}}, and
{{age_seconds}}. Email uses these templates directly; enabled webhook
providers receive the corresponding failure or recovery event.
A hub is scheduled just like an ordinary watchdog run. For example, create a
separate watchdog-hub.service whose ExecStart points to the hub config, and
use this timer:
# /etc/systemd/system/watchdog-hub.timer
[Unit]
Description=Run Watchdog federation hub

[Timer]
OnBootSec=1min
OnUnitActiveSec=1min
Persistent=true

[Install]
WantedBy=timers.target
The hub is still a one-shot process: it exits after processing the current directory and leaves no port open.
Circuit breaker prevents a persistently broken service from repeatedly restarting itself. Health checks always continue, so current availability stays visible in the log and metrics.
circuit_breaker:
  enabled: true
  failure_threshold: 3
  open_duration: 1800
  half_open_verify_after: 30
  notify: true
CLOSED → [failure threshold] → OPEN → [open duration] → HALF-OPEN
↑ │ │
└──────────── [verify success] ┴────── [verify fail] ────┘
Only a complete failed remediation cycle increments the circuit failure count.
While OPEN, Watchdog skips remediation commands. At the end of open_duration,
it performs one half-open remediation attempt; success closes and resets the
circuit, while failure reopens it. Optional on_open and on_close hooks and
notifications run for those state changes.
Generate a self-hosted, dependency-free status page on every watchdog run. The page is a single responsive HTML file with inline CSS; an optional JSON file is also useful for custom front ends.
status_page:
  enabled: true
  output_directory: /var/www/status
  html_filename: index.html
  json_filename: status.json
  title: My Services Status
  description: Real-time availability of monitored services
  auto_refresh: 60
  uptime:
    enabled: true
    days: 30
    buckets: 30
Serve the generated directory with nginx:
location /status {
    alias /var/www/status;
    try_files $uri $uri/ /index.html;
}
┌──────────────────────────────┐
│ My Services Status │
│ ● All Systems Operational │
├──────────────────────────────┤
│ api ● Operational │
│ database ● Operational │
└──────────────────────────────┘
Files are atomically replaced, so nginx, Apache, Caddy, or static hosting can serve them safely without a runtime dependency beyond Watchdog itself.
status_page.uptime is opt-in and requires history.enabled: true. It renders
one CSS bar per equal interval across the trailing days window; buckets
defaults to 30. Green means the latest recorded observation in that interval
was healthy, orange means degraded or recovering, red means unavailable or a
dependency failure, and grey means no observation. This is sampled, observed
availability—not a continuous-time SLA. Set history retention to at least the
same number of days so earlier bars do not become grey through rotation.
hooks.on_failure and hooks.on_recovery run only on state transitions. Use
them to call a mailer, Slack script, incident platform, or any local integration.
Each command receives:
WATCHDOG_SERVICEWATCHDOG_EVENT(unavailableorhealthy)WATCHDOG_DETAILWATCHDOG_CHECK_TYPEWATCHDOG_HTTP_STATUSWATCHDOG_CHECK_EXITWATCHDOG_TIMESTAMPWATCHDOG_INCIDENT_ID,WATCHDOG_INCIDENT_DURATION,WATCHDOG_INCIDENT_REMEDIATION_RESULT
Example:
hooks:
  on_failure:
    - command: [/usr/local/bin/notify-watchdog]
      timeout: 30
  on_recovery:
    - command: [/usr/local/bin/notify-watchdog]
      timeout: 30
Keep hook secrets outside YAML. Notification scripts can read credentials from a root-owned environment file or secret manager.
Use notify-test to send an explicit message without taking a service down:
bash ./service-watchdog.sh notify-test -c ./config.yaml -s api --channel all --event failure
bash ./service-watchdog.sh notify-test -c ./config.yaml --channel telegram --event recovery
The defaults are --channel all and --event failure; escalation is also
supported. With -s, the selected service supplies its name and check type.
With -s, its notify.channels routing is also applied; globally enabled but
unrouted channels are reported as skipped | not routed. Without -s, the
synthetic name is watchdog-test and all globally enabled channels remain
eligible. The message uses the detail
This is a test notification from watchdog, a test-<unix> incident ID,
n/a for check status/exit, and not-required for action status. Subjects
and message text start with [TEST].
Output is CHANNEL | RESULT | DETAIL, with a row for each selected channel.
Disabled channels are skipped. The command writes its delivery result to the
operational log but does not run checks, actions or hooks, take the global
lock, or change monitoring state, history, metrics, or status pages. It sends
even during maintenance, with a warning for a selected service in an active
window. --dry-run is rejected to preserve the no-send meaning of dry-run.
Exit status is 0 when all selected enabled channels succeed, 1 if any
fails, and 2 for configuration errors or no selected enabled channels.
See examples/notify-test.yaml.
status reads the last persisted state; it never runs checks or writes files:
bash ./service-watchdog.sh status -c ./config.yaml
bash ./service-watchdog.sh status -c ./config.yaml --json --all
bash ./service-watchdog.sh status -c ./config.yaml -s api
The table columns are SERVICE | STATE | PHASE | SINCE | LAST CHECK | NEXT ACTION | CIRCUIT | FLAPPING | MAINT | ESC. --all includes .state files
whose services are absent from the config, marked (orphaned). A configured
service without state is unknown. SINCE and a waiting NEXT ACTION are
human-readable durations; blocks distinguish manual intervention, an open
circuit, and flapping. Maintenance is calculated for the current time, not
copied from a potentially stale marker. ANSI color is used only on a terminal
when NO_COLOR is unset.
--json emits an array of objects with this stable schema:
{"service":"api","state":"healthy","phase":"healthy","since_seconds":60,"last_check":"2026-01-01T12:00:00Z","next_action":"n/a","next_action_seconds":null,"circuit":"closed","flapping":false,"maintenance":null,"escalations":0,"orphaned":false}since_seconds and next_action_seconds are integer seconds or null when
unknown/not waiting. last_check is an ISO-8601 UTC string or null;
maintenance is the current window name or null. In JSON, next_action
is n/a, ready, waiting, or blocked: manual|circuit-open|flapping;
the table displays in <duration> for waiting.
The command validates the config, including service templates, entirely in
memory. Invalid config exits 2 without a partial table/JSON; otherwise it
exits 0 only when every shown service is healthy, or 1 if any is not.
See examples/status-cli.yaml.
Per-check history is opt-in and separate from the bounded incident ledger. Enable JSON Lines storage to append one snapshot after each completed service check (including parallel checks):
history:
  enabled: true
  storage: jsonl
  path: /var/lib/service-watchdog/history
  rotation:
    mode: daily
    max_age_days: 30
  reports:
    trend_dots: 60
In daily mode, Watchdog creates history_YYYY-MM-DD.jsonl and removes old
files automatically after the configured age. single mode uses
history.jsonl; set rotation.max_records to cap its line count. Set either
limit to 0 to disable that limit. JSONL needs no new dependency. For complex
SQL analysis, set storage: sqlite and path to an absolute .db file;
this optional mode requires the sqlite3 CLI, checked by validate.
history.fields can select stored columns, but must include timestamp,
service, and state for reporting. The default stores all fields.
Reports and trends validate the config and read history without running checks, acquiring the lock, or creating files:
$ ./service-watchdog.sh --report daily -c config.yaml
SERVICE | TOTAL | HEALTHY | UNAVAILABLE | UPTIME | FALLS | DOWNTIME
api                       |    60 |      58 |           2 |  96.7% |     1 | 2m

$ ./service-watchdog.sh --trend api -c config.yaml
api [████████████████████░░████████] 93.3% (28/30)
█ healthy  ░ unavailable/degraded/recovering
Uptime: 93.3% | Falls: 1 | MTTR: 2m | Last fall: 2026-09-26T00:36:00+03:00 (2m)
--report supports daily (since local midnight), weekly (last seven days),
and monthly (last 30 days). Uptime is the fraction of healthy snapshots,
not a continuous-time availability SLA; downtime and MTTR use the intervals
between sampled unavailability and recovery. Skipped checks and --dry-run
do not add snapshots. See examples/history/ for a
sample JSONL record.
service-watchdog.sh [-c FILE] [-s SERVICE] [-n]
service-watchdog.sh --dry-run [-c FILE] [-s SERVICE]
service-watchdog.sh validate -c FILE
service-watchdog.sh notify-test [-c FILE] [-s SERVICE] [--channel email|telegram|discord|slack|ntfy|all] [--event failure|recovery|escalation]
service-watchdog.sh status [-c FILE] [-s SERVICE] [--json] [--all]
service-watchdog.sh --report daily|weekly|monthly [-c FILE]
service-watchdog.sh --trend SERVICE [-c FILE]
service-watchdog.sh -V | --version
0: all selected services are healthy and no remediation was attempted1: at least one service is unavailable or remediation was attempted2: configuration, dependency, or environment error
validate checks YAML syntax and semantics, dependency names/cycles, policy
thresholds, and the remediation allowlist without running health checks,
actions, hooks, notifications, or creating runtime state/log/lock files. It
uses exit code 0 for valid configuration and 2 for an error with a
configuration path in the diagnostic. For example:
./service-watchdog.sh validate -c examples/market-data-server.yaml-n or --dry-run performs health checks and logs actual results, would-be
state changes/actions, and skip reasons. It does not run remediation,
escalation actions, hooks, or notifications, and does not change persistent
state/history/metrics/status pages. It may still create or append the
operational log, create the lock file, acquire the lock, and use temporary
files. Checks themselves can have side effects if configured as commands;
review them before dry-running.
Existing single-check YAML and .state files work unchanged. All new
flapping/backoff/allowlist behavior is opt-in; without health, readiness is
not inferred, and without security.remediation_policy.mode: enforce,
legacy command execution remains enabled. Incident snapshots and histories
are created lazily on normal runs; no state-file conversion is needed.
unavailable remains the failed external state, with richer phases in the
incident JSON. The expanded metrics preserve the original metric names and
add new families; dashboards may opt into the new state values. The timer and
exit codes are unchanged. Before enabling enforce mode, convert every
remediation/escalation action to an absolute, canonical executable path and
list its complete argument vector in allowed_commands; then run validate
under the same account and host that will run Watchdog.
The included timer runs once per minute. Adjust OnUnitActiveSec in
packaging/systemd/service-watchdog.timer if needed.
sudo systemctl enable --now service-watchdog.timer
systemctl list-timers service-watchdog.timer
journalctl -u service-watchdog.service
The service unit treats exit code 1 as an expected watchdog result; only exit
code 2 marks the unit failed.
Use root's crontab when remediation commands require access to Docker,
systemctl, or other privileged services. First make the script executable and
verify the configuration in dry-run mode:
sudo chmod +x /opt/service-watchdog/service-watchdog.sh
sudo install -d -m 0750 /var/log/service-watchdog
sudo /opt/service-watchdog/service-watchdog.sh \
  -c /etc/service-watchdog/config.yaml \
  -n
Open root's crontab:
sudo crontab -eRun the watchdog every minute:
PATH=/usr/local/sbin:/usr/local/bin:/usr/sbin:/usr/bin:/sbin:/bin

* * * * * /opt/service-watchdog/service-watchdog.sh -c /etc/service-watchdog/config.yaml >> /var/log/service-watchdog/cron.log 2>&1
For a five-minute interval, use:
*/5 * * * * /opt/service-watchdog/service-watchdog.sh -c /etc/service-watchdog/config.yaml >> /var/log/service-watchdog/cron.log 2>&1Check the installation and follow the operational log:
sudo systemctl status cron
sudo crontab -l
sudo tail -f /var/log/service-watchdog/service-watchdog.log
The global flock lock prevents overlapping cron runs. Exit code 1 is an
expected result when a target remains unavailable or remediation was attempted;
cron can continue scheduling subsequent runs normally.
Install Mike Farah yq v4. The unrelated
Python package named yq is not compatible. Verify the installed binary:
yq --versionKeep the configuration readable by the account running the watchdog and writable only by an administrator:
sudo chown root:root /etc/service-watchdog/config.yaml
sudo chmod 0640 /etc/service-watchdog/config.yaml
When running as a non-root service account, set an appropriate group instead of weakening permissions for all users.
The shell opens redirection targets before it starts the watchdog. Create the log directory before installing the crontab entry:
sudo install -d -m 0750 /var/log/service-watchdogRun the watchdog under an account that can execute the configured action. For
Docker, verify socket/group access; for systemctl, use root's timer or a
narrowly scoped sudo/polkit rule. Do not make the configuration world-writable.
The watchdog intentionally skips a run when another instance holds the global
flock lock. Check whether a previous command is still running and review its
configured timeout before increasing the schedule interval.
0means all selected targets were healthy and no remediation ran.1means a target was unavailable or remediation was attempted; this is an expected monitoring result.2means the watchdog encountered a configuration, dependency, or runtime error.
- Run with the least privileges required by remediation commands.
- Keep the configuration root-owned and not writable by the service account.
- Avoid putting passwords, tokens, or shell snippets in YAML.
- Prefer
notifications.email.smtp.password_envover an inline SMTP password. - Commands are executed directly as argument arrays; no
evalorbash -cis used for configured commands. - Command output is truncated before it is written to the log.
To opt into a restrictive action policy, use the following schema with the exact command vectors used by remediation and escalation:
security:
  remediation_policy:
    mode: enforce
    allowed_commands:
      - command: [/usr/bin/systemctl, restart, market-data.service]
Validation and execution reject relative and symlink executable paths,
shebang scripts, unlisted arguments, and shell/wrapper executables such as
bash, env, and sudo. The policy covers actions.commands,
escalation.actions.commands, and exact method/URL entries in actions.http;
check.commands, conditions, and hooks remain trusted administrator
configuration and can have side effects.
Protect the YAML, the executable and its parent directories, state and lock
directories, and the service account from untrusted writes. An exact-argument
allowlist is not a sandbox: a trusted binary may still have dangerous behavior
or load mutable files, and a privileged account retains its privileges.
Use a separate OS service account and filesystem permissions for stronger
isolation. Legacy mode is retained solely for compatibility; migrate to
enforce after reviewing actions.
The Python launcher has dependency-free unit tests. The Python package workflow runs them on Python 3.11 and 3.12, then builds and checks both wheel and sdist on Linux / Python 3.12:
python3 tests/python_launcher.py
python3 -m venv .venv-package
.venv-package/bin/python -m pip install --require-hashes --only-binary=:all: \
  -r .github/requirements-packaging.txt
.venv-package/bin/python -m build --no-isolation
.venv-package/bin/python -m twine check --strict dist/*
.venv-package/bin/python tests/python_package.py
The install tests use isolated virtual environments, rebuild the wheel from the standalone sdist, compare bundled files with the repository, and exercise actual validation/checks, default config lookup, literal argv, signals, and exit codes without requiring PyPI access. They need the ordinary Linux runtime dependencies. The packaging lock is CI-only and does not add Python runtime dependencies to the package.
CI-only Python dependencies are version- and hash-locked in
.github/requirements-ci.txt for CPython 3.12
on Linux x86_64. Install them in an isolated environment before Python tests:
python3 -m venv .venv
.venv/bin/python -m pip install --require-hashes --only-binary=:all: -r .github/requirements-ci.txt
.venv/bin/python tests/supply_chain.py
The supply-chain test runs in CI alongside the authoritative Bash suite. It protects immutable dependency references, job token permissions, checkout credentials, and checksum failure behavior. See the Scorecard audit for the public report and its limits.
The separate Fuzzing workflow runs genuine ClusterFuzzLite/Atheris mutations
against configuration validation and JSON/HTML/Prometheus string handling.
Deterministic seeds and release boundary checks run in ordinary CI:
python3 tests/fuzzing.py
python3 tests/release_artifacts.py
python3 tests/cosign_offline.py # Requires Cosign 3.1.3; disposable keys only.
New releases that include the signing workflow upload a deterministic source archive, checksums, and keyless Sigstore bundles. Verify their exact GitHub workflow/tag identity before installing; see the fuzzing and signature guide.
bash ./scripts/build-watchdog.sh --check
bash -n service-watchdog.sh watchdog-discover.sh install.sh scripts/build-watchdog.sh lib/watchdog/*.sh tests/*.sh
bash -n scripts/github-action-entrypoint.sh
shellcheck service-watchdog.sh watchdog-discover.sh install.sh scripts/build-watchdog.sh scripts/github-action-entrypoint.sh tests/*.sh
bash ./tests/versioning.sh
bash ./tests/run-all.sh
# With Helm 3, kind, kubectl, and PyYAML available:
helm lint charts/watchdog --strict
python3 ./tests/kubernetes_chart.py
python3 ./tests/kubernetes_integration.py
tests/run-all.sh is the authoritative Bash regression inventory. It fails if a
new test script is not registered, then runs every listed scenario in a
deterministic order. GitHub Actions runs this same suite on pushes and pull
requests. The schema test requires Mike Farah yq v4 and Python's jsonschema
package; CI installs both and also compiles every Bash source with the official
bash:4.3.48 container to protect the documented compatibility floor.
tests/smart-http.sh covers secret headers, content
assertions, latency degradation, no-remediation behavior, and metric output.
tests/tls-certificate.sh covers SNI and port handling, expiry thresholds,
missing optional dependencies, dry runs, invalid configuration, and the absence
of certificate data in operational logs.
tests/yaml-cache.sh validates template expansion while bounding the number of
yq parser invocations used for configuration reads.
tests/build.sh checks that the generated distribution is current and exactly
matches a fresh build from the source modules.
The separate Kubernetes workflow verifies the chart and production image
inside an isolated kind cluster; it never reads a maintainer kubeconfig or
touches an external cluster.
MIT
Igor Sazonov — sovletig@gmail.com
Project repository: github.com/shellharbor/watchdog