
Documentation | Playground | Gallery
Generate metro-map-style SVG diagrams from Mermaid graph definitions with %%metro directives. Designed for visualizing bioinformatics pipeline workflows (e.g., nf-core pipelines) as transit-style maps where each analysis route is a colored "metro line."

Try it without installing: the nf-metro playground runs the full layout engine in your browser. Edit a .mmd file, preview the result live, import a Nextflow -with-dag diagram directly, and tweak layout options - no Python, no CLI needed.
- Static SVG - a self-contained diagram you can commit, embed in a README, or drop into docs.
- Interactive HTML - pan, zoom, hover for station details, click a line in the legend to isolate it and zoom to its extent.
- Live progress overlay - light up stations in real time as a Nextflow pipeline runs, using
nf-metro servewith Nextflow's-with-weblog. - Dashboard mode -
nf-metro serve-multihosts many pipelines or runs side by side on one page. - Nextflow DAG import - convert a
-with-dagMermaid export into a metro map withnf-metro convert(or--from-nextflowonrender). - Embedded data manifest - every SVG carries a machine-readable JSON manifest so overlays and downstream tools can address stations without re-running the layout engine.
pip install nf-metroconda install bioconda::nf-metroA pre-built container is available via Seqera Containers:
docker pull community.wave.seqera.io/library/pip_nf-metro:611b1ba39c6007f1Two features need a dependency the base install leaves out:
pip install "nf-metro[validate]"   # nf-metro validate-svg (jsonschema)
pip install "nf-metro[font]" # render --text-to-paths (fonttools)pip install -e ".[dev]"Requires Python 3.11+.
Write a two-line pipeline to pipeline.mmd:
cat > pipeline.mmd <<'EOF'
%%metro title: Simple Pipeline
%%metro line: main | Main | #4CAF50
%%metro line: qc | Quality Control | #2196F3 | dashed

graph LR
    input[Input]
    fastqc[FastQC]
    trim[Trimming]
    align[Alignment]

    input -->|main| trim
    trim -->|main| align
    input -->|qc| fastqc
    trim -->|qc| fastqc
EOF
Render it:
nf-metro render pipeline.mmd -o pipeline.svgCheck the input without rendering, or see what nf-metro made of it:
nf-metro validate pipeline.mmd
nf-metro info pipeline.mmd
Every command takes --help, and the CLI reference documents each one and every option it accepts. The Guide is a step-by-step walkthrough of writing .mmd files, ending in the full directive reference.
Input files are a subset of Mermaid graph LR syntax extended with %%metro directives. The map above uses only global directives, which configure the whole map, plus edges carrying the line IDs that pass along them. Section directives inside Mermaid subgraph blocks control how each section is laid out.
From there the Guide covers sections, entry and exit ports, grid placement, file and folder icons, off-track stations, inactive lines and the rest, directive by directive.
--format html produces a self-contained page with the SVG inlined plus a small JS/CSS layer (no external dependencies, no network):
nf-metro render pipeline.mmd --format html -o pipeline.htmlDrag to pan, scroll to zoom, hover a station for its label, section and lines, and click a line in the legend to isolate it and zoom to its extent. An Embed... panel copies out a snippet for a host page: inline HTML that keeps full interactivity, an iframe one-liner, or the raw <svg> for contexts that strip scripts.
GitHub READMEs are one of those contexts, so embed there as a static SVG (or link out to a hosted version). Most static-site generators and internal wikis run the inline-HTML snippet as-is. See the embedding guide for the options.
nf-metro can light up a metro map in real time as a Nextflow pipeline runs. Map stations to Nextflow processes with %%metro process: directives, then start the server and point Nextflow's -with-weblog at it:
nf-metro serve path/to/map.mmd
nextflow run my/pipeline -with-weblog http://localhost:8080/events
Stations transition from pending to running to done as tasks are submitted and complete. The layout is computed once and the overlay is drawn on top, so the map never re-flows during a run. nf-metro serve-multi is the dashboard version: each pipeline or run registers its own map and gets a stable /r/<id>/ URL.
For multi-pipeline dashboards, persistent history, and the optional Nextflow plugin that handles wiring automatically, see the live progress guide.
Every rendered SVG carries a machine-readable manifest, so the committed file is a self-contained artifact: a downstream tool can position overlays, restyle nodes, or look up which processes a node represents without re-running the layout engine. The data travels as a JSON block in a <metadata id="diagram-manifest"> element and as data-node-* attributes on each station's <g> element. See the data manifest docs for the schema and how to consume it.
The examples/ directory contains ready-to-render .mmd files:
| Example | Description |
|---|---|
simple_pipeline.mmd |
Minimal two-line pipeline with no sections |
rnaseq_auto.mmd |
nf-core/rnaseq with fully auto-inferred layout |
rnaseq_sections.mmd |
nf-core/rnaseq with manual grid overrides |
examples/topologies/ collects the layout patterns the engine is tested against. See the topology README for descriptions and rendered previews, or browse the online gallery.
A few highlights:
| Wide Fan-Out | Section Diamond | Variant Calling |
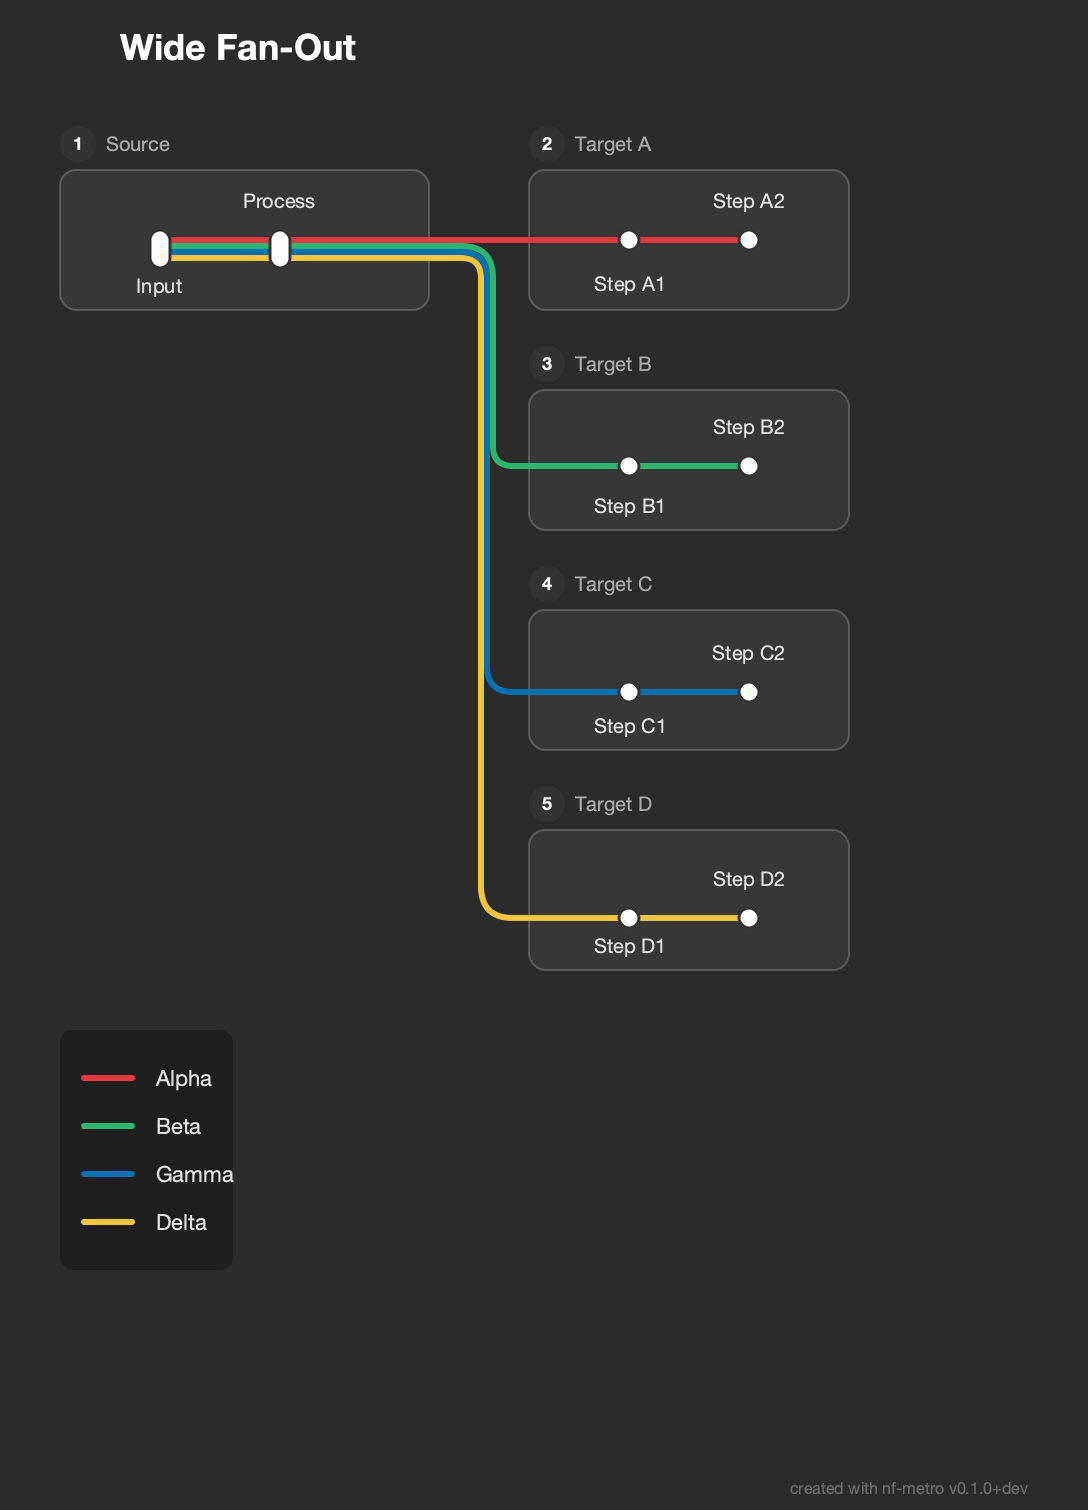 |
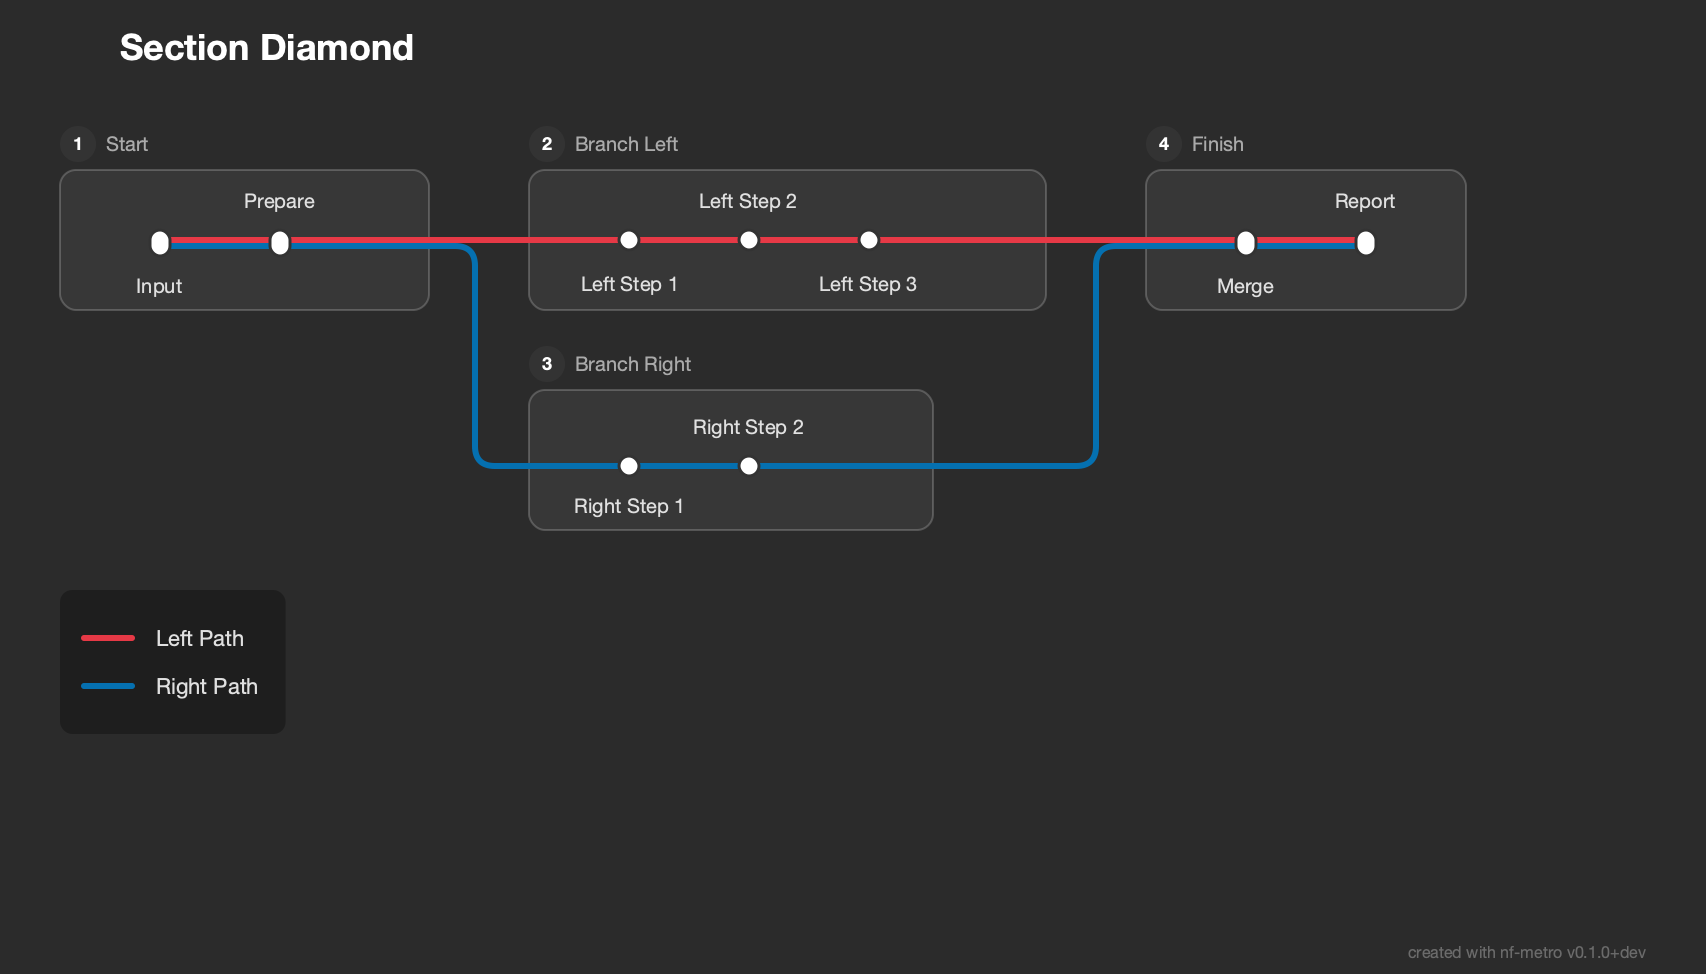 |
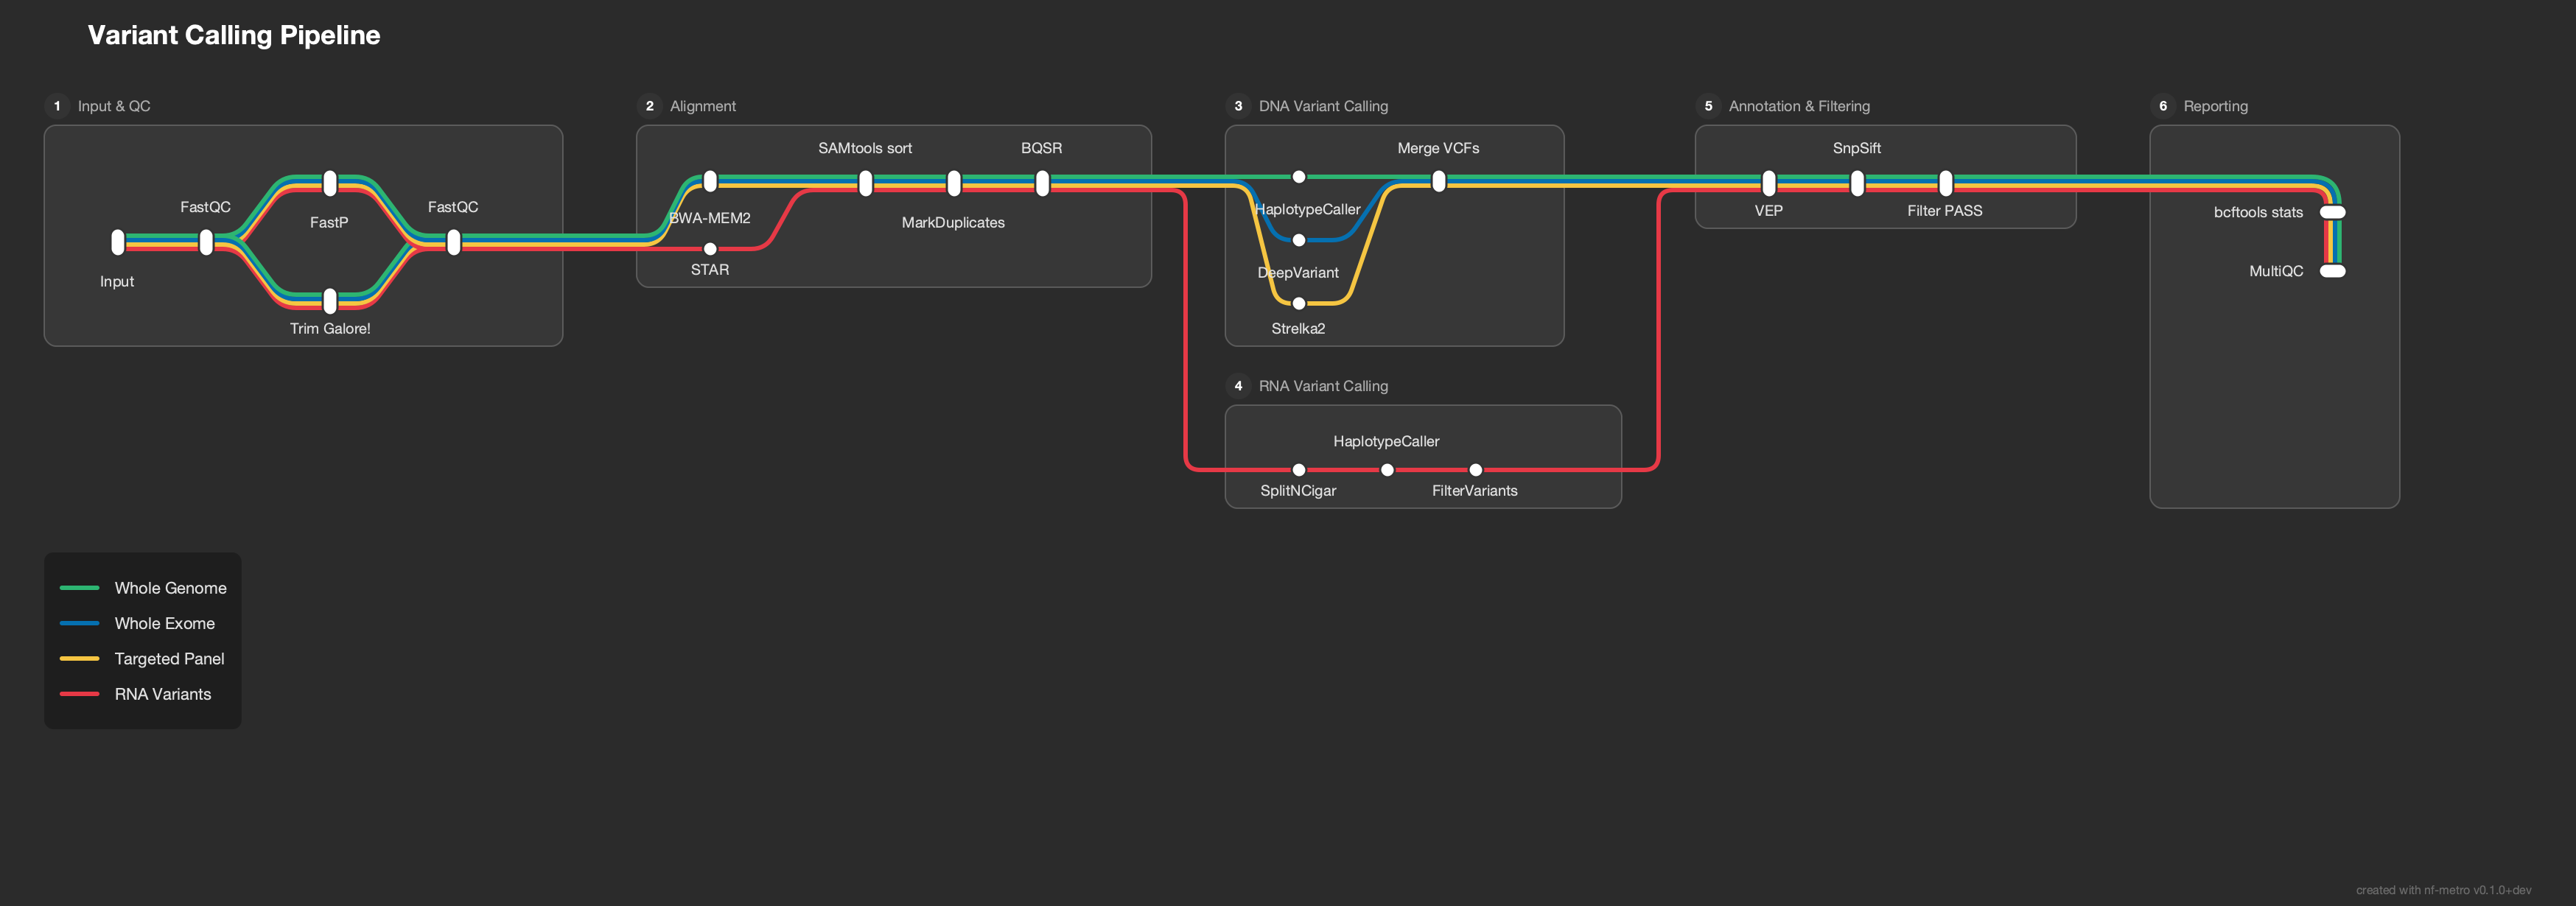 |
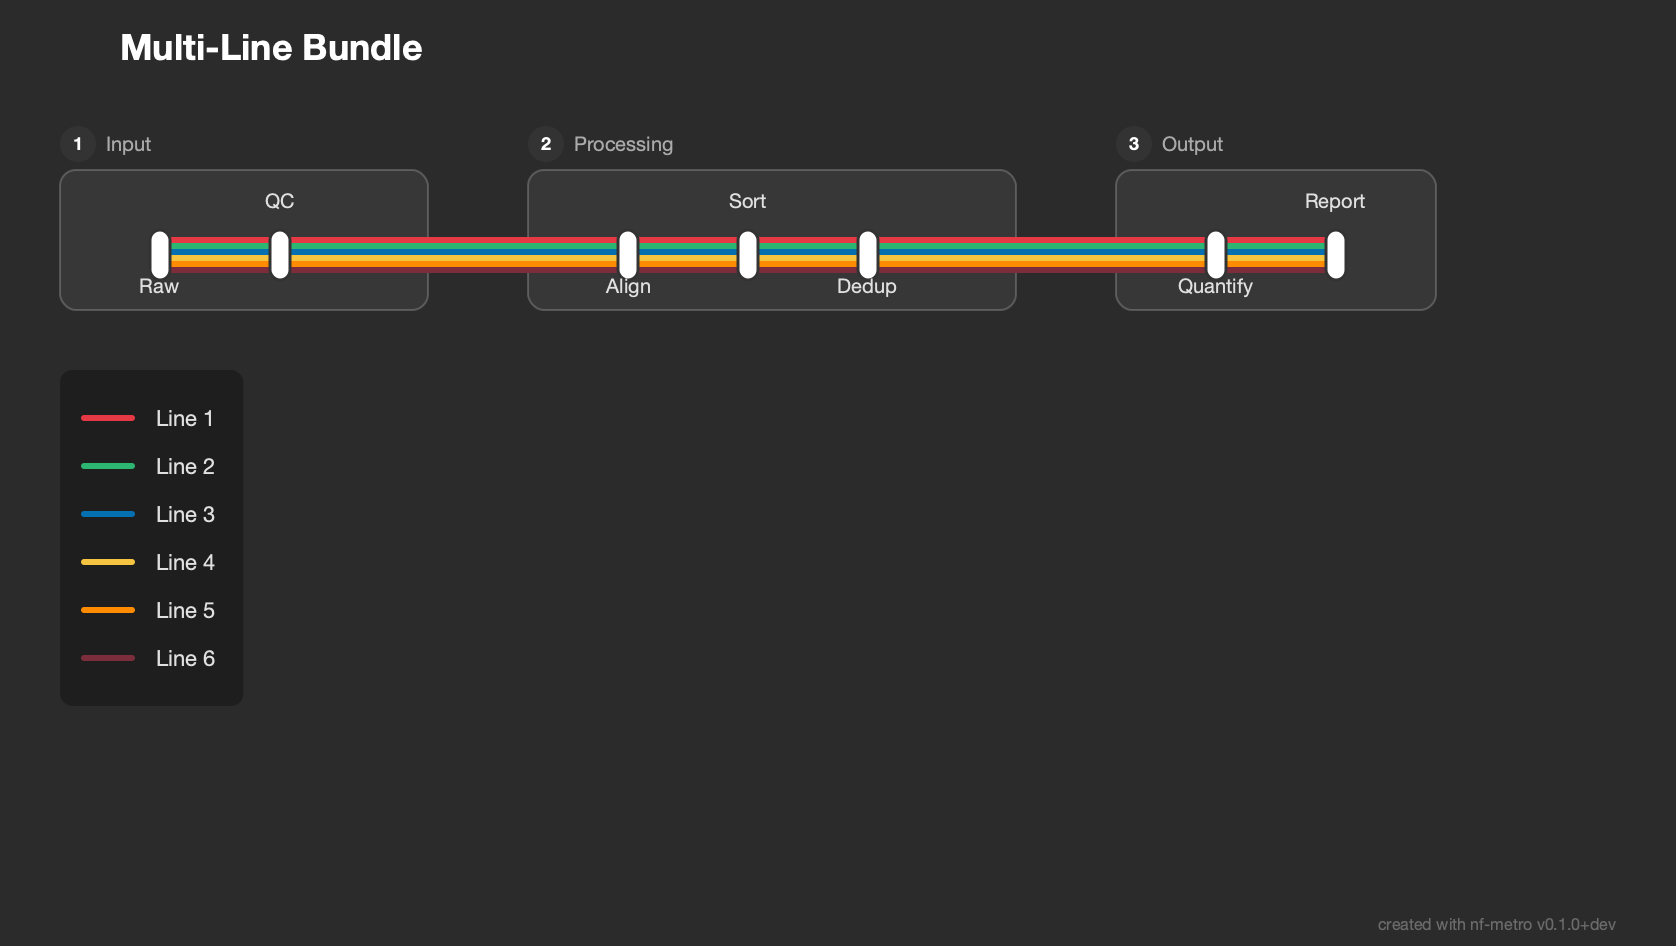
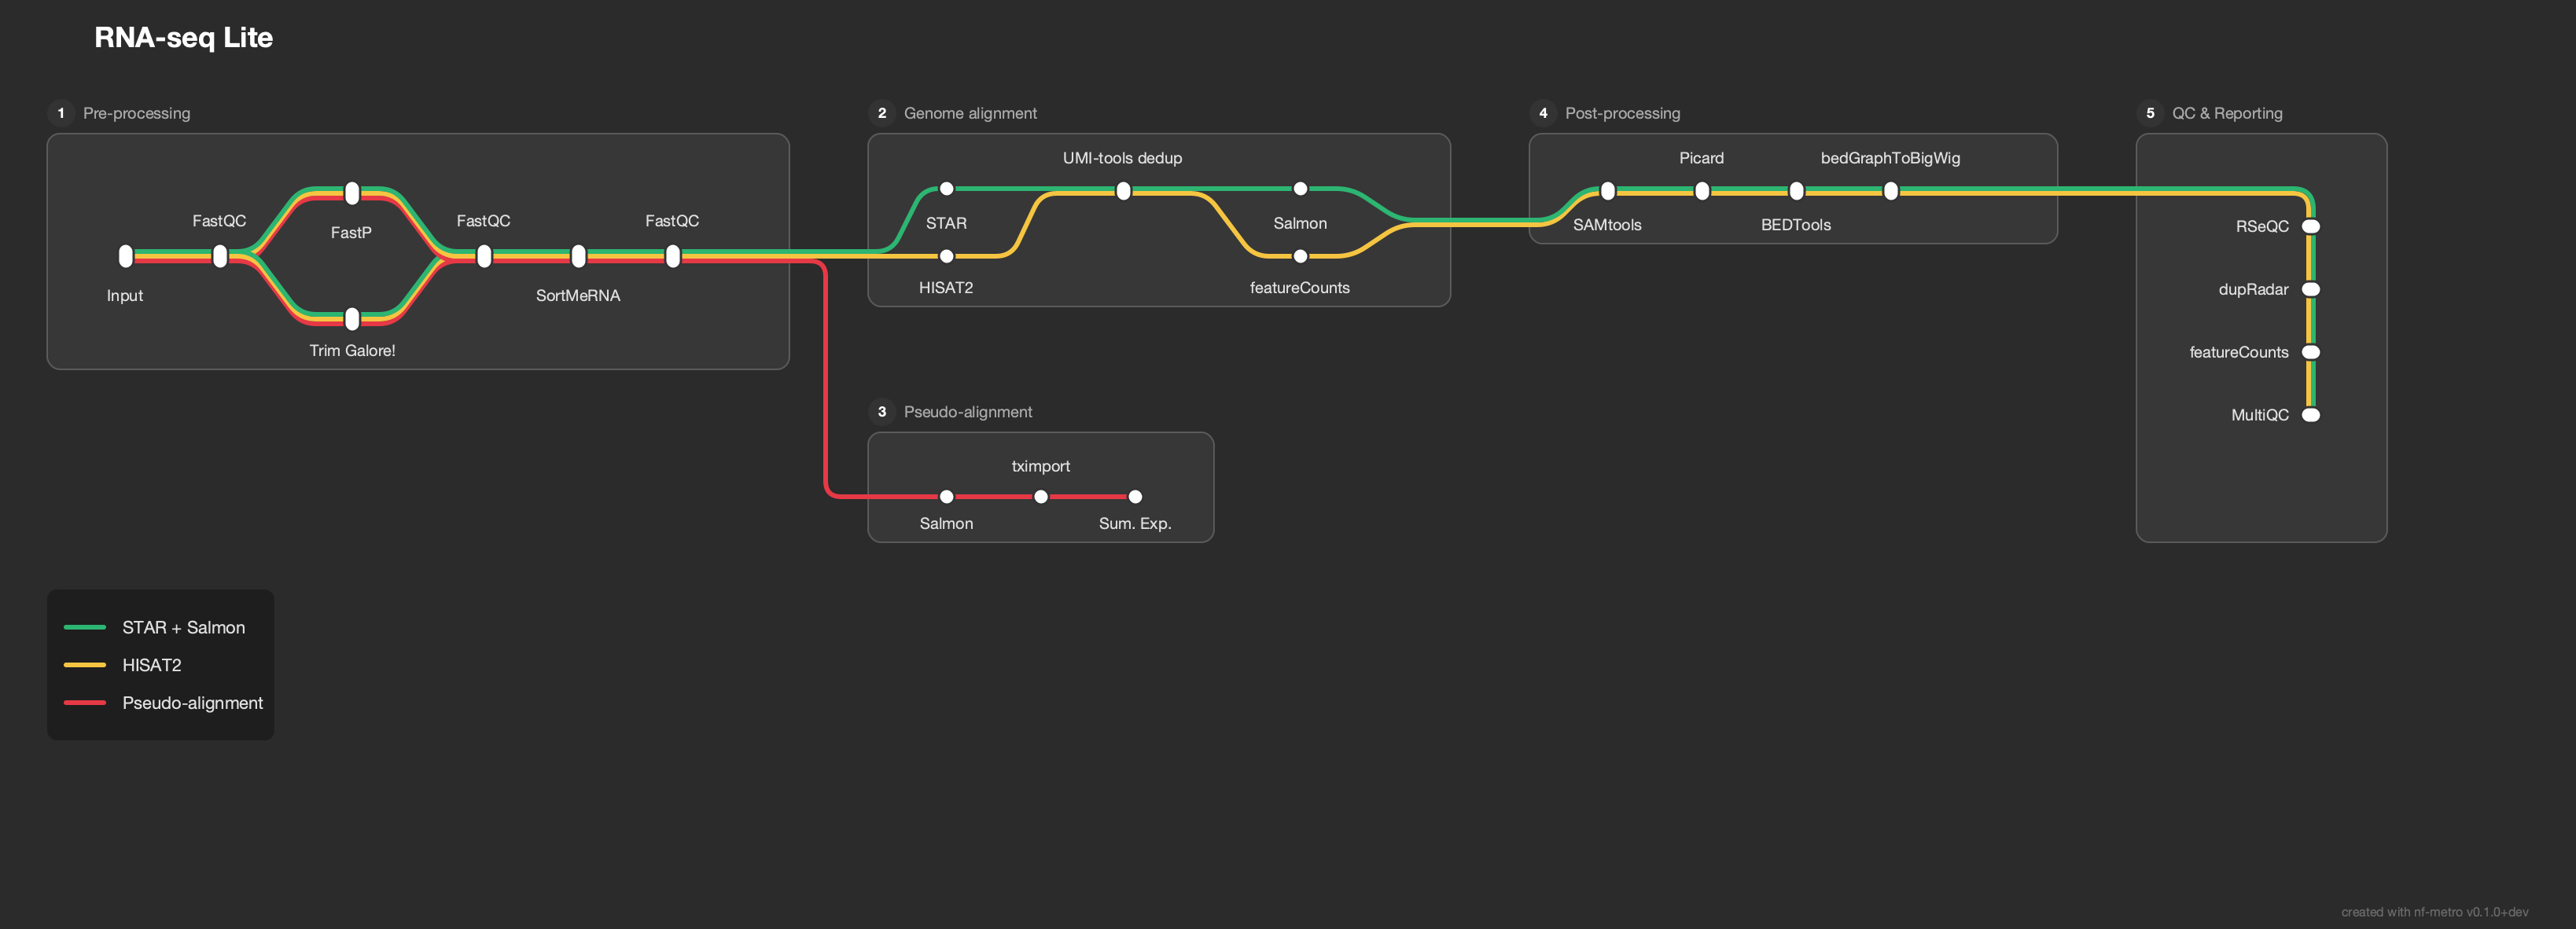
| Fold Serpentine | Multi-Line Bundle | RNA-seq Lite |
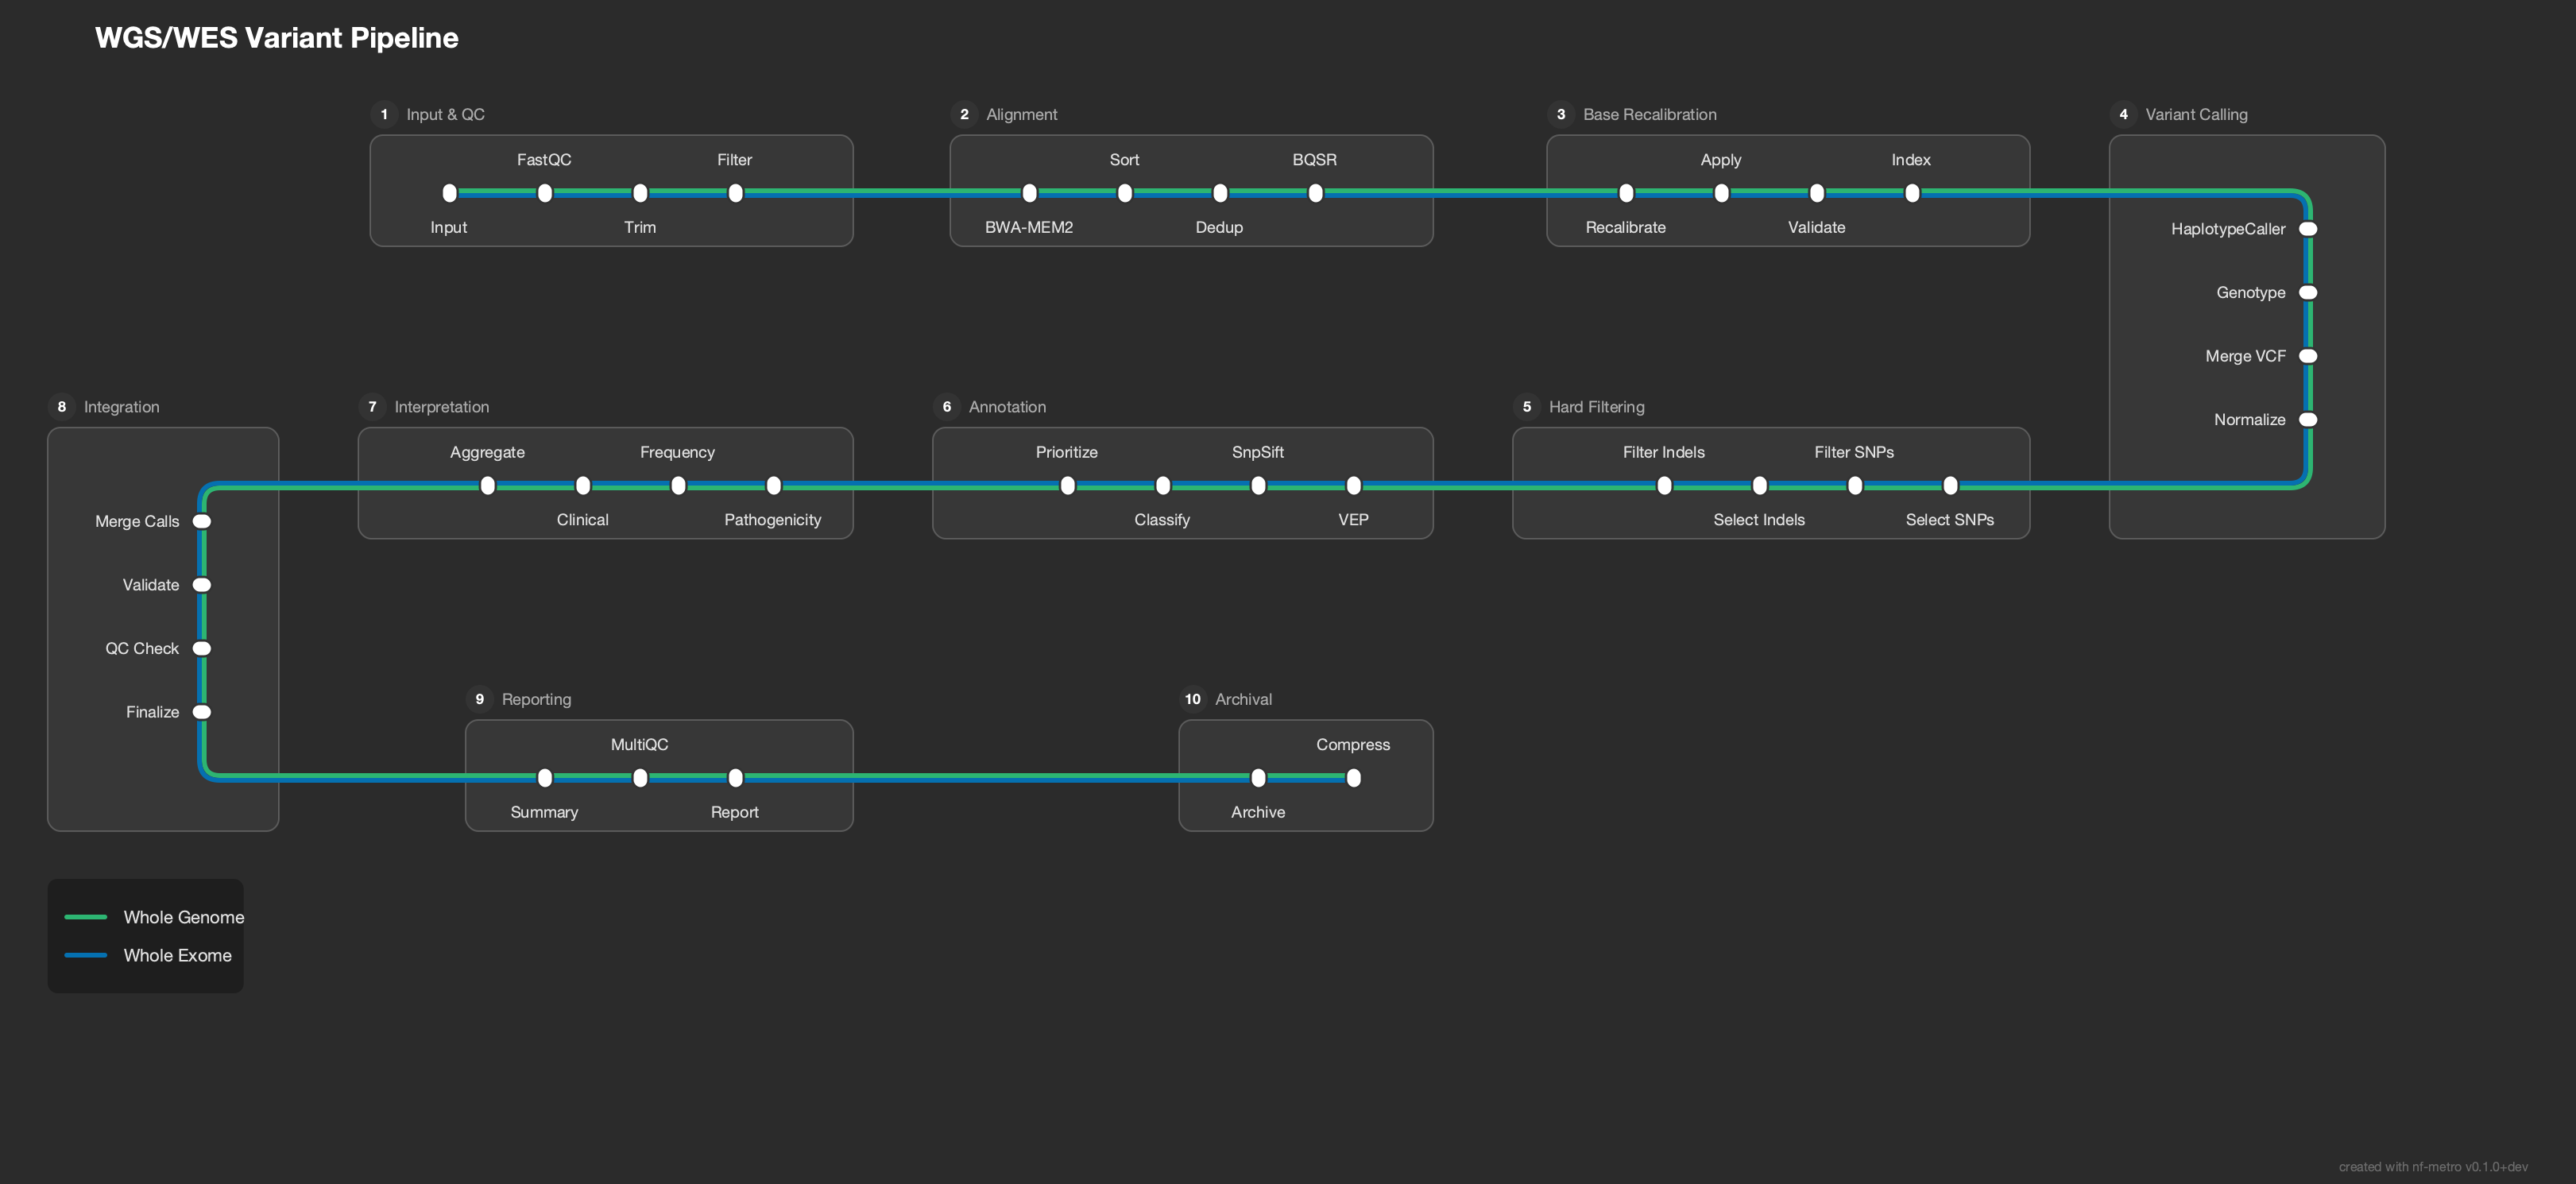 |
 |
 |
nf-metro is a command-line tool. Its Python modules are importable, but the internal
API (parser, layout engine, renderer) is not part of the public, semver-stable surface
and may change between releases without notice. Drive nf-metro through the nf-metro
CLI (or python -m nf_metro) for stable behaviour.
See the Contributing guide for setup, testing, how to add topology fixtures, working with layout invariants, and the visual review process.