Repository navigation
Home
A physical system-metrics dashboard: an ESP32 with a 1.14" display showing live CPU, RAM, storage, temperature and throughput for one machine or several - Windows, Linux or Mac - anywhere on the internet.
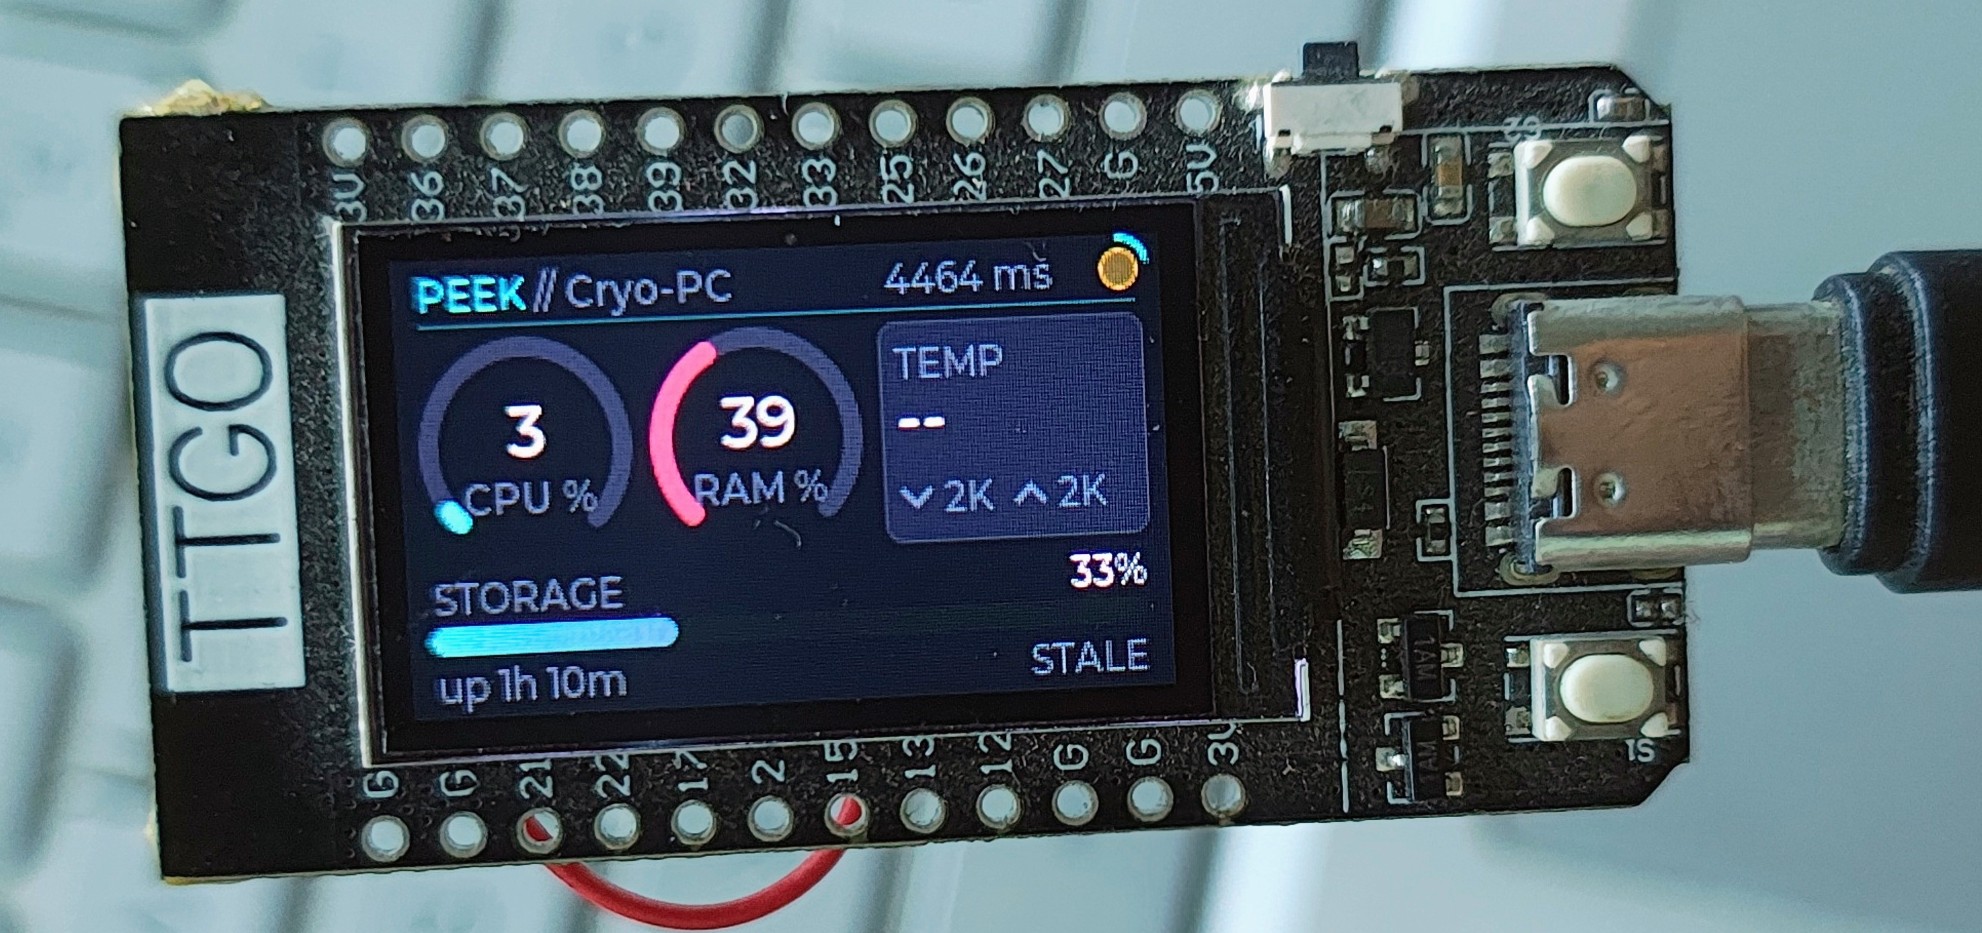
This wiki is the operational reference — what to set, in what order, and what to do when something is wrong. For what the project is and how it is built, see the README.
| Configuration Reference | Every value, where it lives, what it should be |
| Runbook | Bring-up in order, each step with a check |
| Troubleshooting | Symptom → cause |
| Screens | Every screen, photographed, and what each part means |
┌─────────┐   pushes    ┌────────────┐   polls    ┌────────┐
│ DietPi  │ ──────────▶ │ Cloudflare │ ◀───────── │ ESP32  │
│  agent  │   /ingest   │   Worker   │ /telemetry │ display│
└─────────┘             └────────────┘            └────────┘
Both ends dial out. Neither needs an inbound port, which is what makes this work behind CGNAT or on a network you do not administer.
No VPN is involved. The host reaches Cloudflare over the ordinary internet, the device does the same, and setup is one code shown on the device's screen.
An ESP32 cannot join a Tailscale network, which is what people reach for first. Tailscale is WireGuard plus a control plane - node registration, rotating keys, DERP relays - and none of that has an embedded client. A plain WireGuard tunnel was possible and this project used to do it, but it needed the monitored host to accept an inbound connection, which CGNAT rules out. The relay replaced it.
Configuration lives in four unconnected places — GitHub Actions secrets, Cloudflare Worker secrets, the device's setup portal, and the agent's command line. A value set in one never reaches another. Nearly every setup problem is a value in the wrong one, so Configuration Reference is the page to read first.