I studied Computer Science at Arizona State University(graduated May 2026, ~3.8 GPA), with a minor in Data Science.
My strongest background is in analytics and data science — working with data, finding patterns in it, and trying to make it legible to people who need to act on it. I've built dashboards, written pipelines, done exploratory analysis, and learned that most data problems are harder than they look.
Lately I've been getting curious about something adjacent: how the systems that produce and serve data actually work. The backend plumbing, the deployment story, what happens when a model hits production and breaks in a way your notebook never predicted.
I'm not an infrastructure engineer. But I'm genuinely trying to understand how modern AI and data systems are built, not just how to use them.
I use AI tools in my development process. They help me move faster, but I try not to use them as a reason to understand less.
- Exploratory data analysis and making sense of messy datasets
- Building dashboards and visualizations that communicate something true
- Writing SQL that does what you think it does
- Data workflows, cleaning, and the unglamorous parts of working with real data
- Applying ML and AI tools to practical problems
- Thinking through what a metric actually measures
- How backend systems are structured, and why those choices matter
- What retrieval-augmented generation actually does under the hood (not just the API)
- Production patterns for AI applications — latency, reliability, observability
- How deployed systems behave differently than notebook experiments
- Infrastructure basics — containers, CI/CD, what makes systems debuggable
I find learning by building more useful than learning by reading. So most of what's below came from trying to build something real and running into things I didn't understand.
ReadmitScope US · Live Dashboard
Healthcare analytics project on CMS Medicare hospital readmissions. I built the full workflow: live CMS data pull, cleaning, data quality logs, notebooks, statistical analysis, enrichment with hospital ownership/star ratings, and a deployed React dashboard.
Python pandas scipy scikit-learn React TypeScript Recharts Vercel
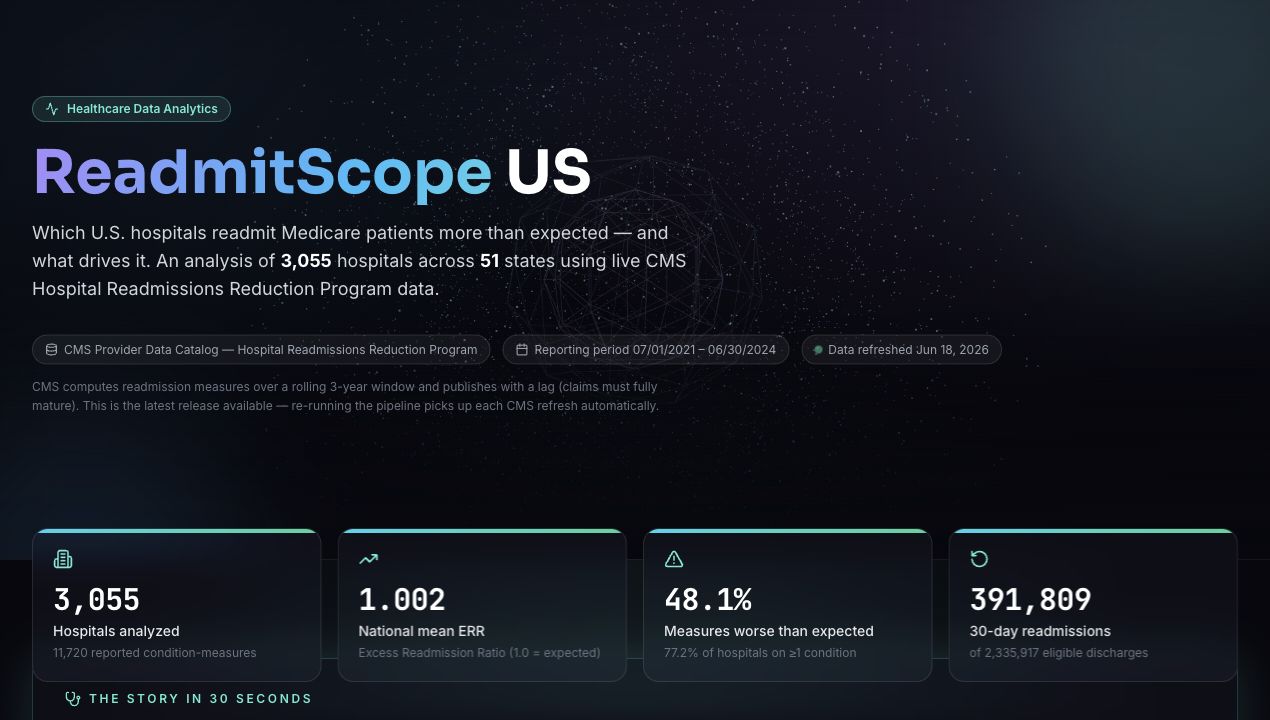
Signal: Data Analyst / Data Scientist — exploratory analysis, statistical testing, healthcare metric framing, deployed BI-style dashboard.
Interactive 3D cardiovascular risk explorer using the UCI Cleveland Heart Disease dataset. The app projects 297 patients into PCA space, supports k-means clustering, trains a logistic regression risk model, and lets users simulate a patient to inspect risk and top contributing features.
React TypeScript Three.js PCA k-means Logistic Regression Data Visualization
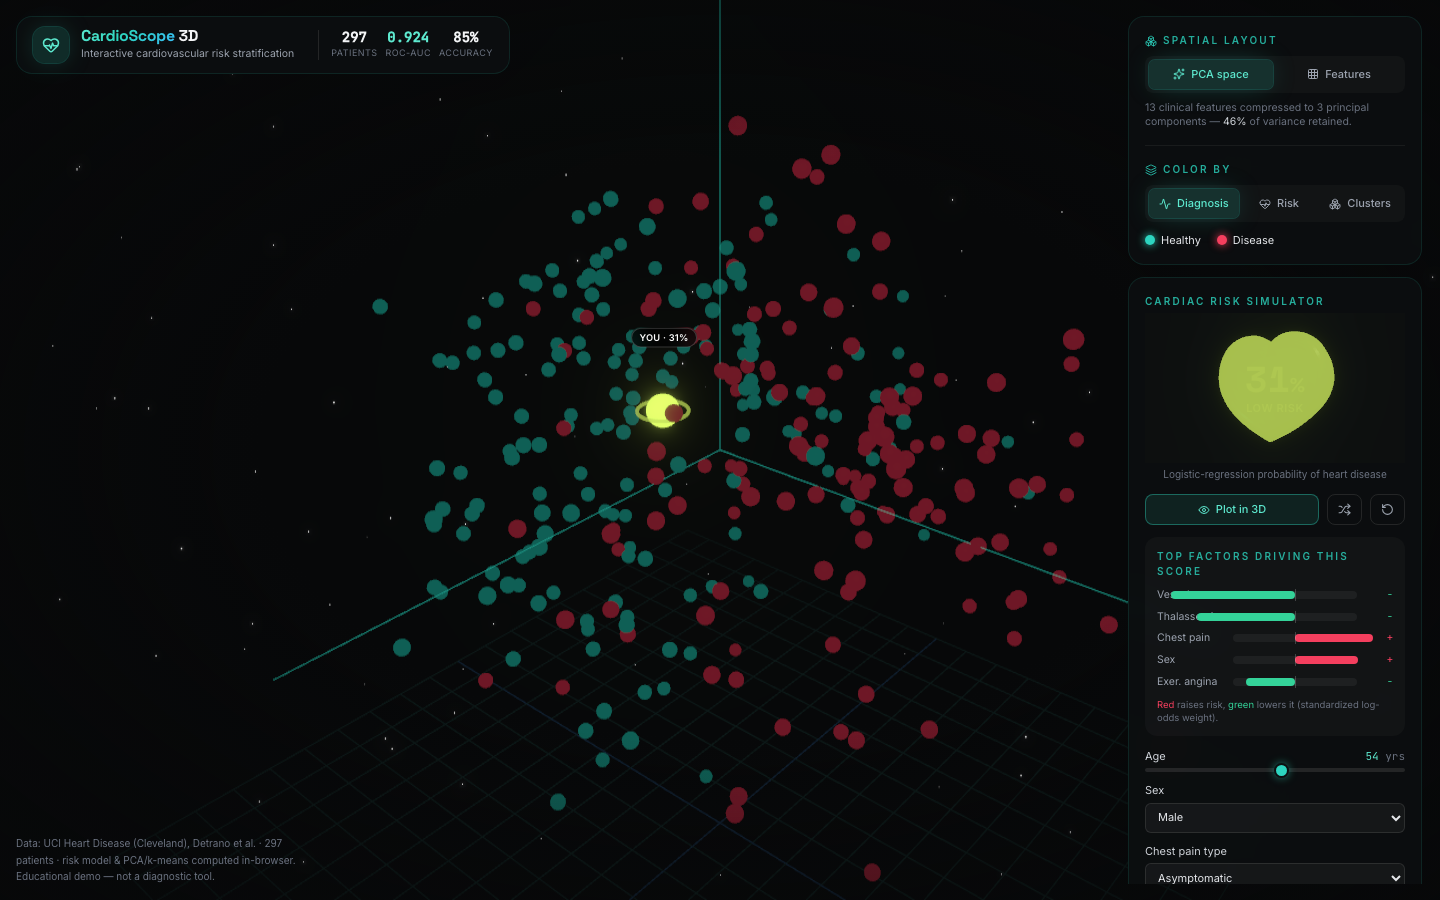
Signal: Data Scientist / Visualization Engineer — dimensionality reduction, clustering, predictive modeling, explainable feature contributions, interactive analytics UI.
Post-acquisition retail data integration project that consolidates parent and acquired-company data into a Databricks lakehouse. Implements Bronze/Silver/Gold layers, Delta MERGE upserts, S3 landing-zone ingestion, incremental processing, grain alignment, and a gold star-schema analytics view.
Databricks PySpark Delta Lake AWS S3 SQL Unity Catalog Data Engineering
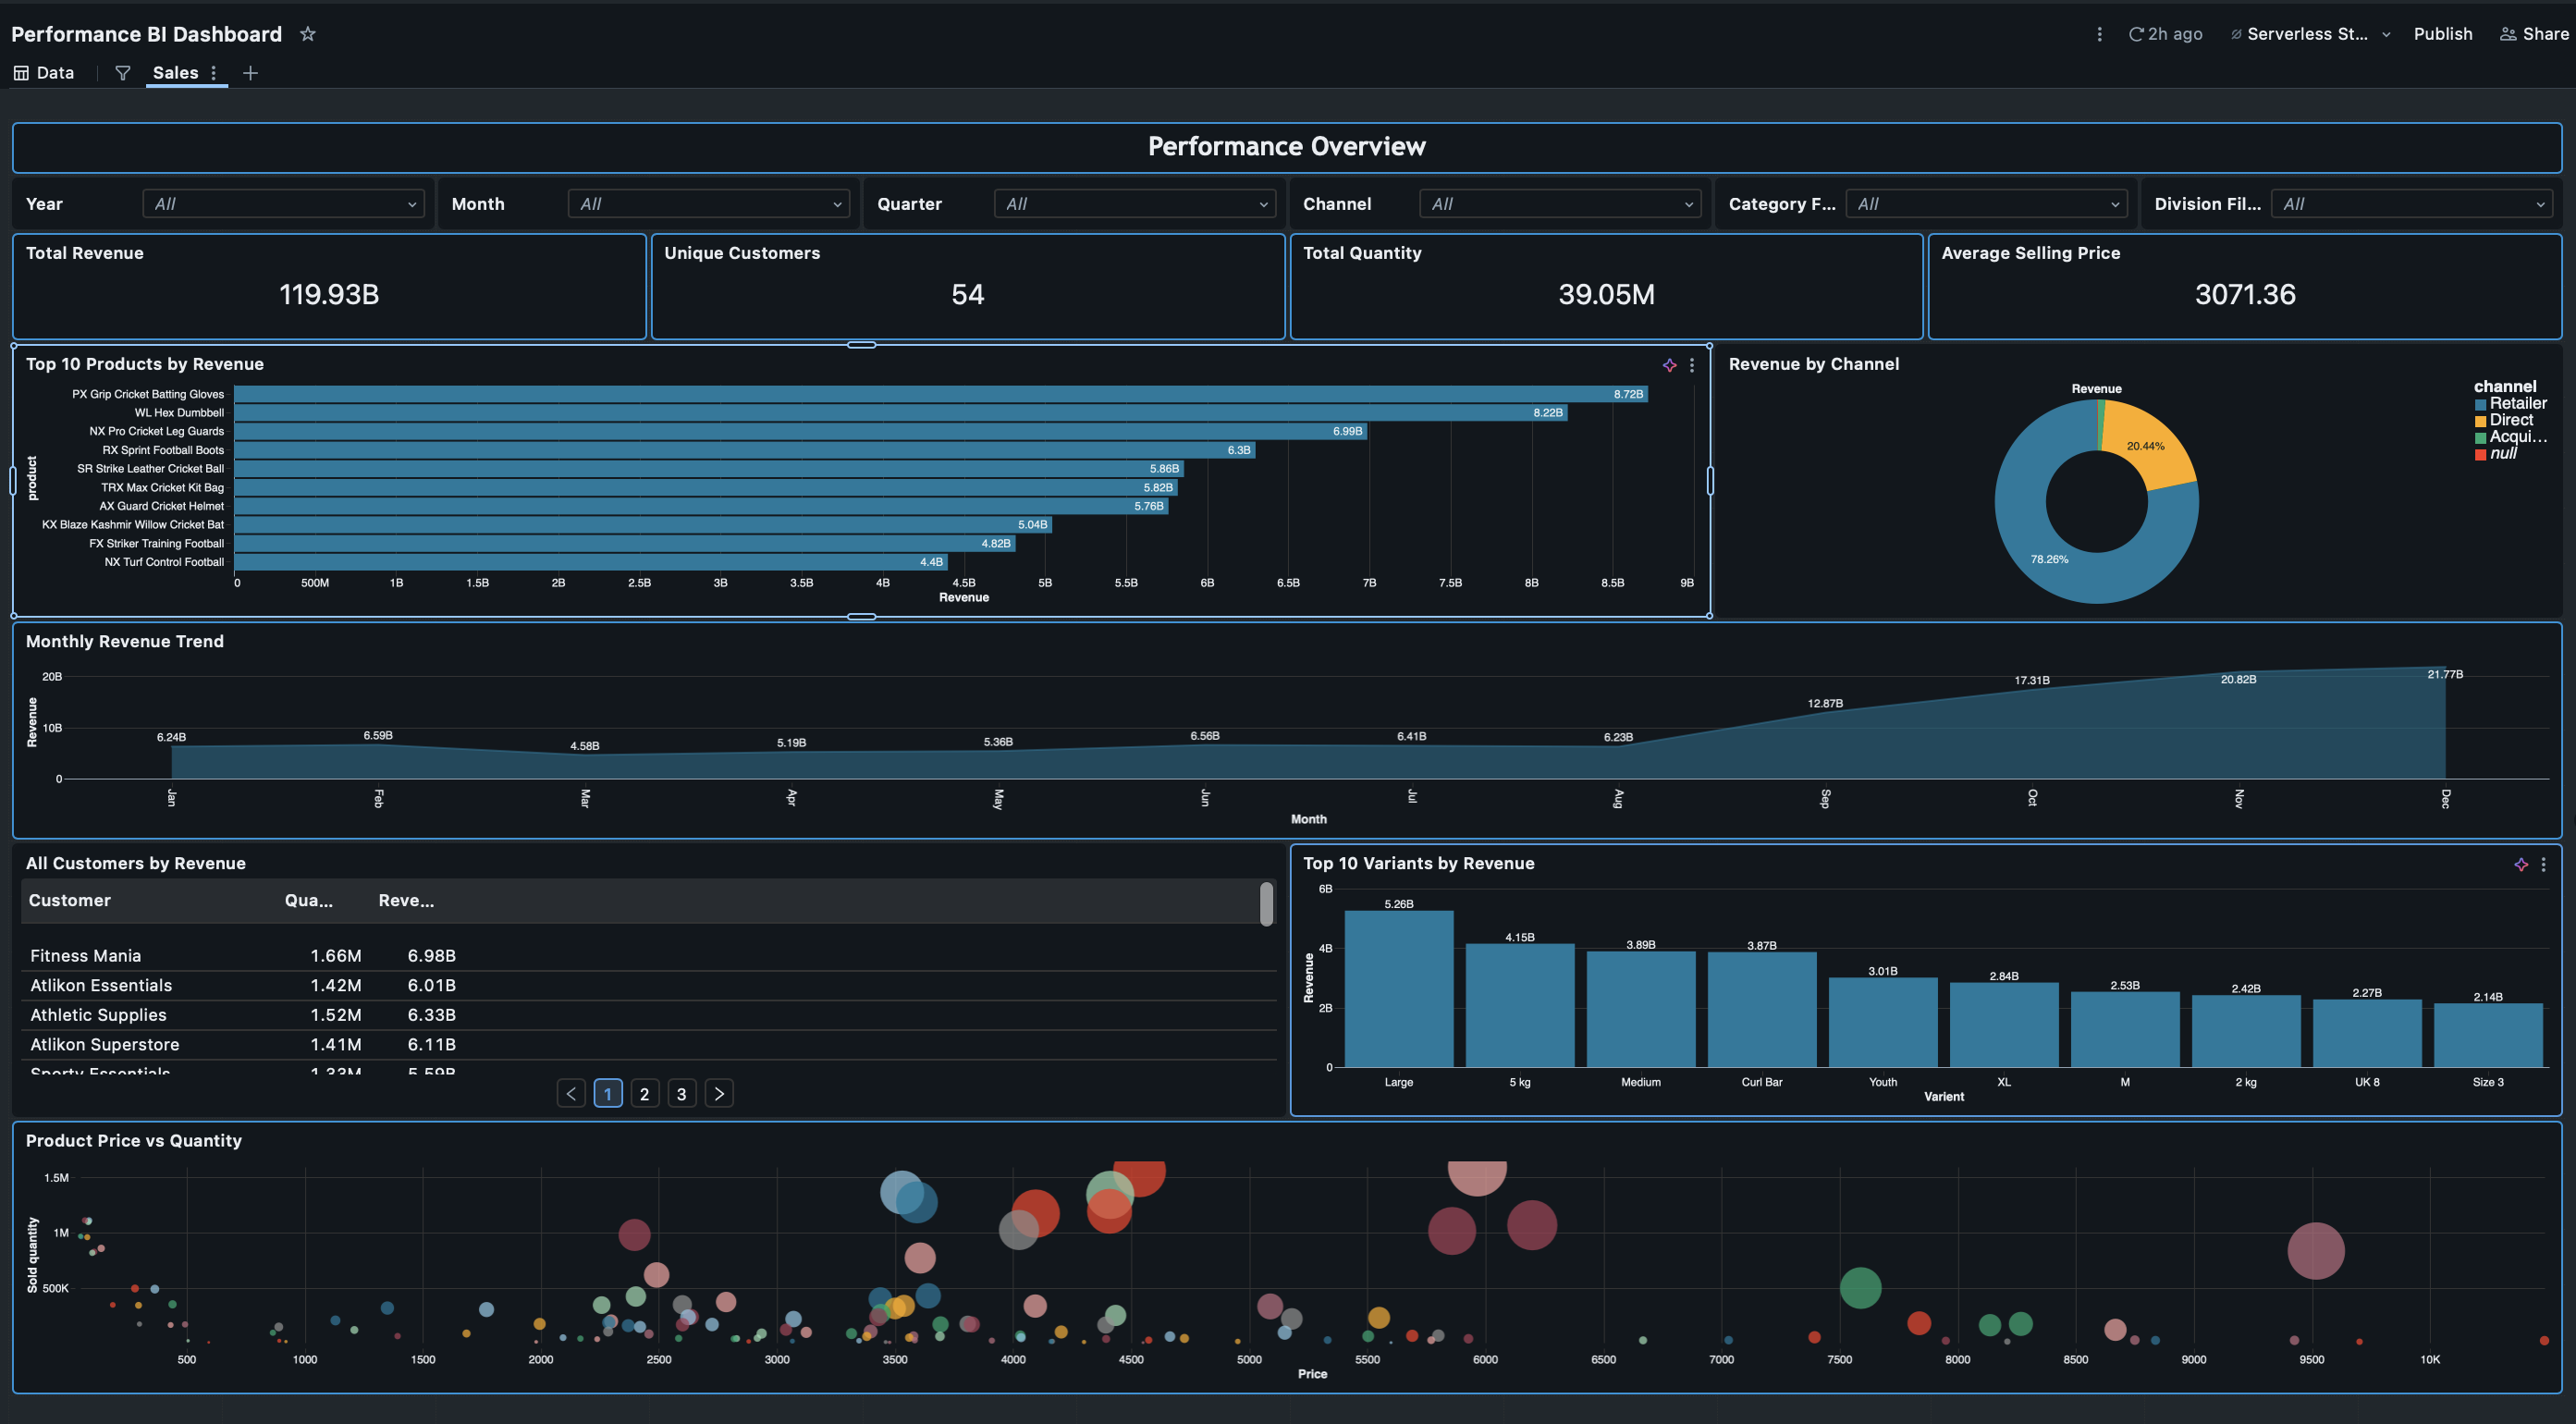
Signal: Data Engineer / Analytics Engineer — medallion architecture, schema harmonization, incremental loads, quality remediation, dashboard-ready data modeling.
SaaS Revenue & Churn Intelligence
Subscription analytics platform that turns raw billing events into MRR, ARR, NRR, GRR, churn, cohort retention, and customer health intelligence. The core model is a PostgreSQL MRR state machine using window functions and materialized views.
Python PostgreSQL SQL Streamlit Plotly Data Modeling Analytics Engineering
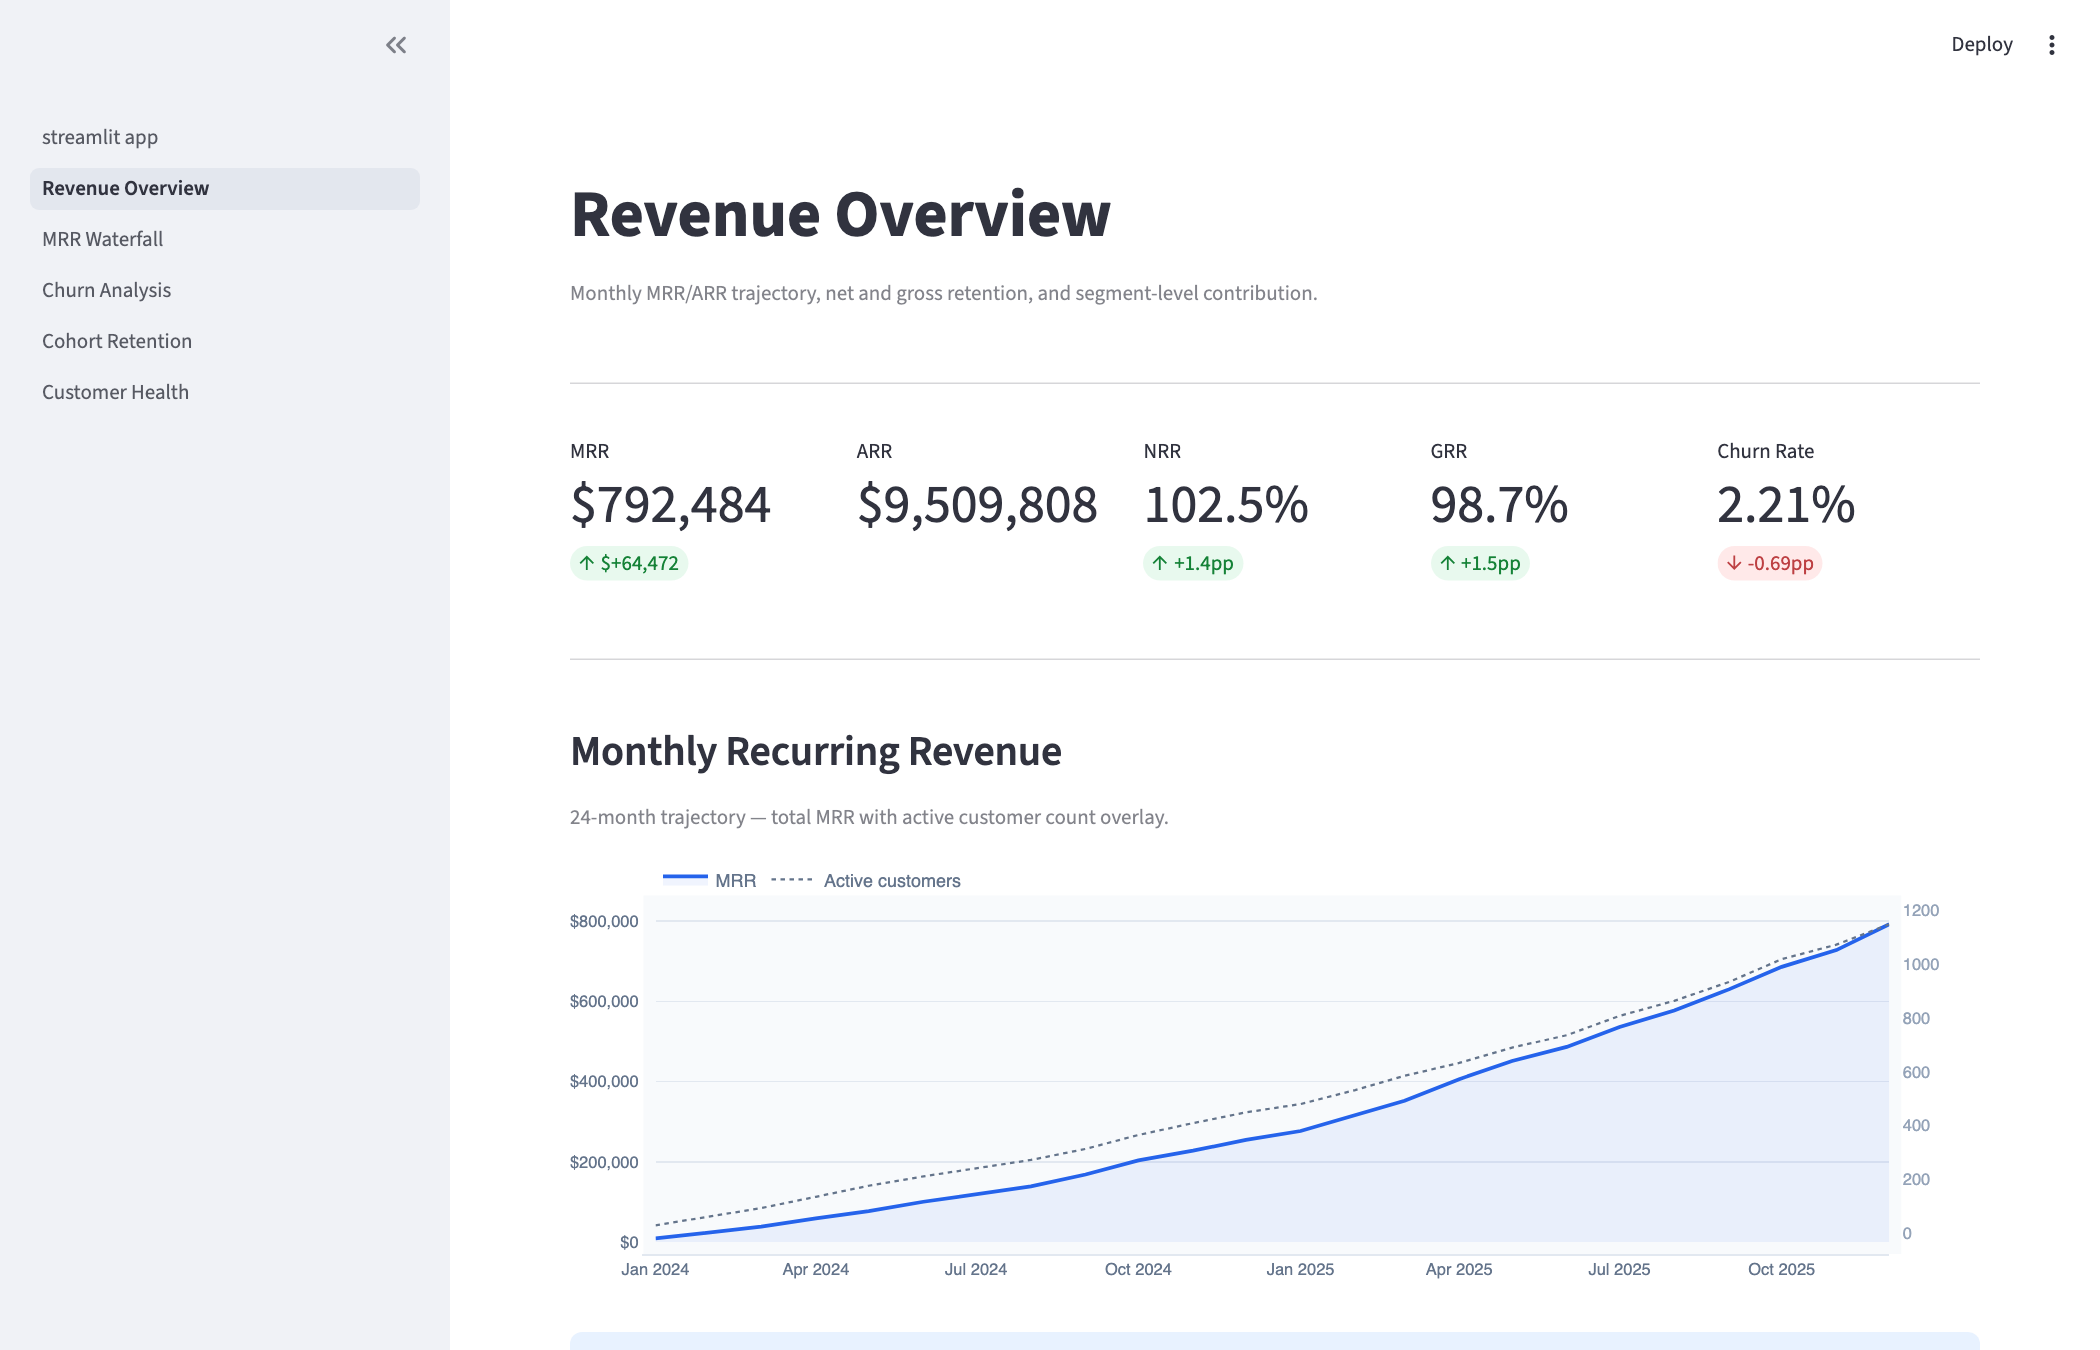
Signal: Data Analyst / Analytics Engineer — SaaS metric design, SQL modeling, synthetic data generation, validation checks, executive dashboarding.
Real-time transaction risk platform with an XGBoost fraud model, SHAP explanations, deterministic risk rules, drift monitoring, FastAPI backend, and Next.js dashboard. Designed to show the ML engineering loop from synthetic data to scoring API to monitoring.
Python XGBoost SHAP FastAPI PostgreSQL Redis Next.js ML Engineering
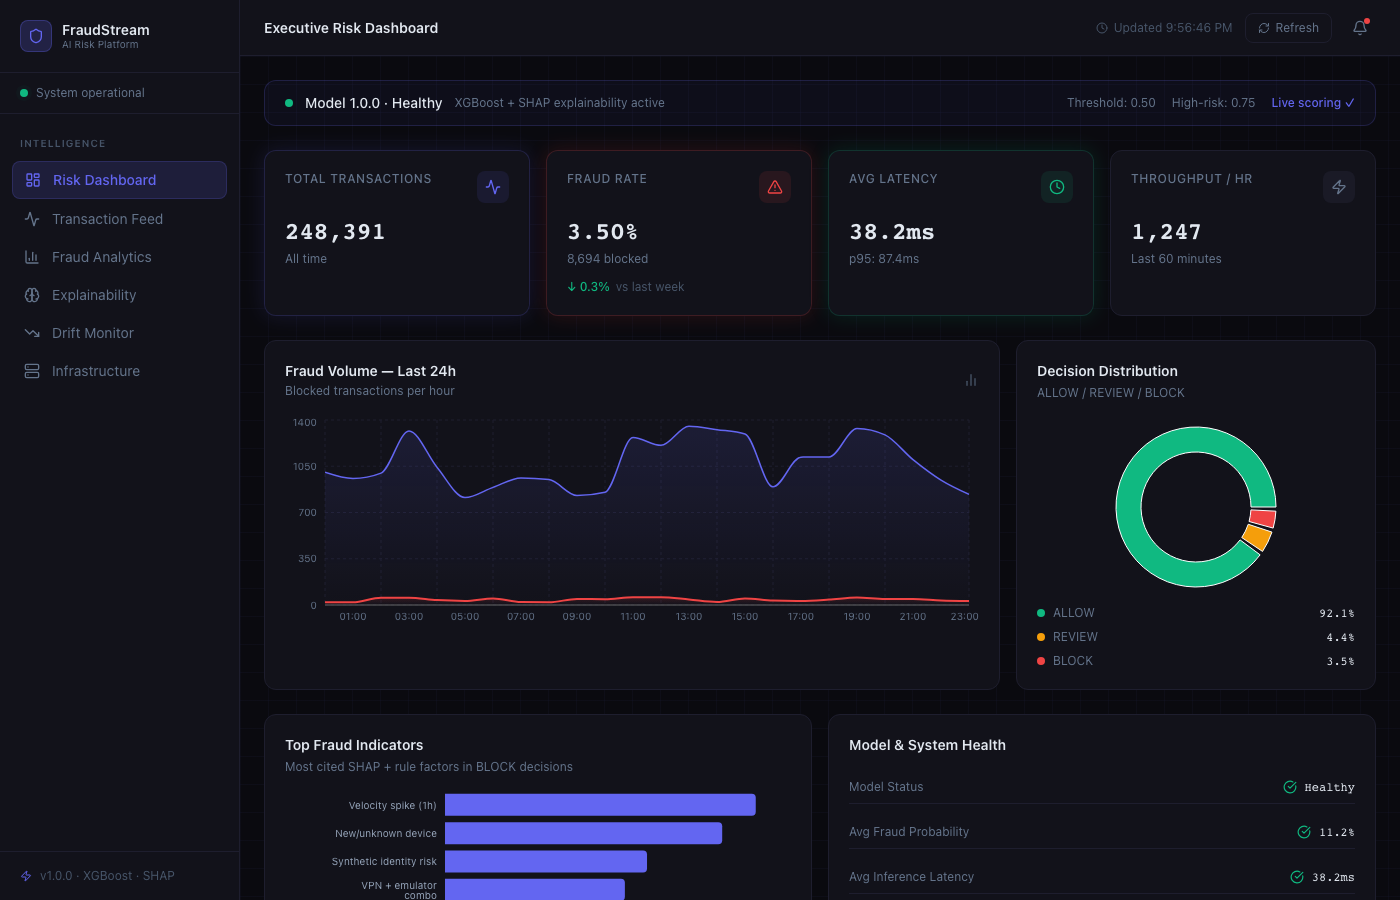
Signal: Data Scientist / ML Engineer — feature engineering, model evaluation, explainability, fraud rules, inference API, monitoring.
Geospatial analysis of agricultural intensity and nitrate contamination across Iowa counties from 2010-2017. Combines USDA crop acreage, EPA water-quality data, county shapefiles, correlation analysis, maps, trend plots, and clear limitations.
Python pandas GeoPandas Matplotlib SciPy Geospatial Analysis Jupyter
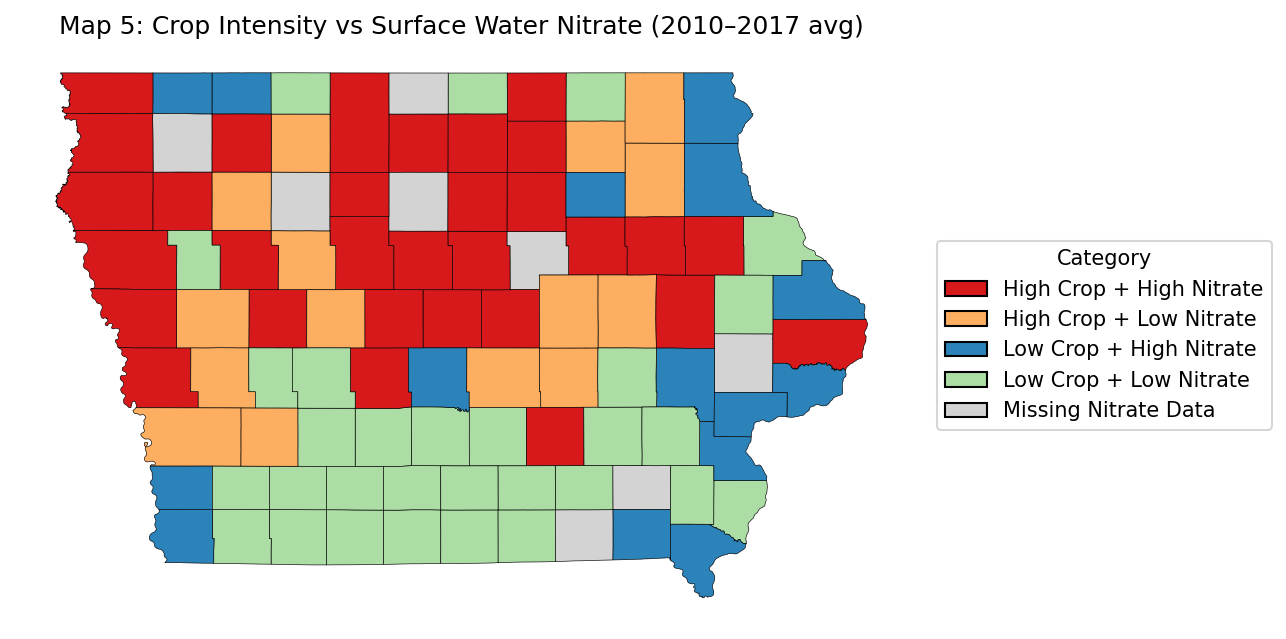
Signal: Data Analyst / Data Scientist — research framing, geospatial joins, correlation analysis, environmental data storytelling, statistical caveats.
At ASU's Community Engagement department ( Social Embeddedness ) , I worked as a data specialist — maintaining a database, building dashboards in Tableau and Power BI, and translating operational data into something decision-makers could actually use. That work shaped how I think about analytics: the visualization is the easy part, the hard part is understanding what question you're actually trying to answer.
Before that, I interned at a startup doing data work — pipelines, SQL validation, scraping. I learned that data quality problems are mostly discovered after someone has already trusted the bad data.
I'm from India, and I've been navigating school and career in the US as an international student. It's taught me to be resourceful and to not take shortcuts when I can't afford them.
- Why distributed systems fail in non-obvious ways
- How operational data can improve human decision-making (not replace it)
- The design of systems that are debuggable, not just functional
- What makes an AI feature actually useful in practice vs. impressive in a demo
- The gap between analytics and engineering — and what lives in it
Good analysis and good engineering both require the same thing: understanding the problem well enough to know which simplifications are safe.
The most useful AI tools are the ones that make people better at their jobs. The rest are demos.
"It works on my machine" is not the same as working.
Email: pvmmallipudi@gmail.com LinkedIn: linkedin.com/in/pavan-mallipudi
Still figuring things out. Enjoying the process.