Turn your Letterboxd diary into a contribution graph and shareable cards.
Runs as a GitHub Action, commits the finished SVGs back to your repository.





Quick Start • What It Generates • Configuration • CLI • How It Works • Pages Site • License
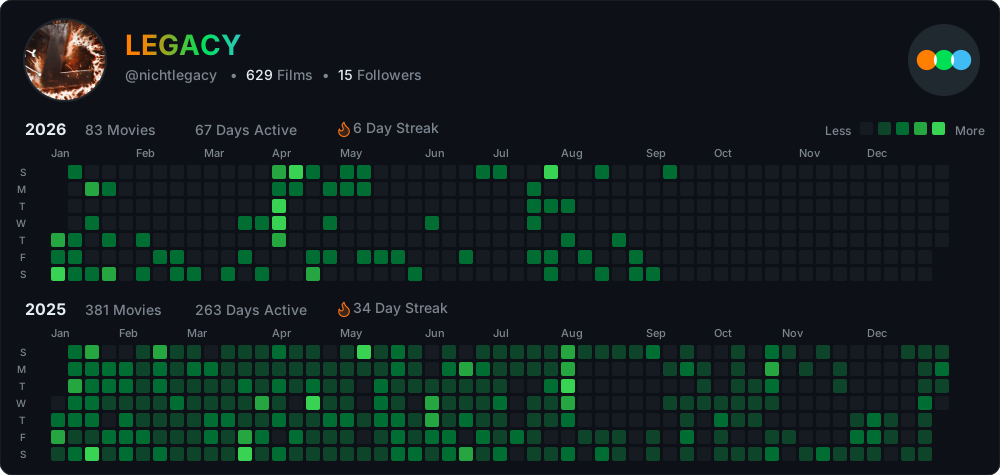
Letterboxd Graph reads a public Letterboxd diary and renders it as SVG: a GitHub-style activity calendar, a review card per year and per month, and a card for the profile itself. It also writes a JSON export and a CSV diary so you can build your own widgets from the same figures, plus small shields-style badges for a profile README.
It is meant to be embedded — in a GitHub profile README, a blog post, or a social preview. Everything is a self-contained SVG with the fonts subset and inlined, so there is nothing to host and nothing to load at view time.
It needs no Letterboxd account, API key, or server. It reads public profile pages only, and cannot see anything your profile does not show a logged-out visitor.
Add one workflow file to any repository. No fork, no copied scripts.
# .github/workflows/letterboxd.yml
name: Update Letterboxd Graph

on:
  schedule:
    - cron: "0 0 * * *"   # daily at midnight UTC
  workflow_dispatch:

permissions:
  contents: write

jobs:
  update-graph:
    runs-on: ubuntu-latest
    steps:
      - uses: actions/checkout@v4

      - uses: nichtlegacy/letterboxd-graph@v2
        with:
          username: YOUR_LETTERBOXD_USERNAME
          years: "last 2"           # this year and last, defaults to the current year
Run it once from the Actions tab. A healthy first run logs the diary pages
it fetched, then commits into images/:
Found 599 film entries, 456 in 2026, 2025
   Posters: 10/10, favourites 4/4
   ✓ images/github-letterboxd-dark.svg
   ✓ images/letterboxd-review-2026-dark.svg
   ✓ images/letterboxd-review-current-month-dark.svg
   ✓ images/letterboxd-profile-dark.svg
actions/checkout is required so the action has a repository to write into. To
handle the files yourself instead of committing them, set commit: 'false'.
Every run writes the same set of files into images/, each in a dark and a
light variant. Use <picture> so GitHub serves the one matching the reader's
theme — see Embedding.
github-letterboxd-{dark,light}.svg — the activity calendar, one block of weeks
per requested year.
Hovering reveals more than the graph shows at rest:
| Hover target | Reveals |
|---|---|
| Year label | Films grouped by release decade |
| Film count | Rating distribution, average rating, rewatch and like totals |
| Days Active | Weekday distribution |
| Day Streak | Date range, film count, and the streak highlighted in the grid |
| Any day cell | The films watched, ↻ for rewatches and ♥ for likes |
| Day Streak Highlight | Days Active Tooltip | Film Count Tooltip |
|---|---|---|
 |
 |
 |
Note
GitHub embeds SVGs through an <img> tag, which receives no mouse events, and
serves raw files with a sandbox CSP, so hover states and links are dead in a
README. They work on the Pages site, which embeds each card as
an <object>. The cell reveal animation is declarative CSS and does play
inside a README.
letterboxd-review-<year>-{dark,light}.svg — one card per year in review-years.
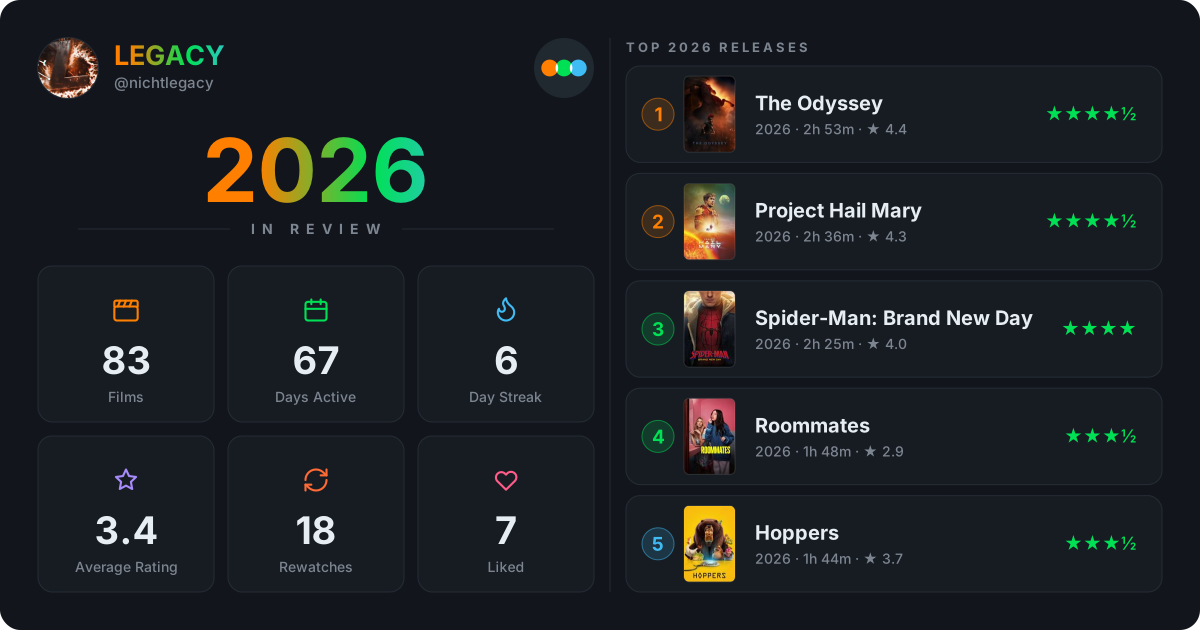
1200×630, the Open Graph default, so it works as a social preview as it stands. Headline figures on the left, top rated films on the right with poster art, runtime and the Letterboxd community rating.
What the list ranks is a choice, because "the best I saw in 2026" and "the best of 2026" are different claims:
top-films |
The list holds |
|---|---|
watched (default) |
Everything watched that year, whatever year it came out |
released |
Only the films released that year |
It applies to year cards only. A month is far too small a window to also demand the film came out that year — one month of new releases is a handful of titles at best and often none, so a month card always ranks everything watched.
The card above is set to released, which is why it carries a TOP 2026
RELEASES heading. The default needs no heading — everything watched is not a
restriction, so there is nothing to announce. The heading takes its space out of
the rows rather than off the bottom, so both columns end on the same line either
way.
top-films: watched — the default, for comparison

Same year, same diary. A five star film from 1977 outranks everything released that year, which is true but says nothing about the year itself.
letterboxd-review-current-month-{dark,light}.svg and
letterboxd-review-previous-month-{dark,light}.svg.
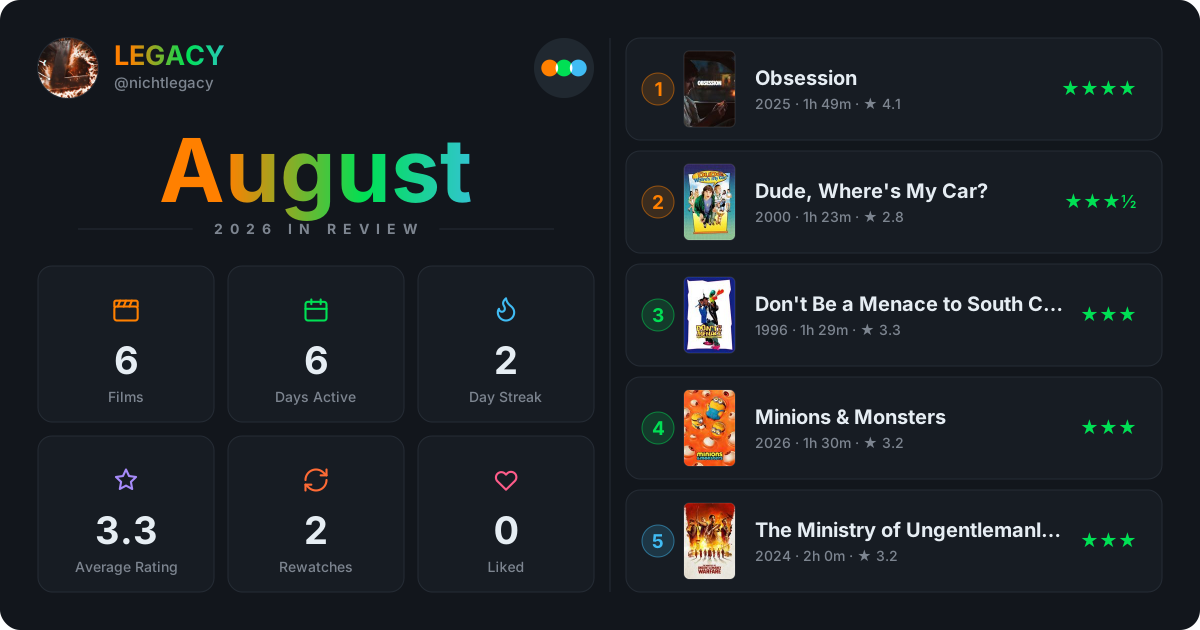
The same card narrowed to a single month. A month with nothing logged says so rather than rendering an empty list.
Its film list always ranks everything watched that month, whatever
top-films is set to.
The files are named by how recent the month is, not by its date, so an embed keeps working when the month turns over and old cards do not pile up.
letterboxd-profile-{dark,light}.svg — not tied to a year.
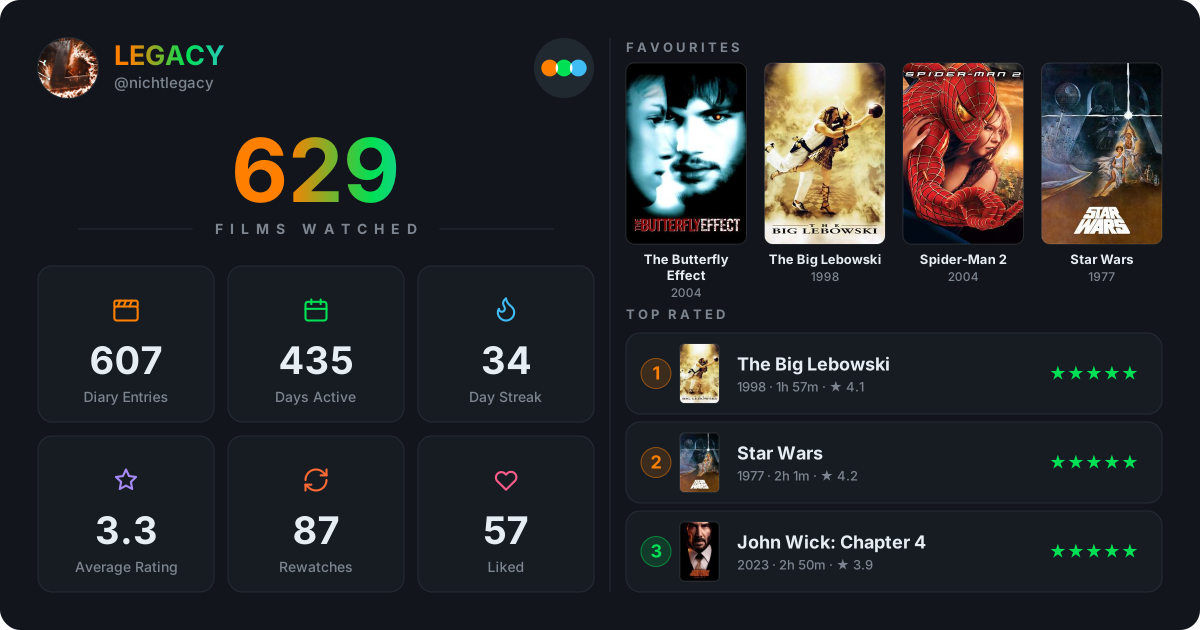
The headline is your all-time films watched, taken from the profile page. The right column shows the favourites pinned on your Letterboxd profile. What the figures below it cover depends on Diary Scope.
Pro and Patron members get their badge over the avatar, on the graph and on both cards.
| Status | Badge color | Placement |
|---|---|---|
| Patron | Cyan #40bcf4 |
Bottom-left of the profile picture |
| Pro | Orange #ff8000 |
Bottom-left of the profile picture |


badge-{films,rating,streak,days,liked,rewatches}.svg — small shields-style
badges for a profile README. One SVG per stat, no dark/light split, so the same
file works on both GitHub themes.

They are generated from the all-time figures (buildAllTimeStats in
src/stats.js:288), not just the graph years, so a badge stays the same
whether the graph shows one year or three.
| Stat | Badge label | Value | Color |
|---|---|---|---|
films |
films |
diary entries | green #00e054 |
days |
days active |
unique days with films | blue #40bcf4 |
streak |
day streak |
longest consecutive run | orange #ff8000 |
rating |
avg rating |
average of rated entries | orange #ff8000 |
liked |
liked |
liked entries | pink #ff5c8a |
rewatches |
rewatches |
repeat viewings | purple #a78bfa |
| Style | Height | Look |
|---|---|---|
dot (default) |
20px | pill with the three Letterboxd dots on the left |
pill |
20px | 1px border, accent dot — like the site's filter chips |
card |
20px | same as pill with radius 4, like a KPI tile |
flat |
20px | two-tone, no border — normal GitHub form in site palette |
flat-square |
20px | square, no outer radius |
for-the-badge |
28px | big uppercase |
plastic |
20px | flat with light top highlight |
Embed one badge (use the raw URL, not the blob URL):

Or all at once:


Configuration is action inputs, CLI flags or the .github/workflows/update-graph.yml env block:
# action
- uses: nichtlegacy/letterboxd-graph@v2
  with:
    username: YOUR_LETTERBOXD_USERNAME
    badge-style: "dot"                          # pill | card | dot | flat | flat-square | for-the-badge | plastic
    badge-stats: "films,rating,streak,days"     # any of films,days,streak,rating,liked,rewatches
# CLI
node src/cli.js nichtlegacy --badge-style dot --badge-stats films,rating,streak,daysBadges are committed to images/ like the cards. Change badge-stats later and a stale badge file is removed on the next run.
All badges in all styles

All 6 stats × 7 styles at a glance (films 605 · rating 3.3 · streak 34 · days 433 · liked 57 · rewatches 85). dot is the default. Each badge is badgeSvg(label,value,{style}) from src/badge.js:99.
letterboxd-data.json — every figure the cards use, for building your own
widgets. letterboxd-diary.csv — one row per diary entry, newest first, for
spreadsheets and ad-hoc analysis. See JSON Export below.
All options are action inputs. Only username is required.
| Input | Description | Default |
|---|---|---|
username |
Letterboxd username (required) | – |
years |
Contribution graph years: last N or a list like 2026,2025 |
current year |
review-years |
Year cards: all, last N, or a list like 2026,2025; all uses every year in the fetched diary |
all |
scope |
Diary scope: all or years |
all |
month-cards |
Recent months to also make cards for, 0 to skip |
2 |
top-films |
Year card film list: watched or released |
watched |
mode |
Cell coloring: count or rating |
count |
week-start |
sunday or monday |
sunday |
gradient |
Gradient text: true, false, name or year |
true |
animate |
Cell reveal animation | true |
export-png |
Also write PNG files | false |
badge-style |
Badge style: dot (default), pill, card, flat, flat-square, for-the-badge, plastic |
dot |
badge-stats |
Comma-separated badge stats: films, rating, streak, days, liked, rewatches |
films,rating,streak,days |
output |
Output path without extension | images/github-letterboxd |
commit |
Commit and push the generated files | true |
commit-message |
Commit message (branch and UTC timestamp appended) | Update Letterboxd graph |
node-version |
Node.js version | 22.12 |
install-browser-deps |
Install Puppeteer system libraries (Ubuntu runners) | true |
Outputs svg-dark, svg-light and data-json carry the paths written, for
chaining into an upload or deploy step.
years controls the contribution graph. last 2 is read as this year and last
on the day the run happens, so the graph rolls over on its own; a pinned
2026,2025 keeps drawing 2025 all through 2027, and nothing in the run looks
wrong while it does. review-years controls the year cards independently. Its
default all creates one card for every year present in the fetched diary, while
a list or last N limits the cards deliberately. Cards for a year that drops out
of the selection are deleted on the next run.
Alternative: fork and run the CLI directly
To own the whole workflow instead, fork this repository and edit
.github/workflows/update-graph.yml. Its env block is the configuration:
env:
  LETTERBOXD_USERNAME: "YOUR_USERNAME"
  YEARS: "last 2"                      # this year and last, or a list like "2026,2025"
  REVIEW_YEARS: "all"                  # every year in the fetched diary, or a selection
  SCOPE: "all"                         # "all" reads the whole diary — needed for all-time figures
  MONTH_CARDS: "2"                     # this month and last month, 0 to skip
  TOP_FILMS: "watched"                 # year cards rank "released" that year or everything "watched"
  MODE: "count"                        # cell colour: "count" of films or average "rating"
  WEEK_START: "sunday"                 # "sunday" or "monday"
  GRADIENT: "true"                     # "true" for colored name, "false" for white
  ANIMATE: "true"                      # "false" to disable the cell reveal animation
  EXPORT_PNG: "false"                  # "true" to also generate PNG files
  BADGE_STYLE: "dot"                   # pill | card | dot | flat | flat-square | for-the-badge | plastic
  BADGE_STATS: "films,rating,streak,days"   # any of films,rating,streak,days,liked,rewatches
This is the path this repository uses itself, except that it calls the action
through uses: ./ so every scheduled run doubles as an end-to-end test of what
external consumers get.
npm install
node src/cli.js <username> [options]| Flag | Description | Default |
|---|---|---|
-y <years> |
Contribution graph years: last N or a list like 2026,2025 |
current year |
--review-years <years> |
Year cards: all, last N, or a list like 2026,2025 |
all |
-s <scope> |
Diary scope: all or years |
all |
-c <count> |
Recent months to also card, 0 to skip |
2 |
-r <scope> |
Year card film list: watched or released |
watched |
-m <mode> |
Graph mode: count or rating |
count |
-w <day> |
Week start: sunday or monday |
sunday |
-g <targets> |
Gradient text: true, false, name or year |
true |
-a <bool> |
Cell reveal animation | true |
-p |
Also export PNG files | off |
--badge-style <style> |
Badge style: dot (default), pill, card, flat, flat-square, for-the-badge, plastic |
dot |
--badge-stats <list> |
Badge stats: films, rating, streak, days, liked, rewatches |
films,rating,streak,days |
-o <path> |
Output path without extension | images/github-letterboxd |
# Two graph years, cards for every year in the diary
node src/cli.js nichtlegacy -y 2026,2025 --review-years all

# Only the requested year, no month cards
node src/cli.js nichtlegacy -y 2025 -s years -c 0

# Only that year's releases in the card list
node src/cli.js nichtlegacy -y 2025 -r released

# Rating mode, week starting Monday, plain text, with PNGs
node src/cli.js nichtlegacy -m rating -w monday -g false -p

# Badges: plastic style, only films + streak + days active
node src/cli.js nichtlegacy --badge-style plastic --badge-stats films,streak,daysBy default the complete diary is fetched, so the profile card can report all-time figures. Paginating it costs one request per 50 entries:
| Profile | Films watched | Diary entries | Requests |
|---|---|---|---|
| @nichtlegacy | 626 | 599 | 12 |
| @BeHaind | 3,653 | 1,254 | 26 |
| @Rufus_Firefly | 5,848 | 3,783 | 76 |
The two counts differ because they measure different things:
- Films watched is the profile's own figure, linking to
/<user>/films/. It counts every film marked watched, whether or not it was ever given a date. - Diary entries are dated log entries. Only these carry a rating, a rewatch flag or a like, so everything on the cards below the headline comes from them.
@BeHaind has 3,653 films watched against 1,253 distinct films in the diary, so roughly two thirds were ticked off without a diary entry. Only the diary drives the request count, which is why a large library can still be cheap to fetch.
A viewing counts as a rewatch if Letterboxd's flag is set or the same film appears earlier in the diary. Neither signal alone is enough:
- The flag is set by hand, so a repeat logged without ticking it is missed. On @nichtlegacy that is 30 of 83 rewatches.
- Repeats alone miss a film first seen before the diary begins, which has only one entry in it. On @Rufus_Firefly that is 761 viewings — every rewatch they have.
Films are identified by the slug in their diary link, not by title. Titles are not unique, and neither is title plus year: two different 2023 films are both called Leo. @Rufus_Firefly has 55 titles that are actually different films, so matching on the title alone would invent rewatches and merge unrelated films in the ranking.
The graph covers the years in years; year cards cover review-years. Under the
default scope: all, both are filtered from the same complete fetch rather than
requested again. Set scope: years to fetch only the graph years — cheaper on a
large diary, but it leaves the profile card and review-years: all scoped to the
years that were fetched.
Films on the cards are ranked by rating first. Likes and rewatches only decide the order within a rating:
score = rating + 0.30 if liked + 0.08 per extra viewing, capped at 0.16
The bonuses total less than a half-star step, so a film can never overtake one rated higher. This matters more than it sounds: a typical year has a handful of films at the top rating and a dozen tied one step below, so without it the last slots would be filled in whatever order the diary returned. Repeat viewings of one film merge into a single entry at its best rating.
count — intensity from how many films you watched that day, scaled to your
busiest day. The legend reads Less to More.

rating — colour from the average rating of that day's films. The legend
reads Low to High, and a quiet day you loved outranks a busy one you did
not.

| Average that day | Step |
|---|---|
| under 2.5★ | lowest |
| 2.5★ to 3★ | second |
| 3.5★ to 4★ | third |
| 4.5★ and up | highest |
The average covers the films you rated. An unrated film sharing the day does not drag it down, and a day where you rated nothing sits on the lowest step — it has no rating to show, but it is still visibly a day with films on it.
images/letterboxd-data.json holds the same figures the cards use, so a Glance
custom-api widget needs no extra backend:
https://raw.githubusercontent.com/<github-user>/letterboxd-graph/main/images/letterboxd-data.json
Payload shape
{
  "user": "nichtlegacy",
  "year": 2026,
  "stats": { "films": 123, "daysActive": 80, "streak": 7, "streakFilms": 11, "rewatches": 18, "liked": 19 },
  "cells": [
    {
      "date": "2026-02-16",
      "count": 2,
      "ratingAvg": 3.5,
      "films": [
        { "title": "Film A", "year": "2024", "rating": 3.5, "rewatch": false, "liked": true, "url": "https://letterboxd.com/..." }
      ],
      "url": "https://letterboxd.com/<user>/films/diary/for/2026/02/16/"
    }
  ],
  "recent": [
    { "date": "2026-02-16", "title": "Film A", "year": "2024", "rating": 3.5, "rewatch": false, "liked": true, "url": "https://letterboxd.com/..." }
  ],
  "allTime": {
    "scope": "all",
    "films": 626, "entries": 599, "distinctFilms": 517,
    "firstEntry": "2019-05-05", "lastEntry": "2026-07-30", "spanDays": 2644,
    "daysActive": 427, "rewatches": 83, "liked": 76, "rated": 540, "averageRating": 3.3,
    "perDay": 0.23, "perWeek": 1.6, "perMonth": 6.9,
    "streak": { "length": 34, "startDate": "2025-01-27", "endDate": "2025-03-01", "films": 47 },
    "busiestDay": { "date": "2025-04-16", "count": 5 },
    "longestGap": { "days": 61, "from": "2021-02-03", "to": "2021-04-05" },
    "perYear": [{ "year": 2025, "films": 381, "days": 263 }],
    "perWeekday": [65, 65, 55, 59, 62, 69, 81],
    "perMonthOfYear": [51, 44, 39, 47, 38, 30, 41, 33, 29, 36, 34, 37],
    "monthSeries": [{ "month": "2026-02", "count": 12 }],
    "ratings": [{ "rating": 3.5, "count": 125 }],
    "decades": [{ "decade": 2020, "label": "2020s", "count": 89, "averageRating": 3.5 }],
    "mostRewatched": [{ "title": "Half Baked", "year": "1998", "url": "https://letterboxd.com/...", "views": 5, "averageRating": 4.5 }],
    "milestoneStep": 100,
    "milestones": [{ "n": 100, "kind": "step", "date": "2025-03-08", "title": "Film B", "year": "2004", "rating": 3, "url": "https://letterboxd.com/..." }]
  }
}
stats and cells are scoped to the years in years, the same window the graph
draws. allTime covers everything the run fetched, which under the default
scope: all is the whole diary — films is the profile's own count, entries
the dated ones. It is aggregates only, so it stays a few kilobytes whatever the
diary weighs, and scope says which of the two it was built from.
images/letterboxd-diary.csv — one row per diary entry, newest first, for
spreadsheets, q or any ad-hoc analysis. Same source as the JSON, but flat:
https://raw.githubusercontent.com/<github-user>/letterboxd-graph/main/images/letterboxd-diary.csv
| Column | Content |
|---|---|
date |
Watch date YYYY-MM-DD (UTC, as Letterboxd stores it) |
title |
Film title |
year |
Release year |
rating |
0.5–5 or empty if unrated |
rewatch |
1 if rewatch, 0 otherwise (flag or repeat-derived) |
liked |
1/0 |
reviewed |
1/0 |
url |
Letterboxd film URL |
reviewUrl |
Review URL if the entry carries one |
slug |
Film slug (dune-part-two) |
filmUid / lid |
Stable Letterboxd identifiers when present |
Always written alongside the JSON. Header row is included, values are RFC 4180
escaped, UTF-8, LF — opens directly in Excel, Numbers or pandas.read_csv.
# quick check
head images/letterboxd-diary.csv
q "SELECT rating, count(*) FROM 'letterboxd-diary.csv' GROUP BY rating"Poster, runtime and the community average on the cards all come from the film
page itself (src/fetcher.js:1018). Those pages were fetched on every run for
the 20–30 films that make the cards — the same 30 posters every day. The
generator now keeps images/.film-cache.json alongside the SVGs: keyed by the
canonical film URL, 30-day TTL, capped at 3000 entries. The cache is committed,
so the next daily run only fetches films it has not seen before. Stale entries
are re-fetched automatically; deleting the file forces a full refresh.
Point at the raw file, not the blob URL — GitHub serves blob as HTML and the
image will not render. If the image should open with the complete SVG, link it
to the SVG served by your Pages site. GitHub renders README images as <img>,
while the Pages deployment serves the SVG with the correct content type.
<a href="https://YOUR_GITHUB_USERNAME.github.io/YOUR_REPOSITORY/images/github-letterboxd-dark.svg">
  <picture>
    <source media="(prefers-color-scheme: dark)"
            srcset="https://raw.githubusercontent.com/YOUR_GITHUB_USERNAME/letterboxd-graph/main/images/github-letterboxd-dark.svg">
    <source media="(prefers-color-scheme: light)"
            srcset="https://raw.githubusercontent.com/YOUR_GITHUB_USERNAME/letterboxd-graph/main/images/github-letterboxd-light.svg">
    <img alt="Letterboxd contribution graph"
         src="https://raw.githubusercontent.com/YOUR_GITHUB_USERNAME/letterboxd-graph/main/images/github-letterboxd-light.svg">
  </picture>
</a>
Swap the filename for letterboxd-review-2026, letterboxd-review-current-month
or letterboxd-profile to embed a card instead. Badges are single-file embeds:
A README has room for one card, maybe two, and a card has room for a headline and ten films. The same files are also published as a page, which has neither limit — the cards at full size, and the figures behind them read out at length.

| Section | What is on it |
|---|---|
| A Life in Film | The opening: profile avatar and headline figures, with an All Time/year selector that updates the statistical sections without reloading the page |
| When you watched | A column per month for All Time and every Monday–Sunday week for a selected year, empty periods included; weekday distribution, weekly and monthly averages, busiest day, fullest month, longest streak, longest quiet stretch, watched-day share and seasonal pattern — plus a figure per year, written out rather than drawn |
| On this day | When the snapshot date has been logged in an earlier year, the films watched on that calendar date, grouped by viewing year and linked back to their diary entries; when there is nothing to remember, the section stays hidden |
| Breakdown | Donuts compare films watched in their release year with older titles, first watches with rewatches, and—when reviews exist—reviewed with not reviewed. Counts and percentages stay visible without hover |
| How you rated | The half-star histogram, empty steps kept, beside the average, the most given rating and how much is rated or liked at all |
| What you reached for | Films by release decade with counts, share and average rating, plus the five you went back to most |
| Where it turned over | The first entry, the round numbers after it, and the latest, on one track. milestoneStep scales with the diary — every 25th at a hundred entries, every thousandth at five thousand — so the row holds its length instead of growing a marker per hundred |
| The cards | Graph, profile, a tab per year, a tab per month — the finished month opens first, tabs cross-fade and the URL updates to #card-2025 (or #card-current-month) so a card can be deep-linked. Each card has Copy image, Copy SVG, Copy embed and Open SVG, also available on right click |
| Recent diary | The last sixteen entries from the JSON export, newest first, in two columns; rewatches and likes stay marked. The full Diary is searchable across title, release year, slug and watch date (diary.html?q=blade+runner or ?released=1999) |
| Use them yourself | Three short paths: copy a responsive embed, run the action on your own diary, or publish a Pages site like this one. The footer links back to the Letterboxd profile, source and JSON export |
The figures cover whatever the run fetched — the whole diary under scope: all,
the graph years under scope: years, which the page says out loud rather than
passing narrow numbers off as all-time. Year entries, rating steps, decade rows,
milestones and diary films link back to their matching Letterboxd pages.
Selecting a year writes ?year=2025 into the URL and switches the hero, charts,
breakdowns and milestones. The generated cards and Recent Diary remain the same
snapshot, independent of that statistical view.
The page follows the system theme until switched, then keeps the chosen dark or
light card set. Sticky navigation, smooth section movement and a back-to-top
control keep the long page usable; on a phone the section links become a
horizontal strip. Card embeds load as they scroll into view, and a missing
generated export gets a retryable error state instead of an empty page. For
sharing, the build also writes og-2025.png, og-2024.png and og-profile.png
alongside og.png — one 1200×630 PNG per year/profile from the already
committed SVGs.
Publishing it for your own profile
Which route you take depends on which Quick Start you took.
If you forked this repository, everything is already in place. Set
LETTERBOXD_USERNAME in .github/workflows/update-graph.yml, then open
Settings → Pages and set Source to GitHub Actions. Run Update
Letterboxd Graph + JSON Export once from the Actions tab; the deploy
follows on its own, and the site lands at
https://<github-user>.github.io/<repository>/.
For a custom domain, configure it under Settings → Pages; the build takes the deployed address from GitHub automatically.
If you added the action to a repository of your own, copy four things across:
| Copy | Why |
|---|---|
site/ |
the page: one HTML file, one stylesheet, one module |
scripts/build-site.mjs |
assembles _site/ and writes the two files the page reads |
src/stats.js |
the aggregates behind the figures; the build imports it |
fonts/ |
Inter as .woff2, plus its license |
.github/workflows/pages.yml |
builds and deploys on every generator run |
Then:
- In
pages.yml, set theworkflows:list underworkflow_runto thename:of your own generator workflow. GitHub matches it by name, not by filename, and a name that matches nothing simply never fires. Checkbranches:against your default branch while you are in there. - Your
package.jsonneeds"type": "module"—build-site.mjsimportssrc/stats.js, and without it Node reads that file as CommonJS and the build dies on theexportkeyword. - Keep the
npm cistep inpages.yml. The build usessharpto rasterise the Open Graph preview; without it the page still deploys, but its preview image is missing. - Leave
commitat its default. The build readsimages/out of the repository and fetches nothing, so the files have to be committed for it to have anything to publish. - Settings → Pages → Source → GitHub Actions, then run the generator once.
A private repository needs a paid plan for Pages; a public one does not.
To preview any of it locally, generate the images once and serve the build:
npm run build:site     # writes _site/
npm run serve:site     # builds, then serves it on :8080
The build only reads images/, so previewing costs no requests against
Letterboxd. Deploys can also be triggered by hand from the Actions tab,
which is how a branch gets published before it is merged.
Running through the action needs nothing on your side; the runner provides it all. For local runs:
| Requirement | Why |
|---|---|
| Node.js ≥ 22.12 | Required by Puppeteer 25 and sharp v0.35 |
Python 3 with curl_cffi |
The primary fetcher, and needed for the Python tests — pip install curl_cffi |
| A public Letterboxd profile | Only pages a logged-out visitor can see are read |
Without curl_cffi the fetcher falls back to Puppeteer, which is bundled but
markedly slower and more prone to being challenged.
Project structure
src/cli.js— argument parsing and the run ordersrc/fetcher.js— diary, profile and film page scrapingsrc/fetch_with_curl_cffi.py— primary fetcher, Puppeteer is the fallbacksrc/generator.js— contribution graph SVGsrc/cards.js— review and profile card SVGssrc/badge.js— shields-style badge SVGssrc/film-cache.js— persistent film detail cache (images/.film-cache.json)src/svg-utils.js— font subsetting, text measurement, theme colorssrc/stats.js— streaks, distributions, JSON exportsrc/exporter.js— PNG rasterisation and poster thumbnailssite/— the Pages front end: one page, one stylesheet, one modulescripts/build-site.mjs— assembles_site/, writes the manifest the page readsaction.yml— the reusable actiontests/—node:testfor the JavaScript,unittestfor the fetcher
npm test          # both suites
npm run test:js   # statistics, cards and layout
npm run test:py   # the curl_cffi fetcher
The layout tests read geometry out of the generated markup rather than asserting on fixed coordinates, so padding and column changes do not break them spuriously.
Issues and pull requests are welcome.
- Bugs — include the username, the flags or inputs used, and the run log. Scraping breaks when Letterboxd changes its markup, and the log usually points straight at the selector that stopped matching.
- Features — open an issue first if it changes the output. The cards are tightly laid out and most additions cost space somewhere else.
- Pull requests — run
npm testfirst. New behaviour needs a test; layout changes should assert on measured geometry, not on coordinates.
Released under the MIT License.
Not affiliated with, endorsed by, or connected to Letterboxd. It reads public
profile pages, so it depends on their markup and can break when that changes. Be
considerate with scope: all on a large diary — it is one request per 50 entries
against someone else's servers.