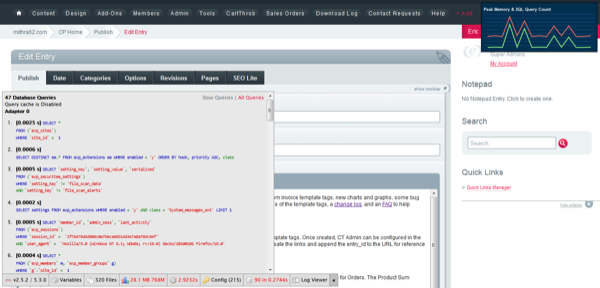
Memory History
The Memory History extension for the Debug Toolbar (EEDT) tracks various performance statistics across multiple pages and provides a graph to show the variances.
Memory History is not a traditional panel extension. Instead of adding a panel Memory History adds a positionable graph of the various performance points of your ExpressionEngine site over time. There is a dedicated graph for both the Control Panel (for add-on devs) and the "front site".
Keep in mind that the data is locked to your ExpressionEngine session ID so logging in/out will reset the tracking statistics.
The below are the performance points tracked:
- Memory Usage
- Query Count
- Execution Time
You can position the Memory History graph in any of the 4 quadrants:
- top left
- top right
- bottom left
- bottom right.
You can change these values either in the EEDT Settings page or through EEDT Config Overrides like the below:
<?php
$config['ee_debug_toolbar']['memory_history_position'] = 'top right';