Instructors:
Course materials for Metis' Introduction to Data Science Course in San Francisco (9/6/16 - 10/20/16)
###Schedule:
- Install Git.
- Create an account on GitHub.
- It is not necessary to download "GitHub for Windows" or "GitHub for Mac"
- Install SourceTree and sign into your github account through it.
- Install slack and get the necessary credentials to communicate on the metis slack channels.
- Install the Anaconda distribution.
- Complete exercises 1-7, 13, 18-21, 27-35, 38, 39 of Learn Python The Hard Way
- Watch the linear algebra review videos from Andrew Ng’s excellent Coursera ML course. They are labeled III. Linear Algebra Review (Week 1).
- Complete the exercises in chapters 2 and 3 of this open textbook. )

-
Welcome
-
Briefly discuss the course project and public data sources
-
Short Intro to Git / Github
-
Intro to SourceTree
-
Wrap up: Getting help, course schedule, office hours
Homework:
- Finish whatever exercises from LPTHW you couldn't finish. I assigned a lot of exercises as prework, so I suspect you have some things to work on. Focus on those concepts in the lecture that you didn't quite get.
- If your laptop has any setup issues, please work with me or someone else at Metis to resolve them by Thursday.
Git Resources (IF you don't want to use Sourcetree):
- Pro Git is an excellent book for learning Git if you don't want to use SourceTree. Read the first two chapters if you want to gain a deeper understanding of version control.
- If you want to really practice a lot of Git (and learn many more commands), try Git Immersion.
- GitRef is an excellent reference guide for Git commands.
- Pair Monty Hall Problem
- Introduction to Linear Algebra in Python (notebook)
- Introduction to Statistics in Python (notebook)
Homework:
- Work through as much of the NumPy quickstart guide as you can.
- Work through the remainder of the statistics exercises in the prework.
- Using Pandas for Exploratory Data Analysis notebook
- Using Pandas for More Exploratory Data Analysis notebook
Resources:
- The Pandas API Reference is well documented.
- To learn more Pandas, review this three-part tutorial.
- If you want to go all in on Pandas (and NumPy), the book Python for Data Analysis was written by the creator of Pandas. It is really great.
- Here are examples of different types of joins in Pandas, for when you need to figure out how to merge two DataFrames.
- Visualization with Pandas and Matplotlib
Visualization Resources:
- Watch Look at Your Data (18 minutes) for an excellent example of why visualization is useful for understanding your data.
- Plotting in Pandas notebook
- The visualization page from the official Pandas documentation is fantastic.
- This notebook on matplotlib or this similar notebook are both very good for showing you how to use matplotlib effectively.
- To explore different types of visualizations and when to use them:
- This PowerPoint presentation from Columbia's Data Mining class contains lots of good advice for properly using different types of visualizations.

- Read this excellent blog post on understanding bias and variance. It explains the basic tradeoff that all machine learning algorithms attempt to address in one way or another. This is also known as the "No Free Lunch" theorem.
Machine Learning Resources:
- For an in-depth introduction to machine learning, read section 2.1 (14 pages) of Hastie and Tibshirani's excellent book, An Introduction to Statistical Learning.
- For a preview of some of the machine learning content we will cover during the course, read Sebastian Raschka's overview of the supervised learning process.
- For fun, look up the characteristics of your zip code, and then read about the 67 distinct segments in detail.
Model Evaluation Resources:
- For another explanation of training error versus testing error, the bias-variance tradeoff, and train/test split (also known as the "validation set approach"), watch Hastie and Tibshirani's video on estimating prediction error (12 minutes, starting at 2:34).
- Caltech's Learning From Data course includes a fantastic video on visualizing bias and variance (15 minutes).
- Random Test/Train Split is Not Always Enough explains why random train/test split may not be a suitable model evaluation procedure if your data is time-based.
- Ensembles: From Decision Trees to Random Forests notebook
Resources:
- scikit-learn's documentation on ensemble methods covers both "averaging methods" (such as bagging and Random Forests) as well as "boosting methods" (such as AdaBoost and Gradient Tree Boosting).
- For an intuitive explanation of Random Forests, read Edwin Chen's answer to How do random forests work in layman's terms?
- Interpretable vs Powerful Predictive Models: Why We Need Them Both is a short post on how the tactics useful in a Kaggle competition are not always useful in the real world.
- Clustering (notebook)
- K-means: visualization
- DBSCAN: visualization
Clustering Resources:
- scikit-learn's documentation on clustering compares many different types of clustering.
- For a very thorough introduction to clustering, read chapter 8 (69 pages) of Introduction to Data Mining (available as a free download), or browse through the chapter 8 slides.
- An Introduction to Statistical Learning has a useful video on K-means clustering (17 minutes).
- Fun examples of clustering: A Statistical Analysis of the Work of Bob Ross (with data and Python code), How a Math Genius Hacked OkCupid to Find True Love.
- Feature Engineering/Cross Validation notebook
Feature Engineering/Selection Resources:
- Machine Learning Mastery: An Introduction to Feature Selection
- StandardScaler
- Here is a longer example of feature scaling in scikit-learn, with additional discussion of the types of scaling you can use.
- Section 3.3.1 of An Introduction to Statistical Learning (4 pages) has a great explanation of dummy encoding for categorical features.
- These examples may help you to better understand the process of feature engineering:
Cross-Validation Resources:
- scikit-learn documentation:
- scikit-learn issue on GitHub: MSE is negative when returned by cross_val_score
- Section 5.1 of An Introduction to Statistical Learning (11 pages) and related videos:
- K-fold and leave-one-out cross-validation (14 minutes)
- Cross-validation the right and wrong ways (10 minutes)
- Scott Fortmann-Roe: Accurately Measuring Model Prediction Error
- Harvard CS109: Cross-Validation: The Right and Wrong Way
- Journal of Cheminformatics: Cross-validation pitfalls when selecting and assessing regression and classification models
- Feature Decomposition and Regularization: PCA, Lasso/L1 Regularization, Ridge/L2 Regularization notebook
PCA Resources
- Jeremy Kun's blog is an excellent source of "mathy" explanations of a variety of algorithms and approaches used in Data Science, but I find his explanation of PCA is especially good.
- Sebastian Raschka's explanation of PCA is also very informative. In general, you should use/understand the method as more for explanatory than for predictive purposes.
Regularization Resources:
- This notebook from chapter 7 of Building Machine Learning Systems with Python has a nice long example of regularized linear regression.
- The scikit-learn user guide for Generalized Linear Models explains the different variations of regularization.
- Section 6.2 of An Introduction to Statistical Learning (14 pages) introduces both ridge regression and lasso regression. Or, watch the related videos on ridge regression (13 minutes) and lasso regression (15 minutes).
- Caltech's Learning From Data course has a great video introducing regularization (8 minutes) that builds upon their video about the bias-variance tradeoff.
- For a math-ier explanation of regularization, watch the last four videos (30 minutes) from week 3 of Andrew Ng's awesome and famous machine learning course, or read the related lecture notes compiled by a student.
- There are some special considerations when using dummy encoding for categorical features with a regularized model. This Cross Validated Q&A debates whether the dummy variables should be standardized (along with the rest of the features), and a comment on this blog post recommends that the baseline level should not be dropped.
- Advanced model evaluation and data pipelines notebook
- Null accuracy
- Confusion matrix
- Sensitivity, Specificity, Recall, Precision, all the metrics
- ROC curves and AUC
- Data Pipelines
ROC Resources:
- Rahul Patwari has a great video on ROC Curves (12 minutes).
- An introduction to ROC analysis is a very readable paper on the topic.
- These lesson notes from a course at the University of Georgia (my alma mater!) include some simple, real-world examples of the use of ROC curves.
- ROC curves can be used across a wide variety of applications, such as comparing different feature sets for detecting fraudulent Skype users, and comparing different classifiers on a number of popular datasets.
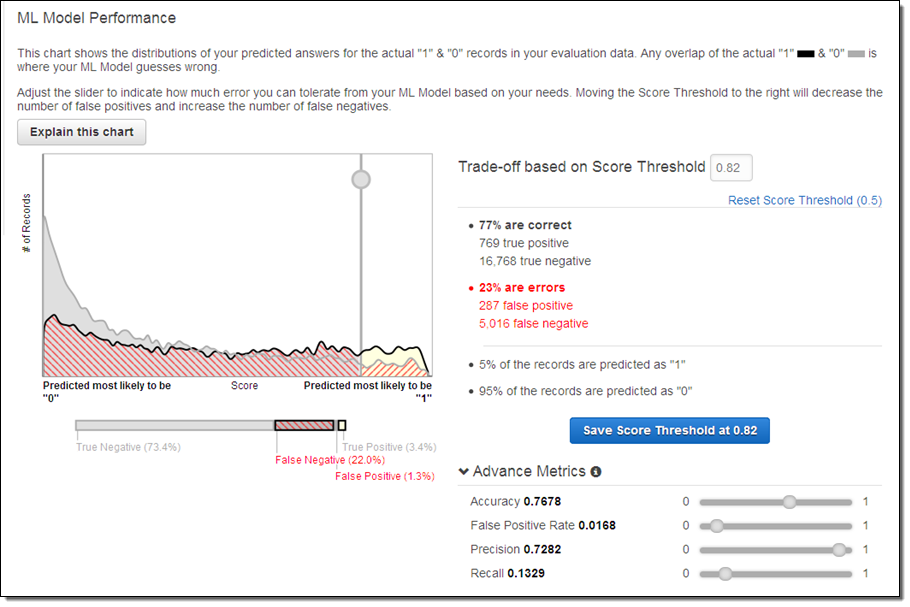
- This blog post about Amazon Machine Learning contains a neat graphic showing how classification threshold affects different evaluation metrics.
- scikit-learn has an incredibly active mailing list that is often much more useful than Stack Overflow for researching a particular function.
Pipeline Resources:
- Pipeline: chaining steps into a single, repeatable data flow
- Practical Data Science in Python is a long and well-written notebook that includes the use of scikit-learn's Pipeline.