Use the recording functionality to get a video of the scenario you want to train your model on.
Using a tool like Shotcut, export the video into single frames.

You can now use a tool like labelstudio and start labelling the images according to the classification in classes you need.
To start Label Studio as a container:
podman run -d --replace --name label-studio -e LABEL_STUDIO_LOCAL_FILES_SERVING_ENABLED=true -e LABEL_STUDIO_LOCAL_FILES_DOCUMENT_ROOT=/label-studio/files -v /home/luca/apac-ai:/label-studio/files --privileged -p 8081:8080 -v /home/luca/label-studio:/label-studio/data heartexlabs/label-studio:latestSetup local storage on Label Studio like shown (check instructions here)

We can also add a YOLO backend to help us annotate quicker like shown if needed.
Let's setup the Project as object classification.


After you complemented manual labelling you can export the labelled set into YOLO format

Now copy the images to the images folder and then separate them into train and validation (follow this process)
You can run the training in a dedicated container starting first a dedicated ultralytics containaer like this:
sudo podman run -it --replace --name ultralytics --device nvidia.com/gpu=all --shm-size=4g --privileged -v /home/luca/dataset:/ultralytics/dataset ultralytics/ultralytics:latest-jetson-jetpack6 The shm-size parameter is to make sure the container is assigned enough shared memory to spin up enough torch workers
... and then starting the training inside the container like this (this took me approx 30 minutes on the Jetson Orin):
yolo detect train data=config.yaml model=yolo11n.pt epochs=50 imgsz=640Once you completed the training in the container you should see at the end of the executiong something like this:
50 epochs completed in 0.401 hours.
Optimizer stripped from /ultralytics/runs/detect/train/weights/last.pt, 5.5MB
Optimizer stripped from /ultralytics/runs/detect/train/weights/best.pt, 5.5MB

Validating /ultralytics/runs/detect/train/weights/best.pt...
Ultralytics 8.3.156 🚀 Python-3.10.12 torch-2.5.0a0+872d972e41.nv24.08 CUDA:0 (Orin, 7290MiB)
YOLO11n summary (fused): 100 layers, 2,582,542 parameters, 0 gradients, 6.3 GFLOPs
                 Class     Images  Instances      Box(P          R      mAP50  mAP50-95): 100%|██████████| 7/7 [00:04<00:00,  1.53it/s]
                   all        200        257      0.976      0.977      0.975      0.658
                Defect         30         30      0.959      0.967      0.955       0.53
                 Piece        200        227      0.993      0.987      0.995      0.786
Speed: 0.5ms preprocess, 11.2ms inference, 0.0ms loss, 3.2ms postprocess per image
Results saved to /ultralytics/runs/detect/train
💡 Learn more at https://docs.ultralytics.com/modes/train
You can now export the trained model from the container to use it in the Python defect detection app.
cp -r /ultralytics/runs/detect /ultralytics/dataset/You can find the results of running the defect detection app with the trained best.pt model here
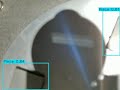
- Nvidia Jetson Orin Nano Dev Kit with Jetpack 6.2+ (Jetson Linux 36.5+)
- Python 3.8+
- pip package manager
- An MQTT broker (like Mosquitto) accessible on the network.
- A YOLO model file (e.g., best.pt) trained for defect detection.
- Grab the latest Jetson Linux tar file (v36 can be found here)
- Set the Nvidia platform in Recovery Mode: connect female to female cable between pin 9 and 10 (FC REC - GND)
- Install the following packages on the RHEL host that is connected via USB-C recovery cable to Nvidia device:
sudo dnf install minicom dtc binutils usbutils lz4 - Connect your RHEL host computer to the appropriate USB port on your Jetson developer kit (make sure of the side of the USB-C cable plugged into the Nvidia Device).
- Open a terminal window on your host computer and enter command
lsusb. The Jetson module is in Force Recovery Mode if you see the message:
Bus <bbb> Device <ddd>: ID 0955: <nnnn> Nvidia Corp.
Where:- is any three-digit number.
- is any three-digit number.
- is a four-digit number that represents the type of your Jetson module:
. 7023 for Jetson AGX Orin (P3701-0000 with 32GB)
. 7023 for Jetson AGX Orin (P3701-0005 with 64GB)
. 7023 for Jetson AGX Orin Industrial (P3701-0008 with 64GB)
. 7223 for Jetson AGX Orin (P3701-0004 with 32GB)
. 7323 for Jetson Orin NX (P3767-0000 with 16GB)
. 7423 for Jetson Orin NX (P3767-0001 with 8GB)
. 7523 for Jetson Orin Nano (P3767-0003 and P3767-0005 with 8GB)
. 7623 for Jetson Orin Nano (P3767-0004 with 4GB)
- Proper power and USB connection sequence:
- Remove the power cable from the Jetson device.
- Connect the jumper between FC REC and GND pins.
- Plug in the power cable to turn on the device.
- Connect the USB Type-C cable between the Jetson and the host computer.
- Create a directory to extract this file:
$ mkdir ${HOME}/nvidia-jetsonExtract both files to the same created directory in order to start flashing:
$ tar xf Jetson_Linux_R36.5.0_aarch64.tbz2 -C ${HOME}/nvidia-jetson/
Change the directory context to the directory where the flash.sh script is present:
$ cd ${HOME}/nvidia-jetson/Linux_for_Tegra/
Flash the QSPI firmware which holds NVIDIA Jetson bootloaders.
For Jetson Jetson Orin Nano:
$ sudo ./flash.sh p3768-0000-p3767-0000-a0-qspi external
When the QSPI firmware flashing completes, the device will reboot. - You should now see the minor version updated:
$ cat /etc/nv_tegra_release
# R36 (release), REVISION: 5.0, GCID: 43688277, BOARD: generic, EABI: aarch64, DATE: Fri Jan 16 03:50:45 UTC 2026
Follow these instructions and build a dedicated boot ISO with Containerfile.ImageMode.
You will notice this includes both Tailscale client (mesh VPN) and Flightctl (to enroll the Device to Red Hat Edge Manager)
- Clone/Download the project files
- Install Python dependencies:
pip install -r requirements.txt
- Place your model: Put your trained
.ptmodel file inside themodels/directory.
*.pt files (models/best.pt, models/yolo11n.pt) are tracked with Git LFS instead of being committed directly, since they're large binaries. A plain git clone/git pull on a machine without Git LFS installed will leave you with tiny text pointer files instead of real weights — this is what can cause the YOLO model to silently fail to load (YOLO(MODEL_PATH)) even though the file exists and has the right name/path.
Install Git LFS (one-time, per machine):
sudo dnf install git-lfs   # RHEL/Fedora
# or: sudo apt install git-lfs   # Debian/Ubuntu
git lfs install
Pull the actual model weights (after cloning, or if you suspect you only have pointer files):
git lfs pullTo check whether a file is a real binary or still just an LFS pointer, look at its size or the first line:
head -c 200 models/best.pt
# A pointer file looks like:
#   version https://git-lfs.github.com/spec/v1
#   oid sha256:...
#   size 5457939
# A real weights file will show binary/garbage output instead.
Pushing a new/updated model:
git add models/best.pt        # staged as an LFS object because of .gitattributes
git commit -m "Update trained model weights"
git push
Since podman build/podman run on the Jetson just read whatever is on disk in models/, always run git lfs pull after pulling code changes on that machine before rebuilding the container or restarting it.
See the files in the autostart folder: two Podman Quadlet .container units, artemis.container and defect-detector.container, generating equivalent systemd services for the Artemis broker and the detector app respectively. defect-detector.container depends on artemis.service via After=/Wants=, so ordering is handled automatically.
Both are system-level units (not user-level like the old setup) -- required for the detector container's --privileged/GPU device access, which only works with rootful Podman. Running Artemis as a system unit too avoids the rootless-session teardown issue (loginctl enable-linger) that ad-hoc podman run hit earlier, since root system services aren't tied to any login session.
To install:
sudo cp autostart/*.container /etc/containers/systemd/
sudo systemctl daemon-reload
sudo systemctl enable --now artemis.service defect-detector.service
The Volume= paths in both units are hardcoded to /home/redhat/edge-defect-detector -- edit them first if your checkout lives elsewhere. Check status/logs the normal systemd way, e.g. systemctl status defect-detector.service / journalctl -u artemis.service -f.
The application is configured using environment variables. This is especially important when running with Podman.
| Environment Variable | Default Value | Description |
|---|---|---|
MQTT_BROKER |
localhost |
The IP address or hostname of your MQTT broker. |
MQTT_PORT |
1883 |
The port for your MQTT broker. |
MQTT_TOPIC_CONTROL |
defect_detection/control |
The MQTT topic to send commands to the application. |
MQTT_TOPIC_STATUS |
defect_detection/status |
The MQTT topic where the application publishes its status. |
MODEL_PATH |
models/best.pt |
The path inside the container to the YOLO model file. |
FLASK_WEB_PORT |
5000 |
The port on which the Flask web server will listen inside the container. |
RECORDING_PATH |
recordings |
The directory inside the container where recorded videos will be saved. |
VIDEO_FORMAT |
XVID |
The FourCC code for the video codec. XVID for .avi or mp4v for .mp4. |
YOLO_CONF_THRESHOLD |
0.25 |
Global minimum confidence for a YOLO detection to be kept. Kept low by default so weak Defect detections aren't missed -- see PIECE_MIN_CONFIDENCE for why Piece has its own, stricter threshold instead of raising this one. |
YOLO_IOU_THRESHOLD |
0.45 |
NMS overlap threshold. Lower this if the model reports multiple overlapping boxes on what's actually a single piece/defect -- it makes NMS merge/suppress overlapping detections more aggressively. |
PIECE_MIN_CONFIDENCE |
0.5 |
Separate, stricter confidence bar applied only to Piece detections (in run_detection_on_frame), to reject spurious/background piece detections without also raising the bar for Defect. Raise this if you're seeing multiple "pieces" detected when only one is actually in view. |
PIECE_CLASS_NAME |
Piece |
Which of the loaded model's classes means "the thing being inspected is present". Set this alongside MODEL_PATH when swapping in a differently-trained model -- e.g. red-hat for a pin-inspection model. Any class the model returns that isn't this or DEFECT_CLASS_NAME is ignored entirely (not drawn, not counted), so stray classes from a shared/reused base training run (e.g. Airplane, Car) never show up. |
DEFECT_CLASS_NAME |
Defect |
Which of the loaded model's classes means "a defect was found on it". See PIECE_CLASS_NAME above -- e.g. scratch for a pin-inspection model. |
Make sure you have started the MQTT broker first
- Set the environment variables in your terminal (optional, defaults will be used), for example:
export MQTT_BROKER="192.168.1.100"
- Run the application:
python app.py
- Access the UI by navigating to localhost:5000.
-
Step 1: Place Your Model Make sure your trained model file (e.g., best.pt) is inside the models directory.
-
Step 2: Build the Container Image Open a terminal in the project root directory (/defect-detector-app/) and run (to build the CPU version of the app):
podman build -t localhost/defect-detector -f Containerfile .To build instead the version that is based on libraries already compiled for Jetson GPU and that can leverage natively Nvidia device on the Jetson (we are using sudo since we will be running the container as such):
sudo podman build -t localhost/defect-detector-jetson -f Containerfile.jetson .-
Step 3: Run the Container
Now, run the container. The commands below shows how to override the environment variables and map necessary resources.--device /dev/video1:/dev/video1: This maps your host's webcam into the container so OpenCV can access it.
-v "$(pwd)/models":/app/models: This mounts your local models directory into the container. This is the best practice for handling large model files, as it keeps them out of the image itself.
-p 8080:5000: This maps port 8080 on your host machine to port 5000 inside the container. You will access the UI at http://localhost:8080.
Make sure to start first the MQTT broker (either natively or containerized like shown below).
podman run -d --replace --privileged --name mosquitto -p 1883:1883 -v "$PWD/mosquitto/config:/mosquitto/config" -v "$PWD/mosquitto/data:/mosquitto/data" -v "$PWD/mosquitto/log:/mosquitto/log" docker.io/library/eclipse-mosquittoShould you want to check that the mqtt broker is running fine, connect remotely or locally using MQTT Explorer and subscribe to system topic tree: $SYS\#
If you'd rather run Apache ActiveMQ Artemis (via the ArkMQ community broker image) instead of Mosquitto, it's a drop-in replacement -- app.py just talks plain MQTT on MQTT_BROKER/MQTT_PORT, so it doesn't care which broker is on the other end. This mirrors a setup already validated with podman on another project, adapted here as a single container.
NOTE: The image's default entrypoint only creates the broker instance if its data directory doesn't already exist -- but podman pre-creates that directory as soon as a volume is mounted there, even empty, which tricks it into skipping creation and crash-looping.
amq-artemis/entrypoint.shworks around this by checking for the actualartemisbinary instead, so it only creates the instance once, on first run against an empty volume.
NOTE: Since this runs as a rootless container (no
sudo), it's tied to your user's systemd session. Without lingering enabled, the container gets a clean shutdown the moment your last login session for that user ends (SSH disconnect/timeout, or a plainexit) ---donly detaches from the terminal, it doesn't survive the session itself going away. Run this once so it keeps running independently of any active login:sudo loginctl enable-linger $(whoami).
NOTE: This section is for ad-hoc/rootless testing. The autostart Quadlet unit runs Artemis as root (system service, no user-session/linger issue) instead, which uses a different UID mapping:
jboss(the image's user) is host UID 185 literally, not remapped through subuid ranges the way rootless podman does it. If you test rootless first with the command below and then switch to the quadlet,amq-artemis/data's contents will be owned by the rootless-mapped UIDs and the rootful container won't be able to write to them (e.g.log/audit.log (Permission denied)) -- reown it for the new context:sudo chown -R 185:0 amq-artemis/data. Setting up the directory for the quadlet from scratch (no prior rootless run) needs the same ownership, not thechmod 775below:sudo mkdir -p amq-artemis/data && sudo chown 185:0 amq-artemis/data.
mkdir -p amq-artemis/data
# The image runs as a non-root user (jboss) in the "root" group (gid 0). Without this,
# the first run fails with "The path 'broker' is not writable." since a freshly
# mkdir'd directory isn't group-writable by default.
chmod 775 amq-artemis/data
podman run -d --replace --name artemis \
    -p 1883:1883 \
    -p 8161:8161 \
    -v "$PWD/amq-artemis/data:/home/jboss/broker:Z" \
    -v "$PWD/amq-artemis/entrypoint.sh:/entrypoint.sh:Z" \
    -e AMQ_USER=admin \
    -e AMQ_PASSWORD=password \
    --entrypoint /bin/sh \
    quay.io/arkmq-org/arkmq-org-broker:latest /entrypoint.sh
Port 1883 is MQTT (same as Mosquitto); 8161 is Artemis's web console (http://<host>:8161, log in with AMQ_USER/AMQ_PASSWORD) for inspecting queues/connections. Data persists in amq-artemis/data across container restarts. MQTT clients connect anonymously (--allow-anonymous), matching Mosquitto's allow_anonymous true -- change AMQ_USER/AMQ_PASSWORD before using this beyond a lab setup, since they only guard the admin console, not MQTT pub/sub.
NOTE: Remember to open both ports on Firewall for remote access (
18838161) and to enable lingering user with:$ loginctl enable-linger
NOTE: If the console logs in but shows nothing besides the Hawtio logo (blank, no nav/plugins), it's because
--http-host 0.0.0.0makesartemis createseed the console's CORS allowlist (etc/jolokia-access.xml) with<allow-origin>*://0.0.0.0*</allow-origin>-- which no real browser origin ever matches, so every request gets rejected with a 403 once<strict-checking/>kicks in.entrypoint.shbroadens this to<allow-origin>*</allow-origin>automatically on first create, matching this setup's existing anonymous/no-TLS trust model. If you're fixing an already-created instance (data volume predates this fix), patch it directly:sed -i 's|<allow-origin>\*://0.0.0.0\*</allow-origin>|<allow-origin>*</allow-origin>|' amq-artemis/data/etc/jolokia-access.xml && podman restart artemis.
amq-artemis can optionally mirror defect_detection/results to a second Artemis broker running on OpenShift (e.g. a single-node cluster that isn't on all day), so it's available for higher-level analysis without needing that cluster to be reachable all the time. Set these on the edge podman run command to enable it:
-e FEDERATION_HOST=<openshift-route-hostname> \
-e FEDERATION_PORT=443 \
-e FEDERATION_TRUSTSTORE_PASSWORD=<truststore-password> \
-v "$(pwd)/federation-truststore.p12:/etc/artemis-federation-tls/truststore.p12:Z" \
Full setup for the OpenShift side (manifests, TLS certificate generation, verification steps) is in amq-artemis-federated/README.md. Short version of how it works: a Core Bridge (not Artemis Federation -- the broker image doesn't ship that module) queues messages durably on this side whenever the OpenShift broker is unreachable, and flushes them automatically once it reconnects, with no message loss. Verified this end-to-end locally (live forwarding, offline queuing, reconnect flush) before writing the config.
Now you can run the python app containerized (the following is the command that leverages Nvidia GPU and the defect-detector-jetson built image).
NOTE: The model is injected at runtime and not build time, so that you can switch the model quickly, without rebuilding.
sudo podman run -d --replace --privileged \
    --security-opt label=disable \
    --name my-detector \
    --device nvidia.com/gpu=all \
    --shm-size=1g \
    -p 5000:5000 \
    --device /dev/video1:/dev/video1 \
    -v "$(pwd)/models":/app/models \
    -v "$(pwd)/recordings":/app/recordings \
    -e MQTT_BROKER="192.168.100.245" \
    -e MQTT_PORT="1883" \
    -e FLASK_WEB_PORT="5000" \
    -e MODEL_PATH="/app/models/best.pt" \
    localhost/defect-detector-jetson
(Replace 192.168.100.245 with your actual MQTT broker's IP address)
NOTE: Without the
recordingsvolume mount, recorded videos land inside the container's own writable layer instead of the host -- not just hard to find, but permanently lost the next time the container is recreated (--replace, or every restart if run via theautostartQuadlet, which always runs with--rm).
To run a differently-trained model instead -- e.g. best-hat.pt, a red-hat-pin/scratch inspection model trained on classes that don't match the metal-piece model's Piece/Defect naming (and which also has a couple of unrelated leftover classes, Airplane/Car, from a shared base training run) -- point MODEL_PATH at it and override PIECE_CLASS_NAME/DEFECT_CLASS_NAME to match its actual classes:
    -e MODEL_PATH="/app/models/best-hat.pt" \
    -e PIECE_CLASS_NAME="red-hat" \
    -e DEFECT_CLASS_NAME="scratch" \
The Airplane/Car classes are ignored automatically -- see PIECE_CLASS_NAME in the Configuration table above.
- Step 4: Access Your Application
You can now open your web browser and navigate to http://:5000 to see your application running. Make sure to open port 5000 on the Nvidia jetson firewall.
- Video Source: The local USB camera (device passed through with the podman command) is used by default at startup -- no need to select or enable it manually, the live feed under "Live Feed Analysis" just works. Use the dropdown only if you want to switch to a "Web Stream" instead (enter the stream URL, then click "Update Video Source").
- Static Analysis: Use the "Analyze Uploaded File" form to upload an image or a video.
- Images: The result appears almost instantly.
- Videos: A progress bar will appear. The application is processing the video in the background. Once complete, the annotated video will be displayed.
You can use any MQTT client for such purpose, in my case I'm using MQTT Explorer.
You can find the example connnection parameters in the picture  In my case port 1883 is open and reachable from the MQTT Explorer app.
You can use the container MQTT Explorer application to send MQTT messages to the containerized mosquitto we started earlier.
With the USB camera streaming by default, you can enable the real-time model with the switch you see at the top of the screen  , plus a second switch underneath it for discrete (single-frame) analysis -- the two are mutually exclusive.
These work like ON/OFF buttons and behind them MQTT messages are being sent to enable and disable the detection, the same as publishing to
, plus a second switch underneath it for discrete (single-frame) analysis -- the two are mutually exclusive.
These work like ON/OFF buttons and behind them MQTT messages are being sent to enable and disable the detection, the same as publishing to defect_detection/control directly.
You can control the real-time defect detection on the live video stream by publishing messages to the defect_detection/control MQTT topic.
 TOPIC defect_detection/control
- To start the analysis, publish the message: start
- To stop the analysis, publish the message: stop
- To start discrete analysis (one frame), publish the message discrete-on (it automatically flips back to off after that one frame is analyzed)
- To cancel a discrete analysis request before it's been consumed, publish: discrete-off
You can use any MQTT client (e.g., MQTTX, mosquitto_pub) to send these commands.
Once started the application will also publish its status (Detector online, Analysis started, Analysis stopped) to the defect_detection/status topic.
TOPIC defect_detection/status
- view status of analysis
You can now also record video from the camera using specific messages to the defect_detection/control MQTT topic
TOPIC defect_detection/results
Published once per discrete analysis (discrete-on). The model has two classes, Piece (a piece is present under the camera) and Defect (a defect was found on it) -- these are tracked separately, so an absent piece is its own distinct result rather than being reported as "not defective".
Piece present, inspected:
  {
    "piece_present": true,
    "piece_count": 1,
    "defective": true,
    "confidence": 0.829,
    "timestamp": "2026-08-11T13:37:32",
    "piece": 2
  }
No piece under the camera -- piece is null (it isn't counted as an inspected piece, so the progressive counter doesn't advance) and confidence is 0:
  {
    "piece_present": false,
    "piece_count": 0,
    "defective": false,
    "confidence": 0.0,
    "timestamp": "2026-08-11T13:37:32",
    "piece": null
  }
TOPIC defect_detection/control
- To start recording, publish: start_recording
- To stop recording, publish: stop_recording
To view logs or stop the container:
podman logs -f my-detectorFlask's per-request access log (Werkzeug) is suppressed to warning level and above, so plain REST endpoint calls (GET /get_defect_count, polling, etc.) don't spam the log -- Werkzeug's own warnings/errors still show. The app's own meaningful events are logged at warning level, so you'll still see: camera acquisition (once per source, not per frame), analysis results on state change (piece OK / defective / no piece under camera) for continuous mode, each discrete analysis result, MQTT connect/disconnect and control messages received, and recording start/stop.
podman stop my-detector
podman rm my-detector