
An MCP (Model Context Protocol) server that generates Skew-T Log-P diagrams from weather model data for any coordinates. Designed for pilots, paragliders, and weather nerds who use AI assistants.
No API key needed — uses free Open-Meteo data (which blends HRRR, GFS, and other models).
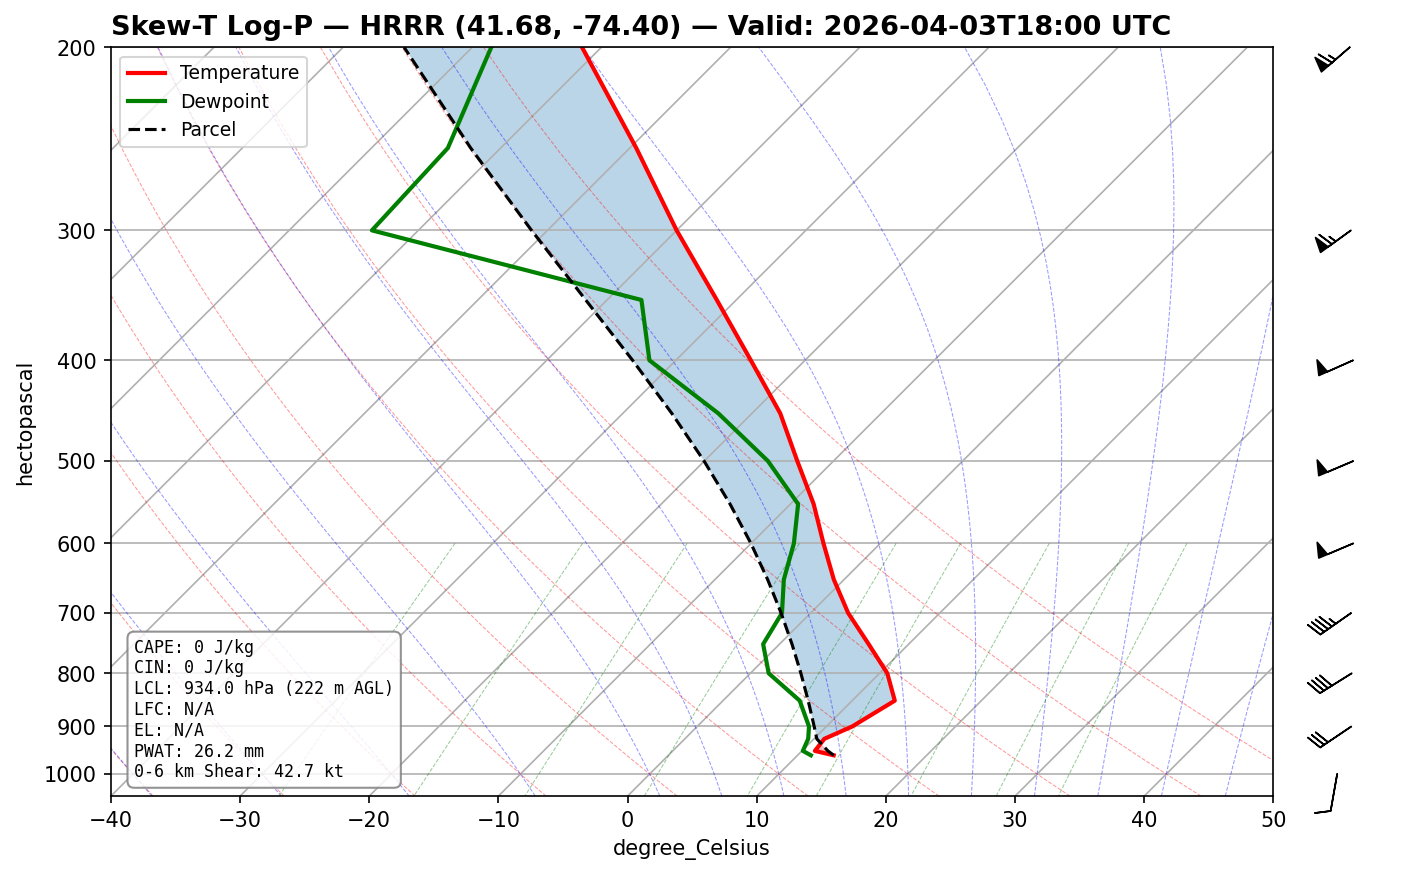
Once installed, just talk naturally:
"Show me the skew-t for Ellenville, NY at 2pm"
"What does the sounding look like for 37.7749, -122.4194 tomorrow at 18Z?"
"Pull a skew-t for the Torrey Pines launch site — is it thermic today?"
"Get me the sounding data for my home airport, I want to check the inversion layer"
The MCP tool description tells the AI when and how to call it:
Generate a Skew-T Log-P diagram for given coordinates and time. Returns a PNG image and key thermodynamic indices (CAPE, CIN, LCL, LFC, EL, PWAT).
For Ellenville Flight Park (41.67, -74.40) at 18Z:
CAPE: 0.0 J/kg
CIN: -0.1 J/kg
LCL: 991.1 hPa (75 m AGL)
LFC: 958.4 hPa
EL: 949.6 hPa
PWAT: 26.0 mm
0-6 km Shear: 44.8 kt
Plus a full Skew-T diagram with temperature (red), dewpoint (green), parcel path (dashed), wind barbs, CAPE/CIN shading, dry/moist adiabats, and mixing ratio lines.
- Skew-T diagrams with temperature, dewpoint, parcel path, wind barbs, CAPE/CIN shading, dry/moist adiabats, and mixing ratio lines
- Computed indices: CAPE, CIN, LCL, LFC, EL, precipitable water, 0-6 km bulk shear
- Data source: Open-Meteo API (free, no API key) — uses best available model blend including HRRR for CONUS
- GFS fallback: If the default model fails, automatically falls back to GFS
- MCP transport: stdio — works with Claude Desktop, Claude Code, and any MCP client
pip install skewt-mcpOr from source:
git clone https://github.com/keithmgould/skew-t_mcp
cd skew-t_mcp
pip install -e .Add to your claude_desktop_config.json:
{
  "mcpServers": {
    "skewt": {
      "command": "python",
      "args": ["-m", "skewt_mcp"]
    }
  }
}claude mcp add skewt -- python -m skewt_mcpGenerate a Skew-T Log-P diagram for given coordinates and time.
Parameters:
| Parameter | Type | Required | Default | Description |
|---|---|---|---|---|
latitude |
float | ✅ | — | Latitude in decimal degrees |
longitude |
float | ✅ | — | Longitude in decimal degrees |
forecast_hour |
int | ❌ | current hour | Hour in UTC (0-23) |
date |
string | ❌ | today | Date in YYYY-MM-DD format |
model |
string | ❌ | "hrrr" |
"hrrr" or "gfs" |
Returns: PNG image (base64) + text summary with CAPE, CIN, LCL, LFC, EL, PWAT, and wind shear.
Get raw sounding data as JSON for programmatic use. Same parameters as get_skewt.
Returns: JSON with pressure levels, temperatures, dewpoints, wind speed/direction, and all computed indices. Useful for custom analysis or when you don't need the image.
- Fetches pressure-level data (1000–200 hPa, 19 levels) from the Open-Meteo API
- Computes dewpoints from temperature + relative humidity (Magnus formula)
- Calculates thermodynamic indices using MetPy
- Renders the Skew-T diagram with matplotlib + MetPy's SkewT class
- Returns the image as base64 PNG + a text summary
git clone https://github.com/keithmgould/skew-t_mcp
cd skew-t_mcp
pip install -e ".[dev]"
pytest- MetPy — meteorological calculations + Skew-T plotting
- matplotlib — rendering
- httpx — async HTTP client
- mcp — MCP Python SDK
MIT