Cleaned + plotted PANYNJ PATH faregate + hourly ridership.
Live site: path.hudcostreets.org
data/all.pqt— per (month, station): total + avg-per-day for weekday / weekend / holidaydata/all.xlsx— Excel copy of the above- Google Sheet
data/YYYY-hourly.pqt— per (station, hour, month), avg per weekday / Sat / Sun / holidaywww/public/entries_vs_exits.pqt— per (ym, station), avg entries + exits per day-typewww/public/hourly.pqt— the browser-served hourly parquet (zstd, int32-downcast)
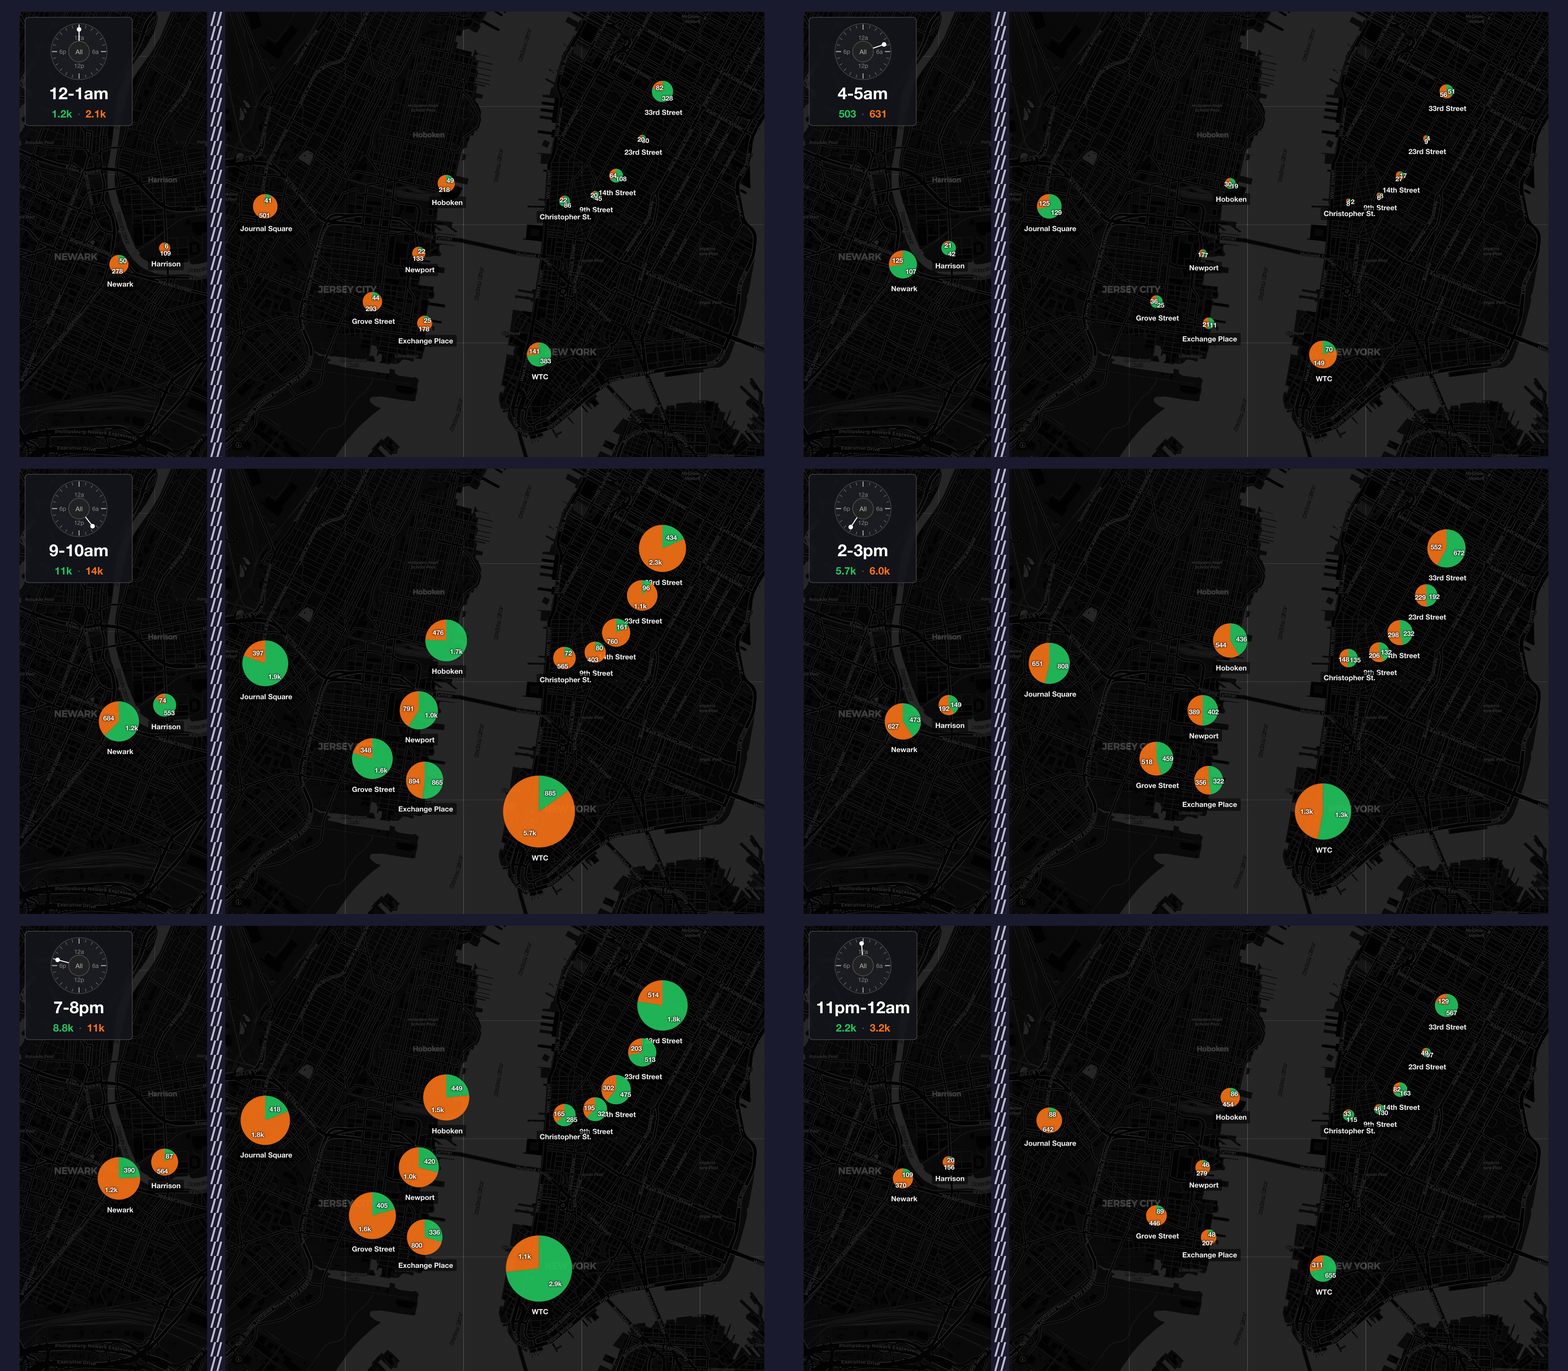
Larger artifacts (parquets, PDFs, the pie-map GIF/MP4) are DVX-tracked (.dvc pointers in git, blobs on S3); dvx pull fetches the current versions.
The daily update-path-data.yml cron runs path-data gha-update:
path-data refresh— download the latest PANYNJ ridership PDFsdvx run— re-parse any changed years and rebuild derived artifacts (path-data monthly -y YYYY,path-data parse-hourly -y YYYY,path-data combine,path-data combine-hourly,path-data entries-vs-exits)dvx add+dvx push— snapshot new outputs to S3git commitand, ifwww/public/**/*.dvcactually changed,gh workflow run www.ymlto redeploy the site
Local dev:
git clone https://github.com/hudcostreets/path
cd path
pip install -e .
path-data --help
Web frontend lives at www/ — Vite + React + Plotly + Leaflet, deployed to GitHub Pages via .github/workflows/www.yml. Any push touching www/** (including new .dvc pointers to fresh data) redeploys automatically.
Same repo also serves /bt — PANYNJ B&T traffic (Lincoln + Holland tunnels, GWB, Bayonne + Goethals + Outerbridge). Merge per-year traffic-e-zpass-usage-*.pdf into one PDF for parsing:
gs -o merged.pdf \
   -sDEVICE=pdfwrite \
   -dPDFFitPage \
   -g12984x10033 \
   -dPDFSETTINGS=/prepress \
   traffic-e-zpass-usage-20*
(cf. SO)