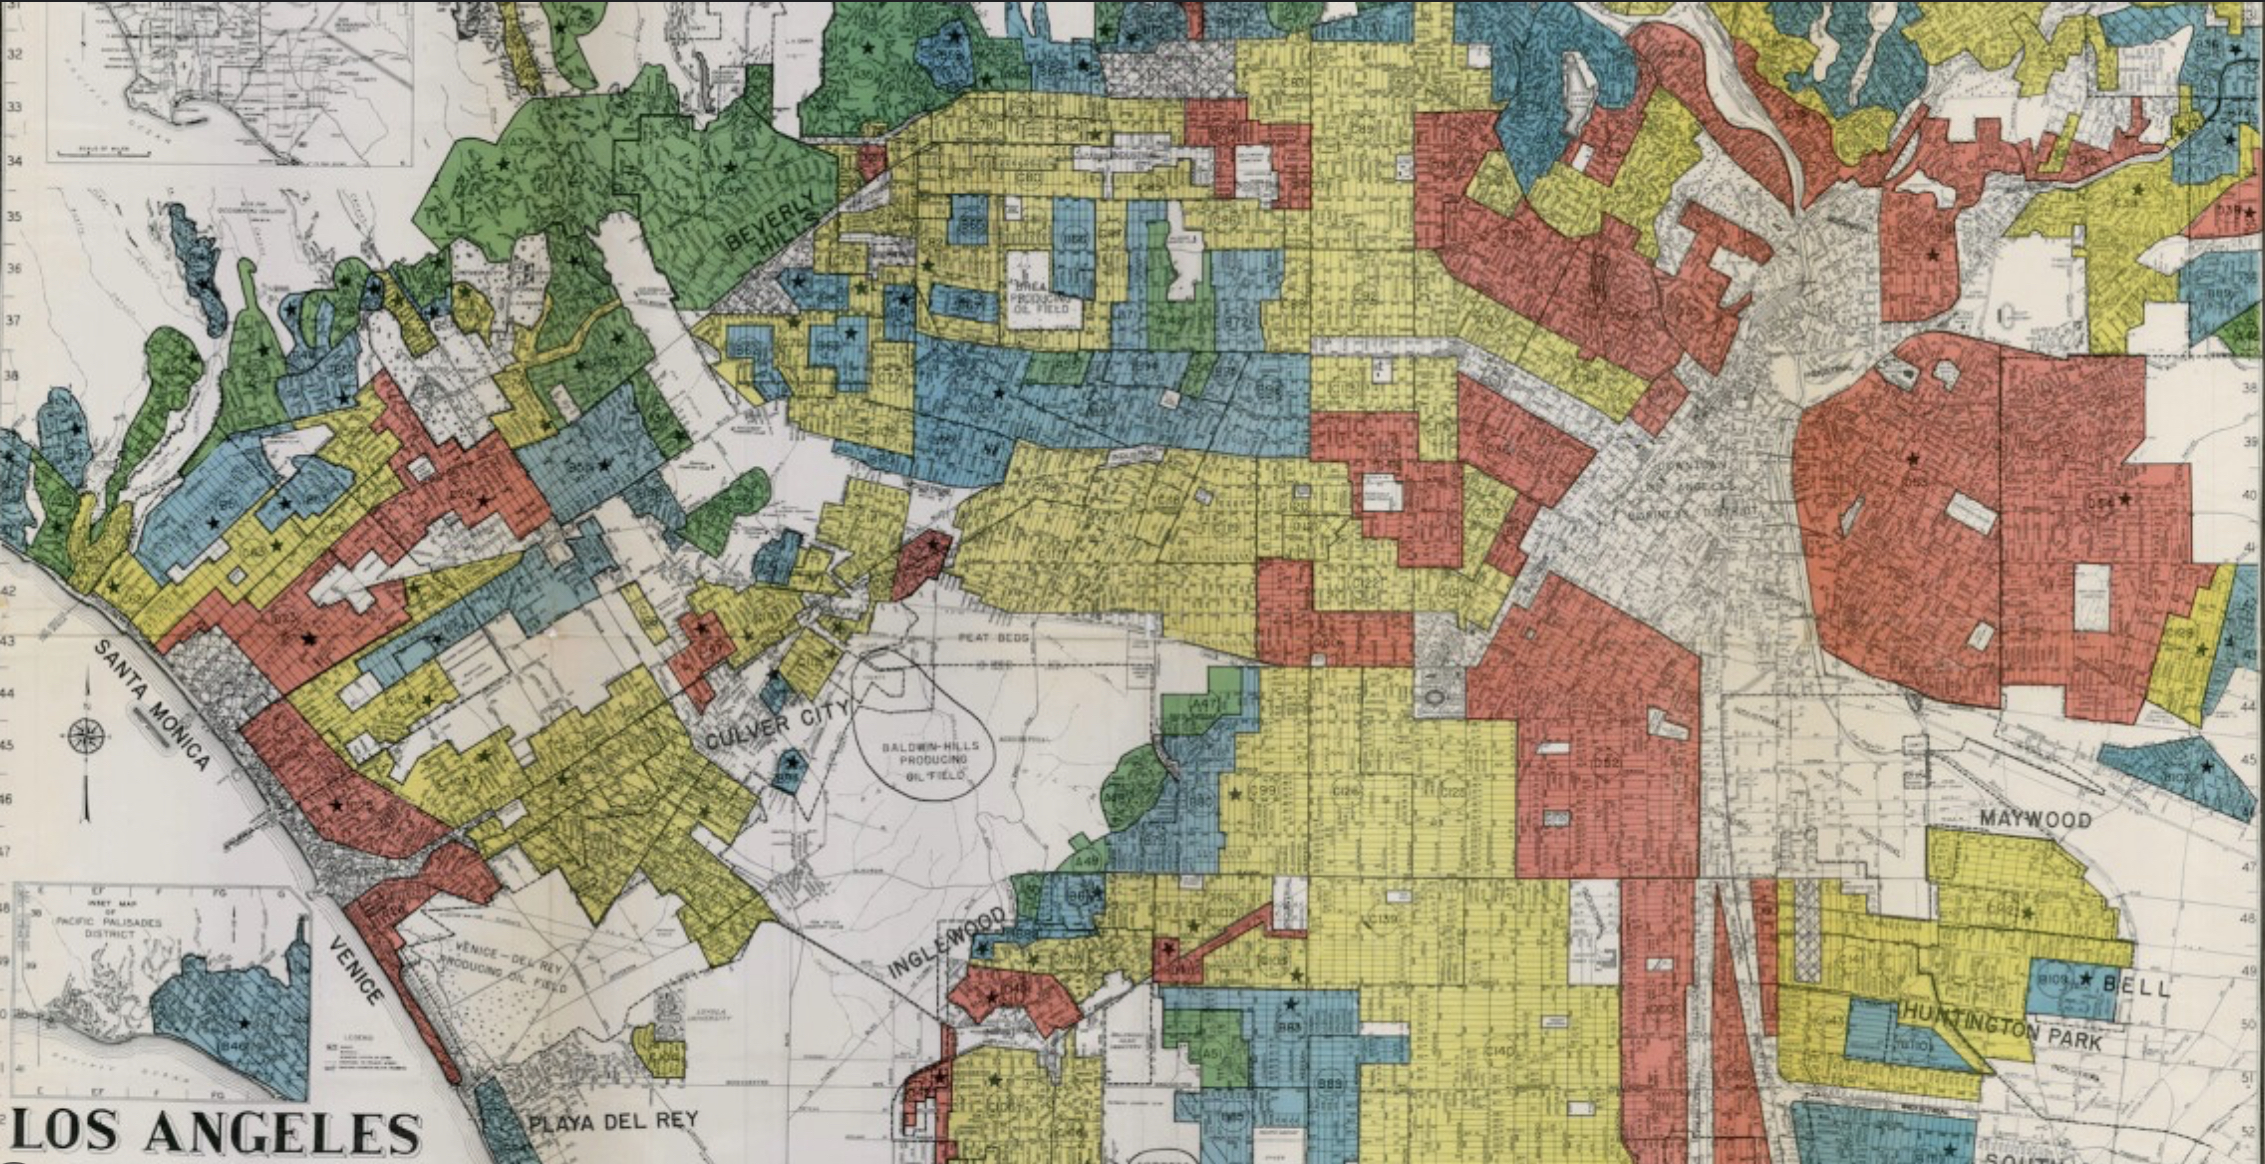
This repository houses a set of maps, tables, and figures that illustrate redlined districts across LA County and how bird biodiversity observations are tracked across districts.
This analysis highlights
- Working with vector data using
sf - Working with biodiversity data and socio-economic data
- Vector algebra and data cleaning
- Mapmaking, plotting, and data visualization using
tmapandggplot
File map
├── redlining-birds_files/
├── .gitignore
├── README.md
├── redlining-birds.Rproj
├── redlining-birds.html
└── redlining-birds.qmd   # Analysis quarto document
Data in this project were pulled from
- US EPA's EJSCREEN tool
- HOLC redlining data from the Digital Scholarship Lab
- Bird diversity observations from the Global Biodiversity Information Facility
All relevant data available here.
All materials were created by Ruth Oliver for EDS-223.
- Global Biodiversity Information Facility, GBIF.org (13 October 2024) GBIF Occurence Download.
- HOLC Redlining Data. Nelson, R. K., Winling, L, et al. (2023). Mapping Inequality: Redlining in New Deal America. Digital Scholarship Lab. https://dsl.richmond.edu/panorama/redlining
- EJScreen: Environmental Justice Screening and Mapping Tool. United States Environmental Protection Agency. 2024 version. EJScreen. Retrieved: 10/4/24 from www.epa.gov/ejscreen.