Christoph Lechner, 18 June 2026
The open-source project CriticalMaps (repositories on github) enables participants of "Critical Mass" events to share their current location with others on an interactive map. Apps are available for the platforms iPhone and Android. Alternatively, you can see the current positions online in the web browser.
The CriticalMaps App (I only used the iOS version) is generally very well made. There are however a few limitations that make catching up with a already on-going Critical Mass event quite challenging:
- The geoposition data provided by other users sharing their location is only refreshed every 60 seconds. So if your phone is not mounted to the handlebar of your bike, you have to frequently stop and wait until the map is updated.
- Often 'randomly distributed' dots can be seen on the map. These are the result of:
- app users who just want to observe an on-going Critical Mass event in their city while they themselves are not participating. Specifically for this the app offers an observation mode, but people might either not be aware of this function or simply forget to switch it on
- app users who are currently catching up with the Critical Mass, or who had to leave early
- app users who are sharing their current location for other reasons (they do not intent to join a Critical Mass event)
In the following we make the reasonable assumption that bike events such as a Critical Mass correspond to several moving dots in close proximity on the map. This assumption leads to the following data processing key steps:
- Identify "stationary devices", i.e. devices that haven't moved more than 100 meters in the last hour. These are likely app users who are just observing.
- Per default, these "stationary devices" are disregarded in the following.
- Then we run the clustering algorithm, currently hierarchical clustering is used. The clustering algorithm has a configurable maximum distance to join a point to a cluster (or another point not yet part of a cluster). Only the current positions are taken into account for the clustering process.
- After this procedure, the dataset will exhibit this general structure:
- There will be groups of points that are in close proximity.
- On the other hand, some points are too far away from any other point. For the following, they are not considered
- At the end of this process, the dataset is partitioned into several sets of points referred to as "clusters".
A reasonable starting point for selecting parameters could be
- minimum cluster size N=3 (one may consider to set this minimum threshold higher)
- radius 300m (at 15km/h 500m would correspond to 120s, so one position update may even be lost)
- ignore "stationary" devices (devices that did not move more than 100 meters in the previous hour)
- ignore "isolated" devices (devices that aren't part of any clusters)
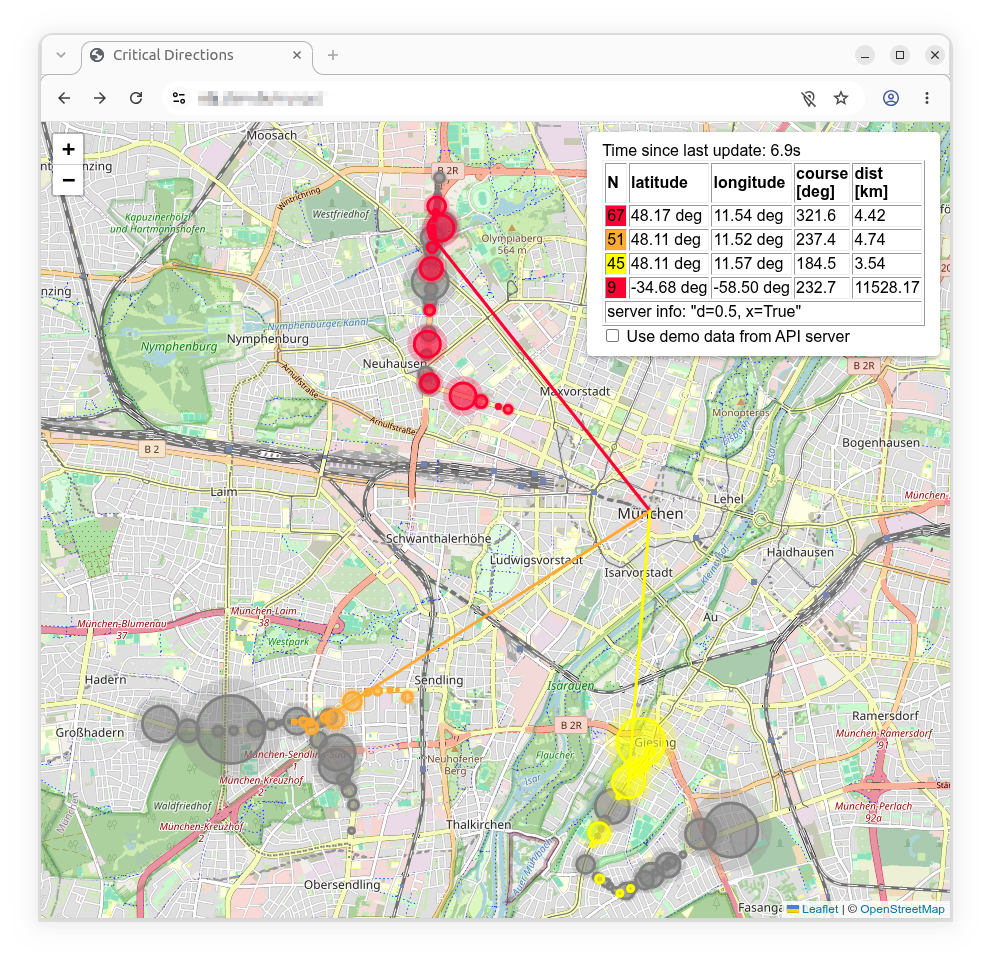
New: A short demonstration video compiled from a sequence of screenshots of the web map is available here. It shows a group of cyclists (red cluster) crossing the Köhlbrand Bridge in Hamburg during the "Sternfahrt" in June 2026.

- OS: Ubuntu Server 24.04 LTS
- Docker
- Python 3.10 or newer
- notable packages used: FastAPI, scikit-learn, psycopg, pytest
- PostgreSQL v18
- Redis
- Test automatization using GitHub Actions, see here for more information
- The web client is implemented using HTML, JavaScript, and Leaflet
As part of the GitHub Actions workflow triggered by pushes to the master branch, a Docker image containing the API server is generated.
To verify the core functionality of this image, it is started alongside a PostgreSQL container populated with a test dataset.
Automated tests send HTTP requests to the core /clusters API endpoint with different request parameters and validate the responses against expected results.
Only images that successfully pass these tests are published to DockerHub.
There are two alternative ways to run the API data import:
- running it using Docker container
- installation in a fresh virtual environment
Docker images
There two Dockerfiles: one for API data import and one for the API server (more documentation will follow)
Installation in fresh virtual environment using the commands:
$ python3 -m venv ./venv/
$ source ./venv/bin/activate
$ pip3 install -e .
[...]
Configuration of database access is done by adjusting the connection parameters in ./env based on the template ./env.example (you can test them using check_db_conn.py). Before running this project for the first time, the DB has to be prepared using the definitions in schema.sql.
Then you can start to fill the database by running the API requestor critical-dir-apiimport. It periodically connects to the CriticalMaps API endpoint and stores the received information both in .json files and in the database.
For analysis of the stored data, there are currently two ways to run the software:
- The preferred way is to use the API server and the client. Either run the Docker image or run
critical-dir-apiin your virtual environment. The available API endpoints are documented here. - For development, run the script
scripts/interactive_demo.pyon the command line. This script can serve as basis for your own analysis scripts.
Currently the URIs on the HTTPS Apache2 server are organized as follows:
/myapp/: top path used by the app, contains static materials, served by Apache2/myapp/api/: forwarded to FastAPI by Apache2 acting as reverse proxy for HTTPS termination
Here we list the API endpoints provided by the API server and the respective implemented HTTP methods.
/clusters(GET): This is the main endpoint for the clients. Get JSON data describing the identified clusters./clusters_demo(GET): Delivers demo data (periodic motion of clusters). Mainly for development of client software./health(GET/HEAD): Endpoint for health checks. Is the API server reachable? This also performs a basic check of database 'freshness'. Returns HTTP status code 200 if checks are passed and HTTP status code 500 when something is out of order. Mainly for Docker, there is also a version that does not take DB freshness into consideration (/health_no_freshness_check, also GET/HEAD HTTP methods supported).
The data processed by this software project as basis for the provided maps is periodically obtained from the CriticalMaps API.
For regular operation, Docker can be used. A docker-compose.yaml template file is available for customization. In addition, for building the Docker image, a Dockerfile is available.
The downloader supports HTTP Health Monitoring. If you run it from the command line, pass the desired port to listen on to the program at start-up:
critical-dir-apiimport --status_port=22222
To check the health status of the data downloader, you can use curl.
The HTTP status code will be 200 if everything is ok, or 500 if no data could be downloaded for 900 seconds.
$ curl --head http://localhost:22222/check
In a production setting, this URL could be monitored with any URL monitor tool supporting GET or HEAD requests.