


Analytics TUI and OS-level reset scheduler for Claude Code. Runs in your terminal, reads your local ~/.claude/ logs, and shows token use, cost, cache efficiency, hourly breakdowns, per-project and per-model breakdowns, plus an optional cron/schtasks/launchd job that fires a claude ping on your chosen schedule so your session resets when you want.
Nothing leaves your machine. No network calls except a once-a-day price fetch (cached).
pnpm install -g ccperf
# or
npm install -g ccperf
Then run ccperf (or ccp for short).
Node 20+. Works on Windows (schtasks), macOS (launchd), and Linux (cron). Falls back to a managed daemon file if none of those are available.
ccperf                     # launch the interactive TUI
ccperf report              # one-shot text summary
ccperf report --section models
ccperf scheduler install   # install the daily ping at fire-time
ccperf scheduler test      # fire the scheduled command once, now
ccperf doctor              # check config, paths, backend availability
ccperf export --format json > usage.json
ccperf init # re-run the setup wizardFourteen tabs, covering what's actually derivable from Claude Code's local journal:
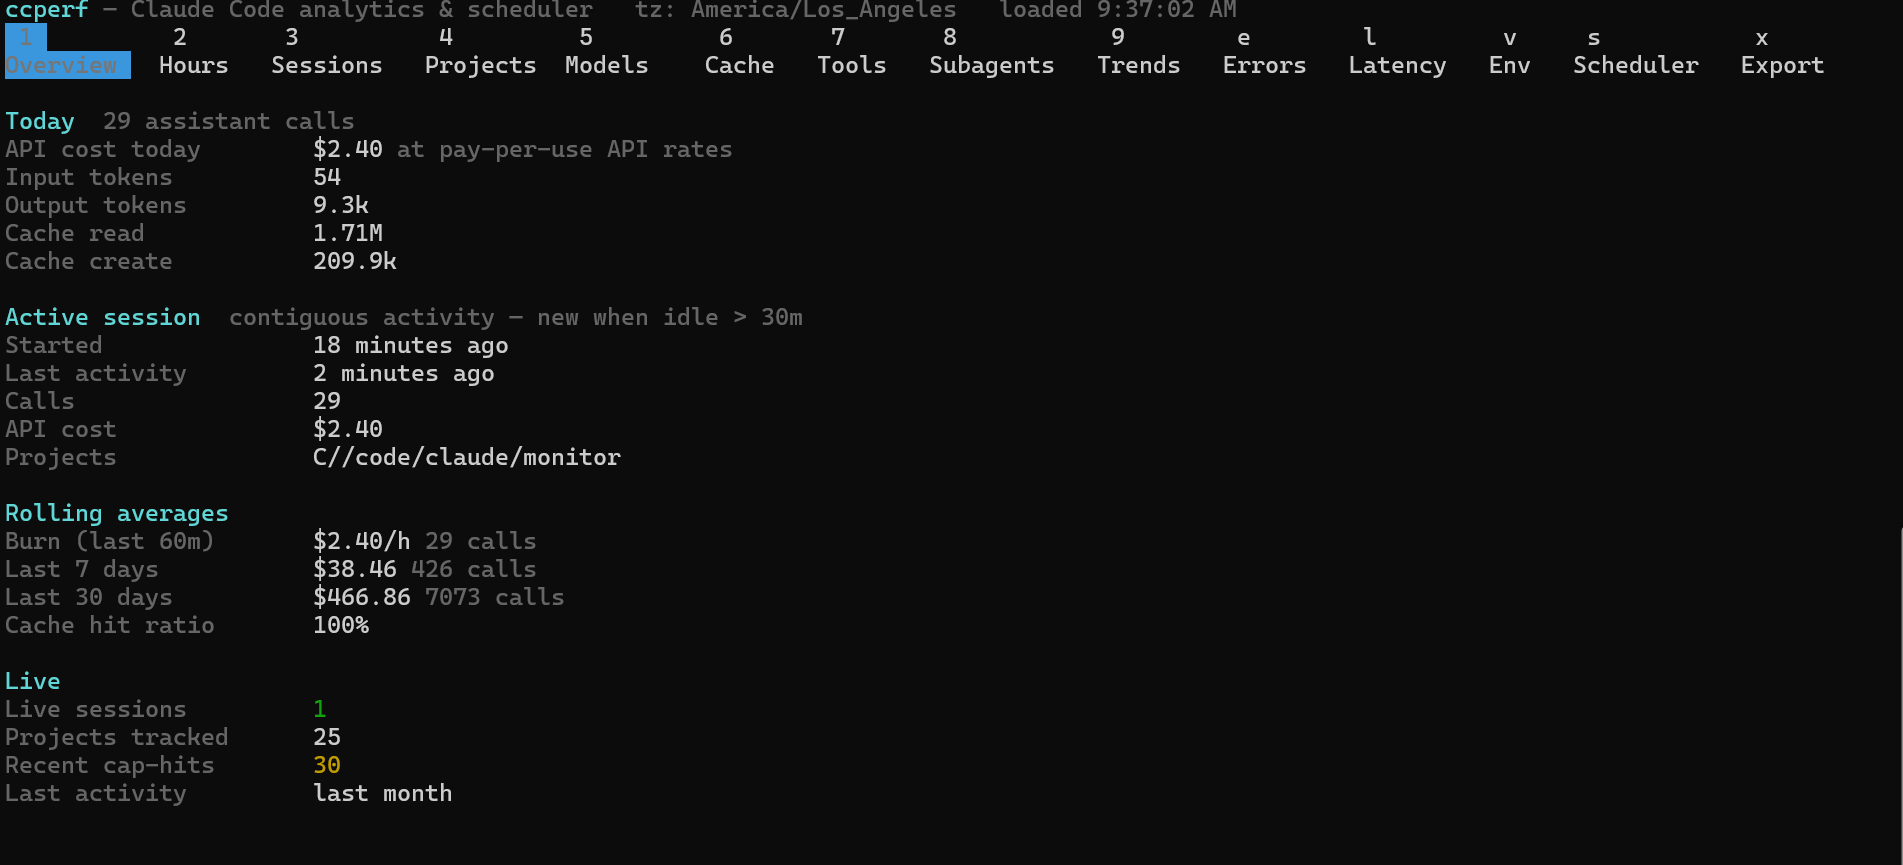
| Tab | Hotkey | What it covers |
|---|---|---|
| Overview | 1 |
today's API cost + tokens, burn rate, active session, live sessions |
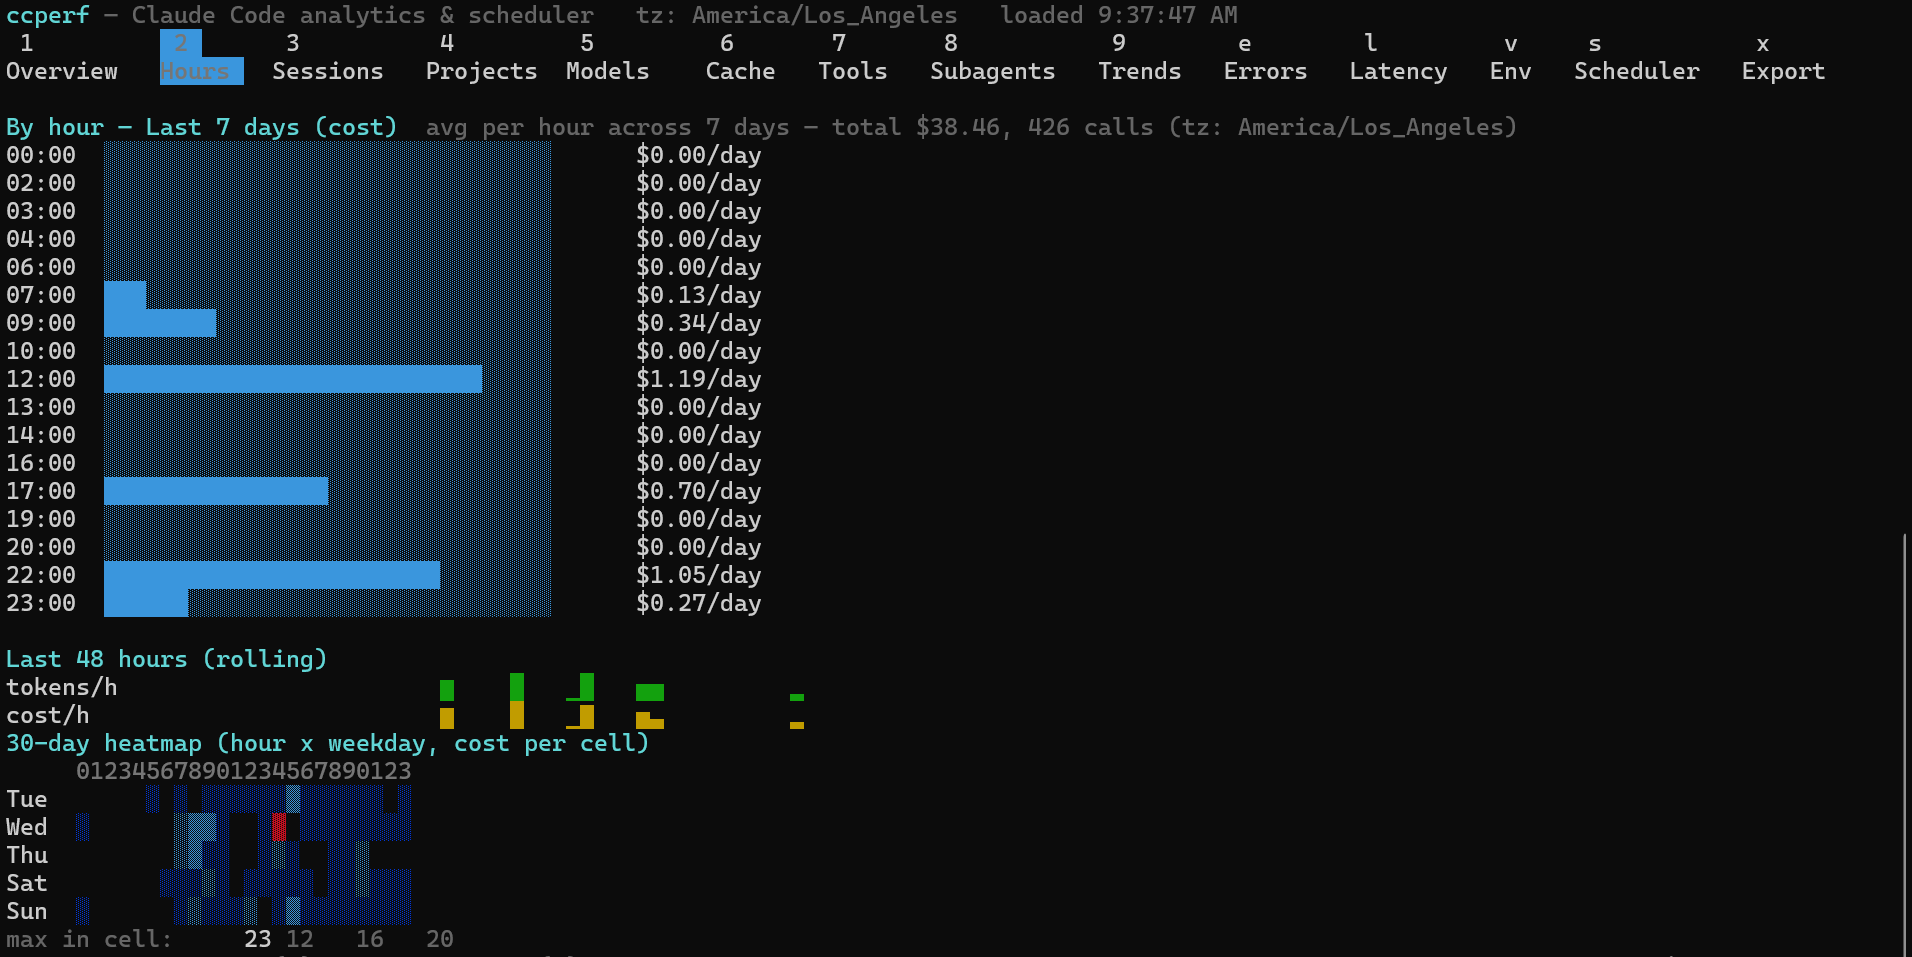
| Hours | 2 |
per-hour usage with range toggle (today / 7d / 30d / all), 30-day heatmap |
| Sessions | 3 |
recent sessions with live-green indicator |
| Projects | 4 |
cost and calls by project |
| Models | 5 |
cost and calls by model, service tier |
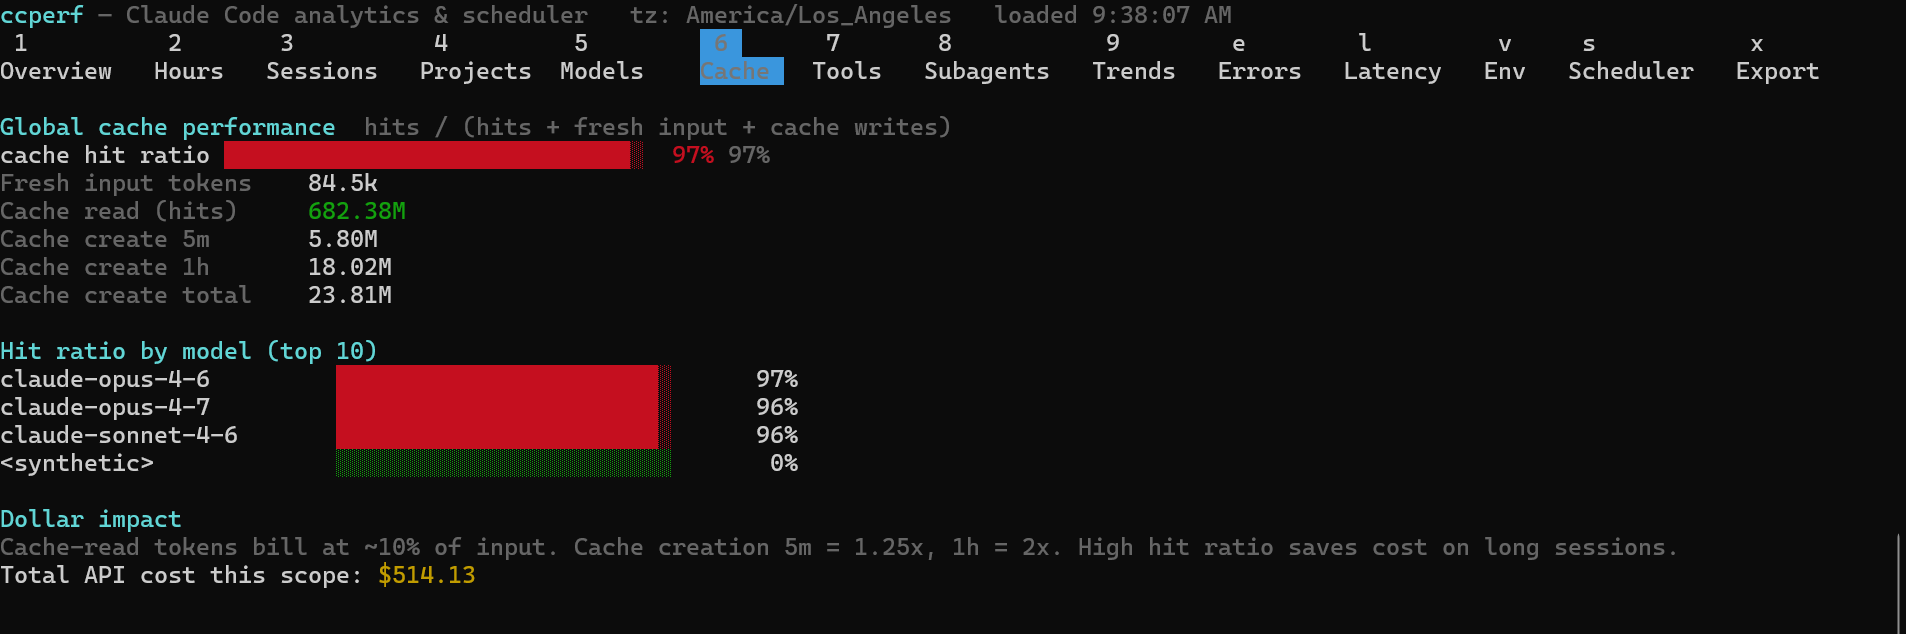
| Cache | 6 |
cache hit ratio (hits / hits+fresh+writes), 5m vs 1h create |
| Tools | 7 |
core tools, MCP servers, top bash commands |
| Subagents | 8 |
Task() spawns and their agent types |
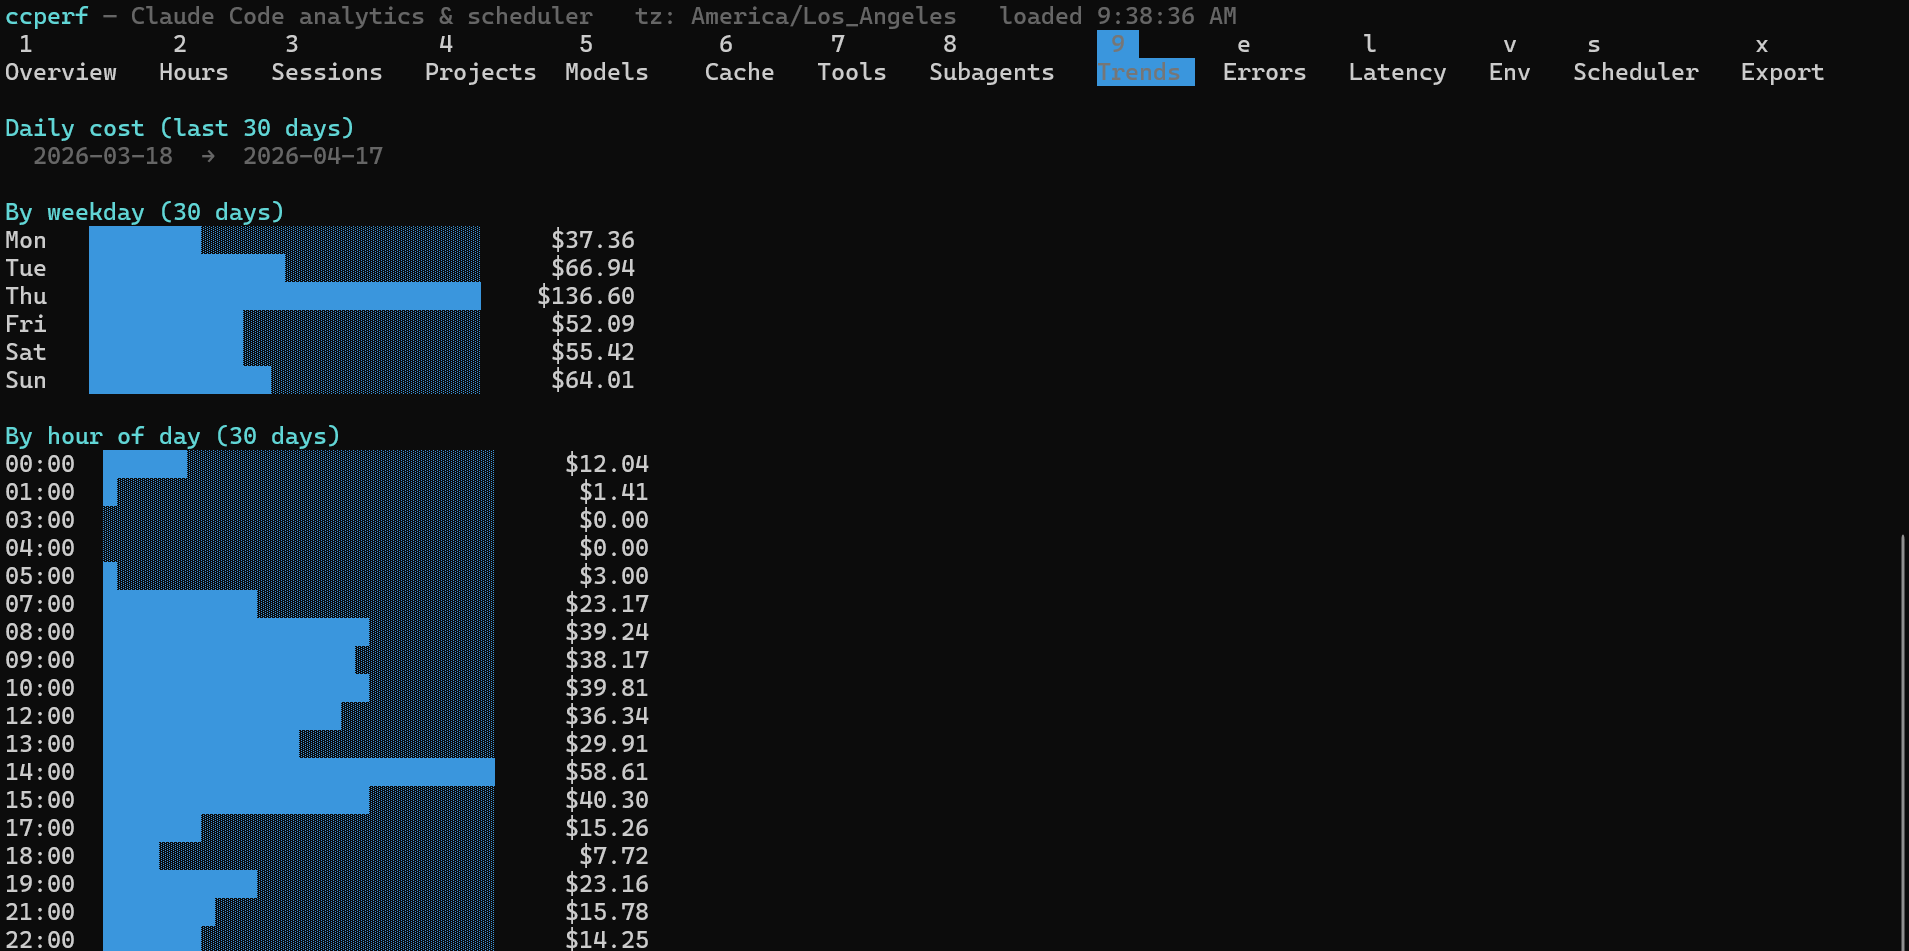
| Trends | 9 |
daily sparkline (30d), weekday, hour-of-day |
| Errors | e |
tool errors, cap hits, telemetry failures |
| Latency | l |
turn duration p50/p95/p99 |
| Env | v |
git branches, entrypoints, versions |
| Scheduler | s |
install status, next fire, history log |
| Export | x |
snapshot everything to JSON/CSV |
In the Hours tab: t cycles the time range, m toggles cost ↔ calls.
Hide tabs you don't want via config.json → layout.hidden: ["trends", "env"].
Cost is computed at Anthropic's pay-per-use API rates (fetched once a day, cached). On a Max subscription this is the theoretical pay-per-use value, not your actual bill.
Cache hit ratio is cache_read / (cache_read + fresh_input + cache_writes) — high values on long sessions mean the prompt cache is carrying most of the token cost.
Fires a cheap claude -p hello command at a fixed time each day so your session window aligns with when you actually want to work.
ccperf scheduler installConfigure in ~/.ccperf/config.json:
{
  "scheduler": {
    "resetAt": "10:00",
    "offsetMinutes": 300,
    "bufferMinutes": 0,
    "backend": "auto",
    "command": "claude -p hello",
    "workingDir": null,
    "taskName": "ccperf-scheduler"
  }
}
Backend auto-detects in this order: schtasks (Windows), launchd (macOS), cron (Linux), daemon (fallback, writes to ~/.ccperf/daemon.json).
Test it:
ccperf scheduler test            # run the command now
ccperf scheduler test --dry-run  # log it without executing
ccperf scheduler status          # see what's installed
ccperf scheduler uninstall       # remove it
Every fire is logged in ~/.ccperf/scheduler.log.
All state lives under ~/.ccperf/ (override with CCPERF_HOME):
config.json— scheduler, tab layout, refresh intervalscheduler.log— fire historycap-hits.jsonl— detected cap hitsdaemon.json— scheduler state when using the fallback backend
On first run, ccperf init asks for:
- Your desired reset time
- The command to fire (default
claude -p hello) - Whether to install the scheduler now
ccperf report prints the same data as the TUI but as plain text, for piping or cron:
ccperf report                         # everything
ccperf report --section overview      # just one section
ccperf report --json                  # machine-readable
ccperf report --since 7d              # last 7 days only
ccperf export writes a full snapshot:
ccperf export --format json --out usage.json
ccperf export --format csv --out usage.csv- Not a cloud service. Nothing is uploaded.
- Not an official Anthropic tool. Cost numbers are best-effort using published API rates.
- Not a live status line — Claude Code ships one;
ccperfis the retrospective + scheduler tool you run alongside it.
cc-logs-helper — the typed parser library. If you want to build your own tool, start there.