The main idea behind this project was to explore the recommendation algorithms in the area of mobile applications, using collaborative filtering to discover the similarity between users and recommend according to the found information. Similar users tend to like similar items, therefore the most important part of the work was to determine the right metric for calculating the similarity distance between users.
The dataset needed for this project was extracted from this location: http://baltrunas.info/research-menu/frappe. The frappe dataset contains 96202 records by 957 users for 4082 apps. The huge amount of apps that can be found on Google Play has made it very difficult for users to discover great and relevant apps, and the solution to this problem has been offered through this project.
The recommendation system has been set to use different metrics, for the sake of comparison between different results that were achieved with different approach. There are four algorithms for calculating similarity distance: Pearson correlation coefficient, Cosine similarity, Manhattan and Minkowski distance. The idea behind each of these algorithms is to calculate similarity between users based on their usage history of apps. The algorithm recommends k apps with the highest value in similarity function, where k is set to be 5 in the given solution, but can be adjusted for different implementations.
The dataset has been split into two files that contain coma separated values (csv). For the implementation of recommendation algorithms, the three most important parts are item, user and rating, which in this case, is represented by the history of user's interaction with certain app. The first file: ''frappe.csv'' contains 11 columns and 96202 rows which represent the user's history with mobile apps, but because of the many unknown items that were discovered, after cleaning the data, there were 90050 rows left, which contained only information about apps that are known in ''meta.csv'' file. In order to have the structure of 'user, item, rating' in the most suited format, the manipulation of dataset was needed. The dataset contains many columns that explain the time or location where certain app has been used. This made tupples of (user, item) ambigous, and required grouping of data for proper counting of usage history which was regulated with python's pandas package. After the cleaning code, the dataset remained with 17530 lines of structured data for user, item and usage history for that specific item by that specific user.
After cleaning the dataset the most important colums that remained were:
- user column contains user id's, and is therefore represented as integer.
- item is a column that contains item id's which can be traced to a different file which contains more detailed information about each of the apps.
- count is a number of times application was used (in a specific context) and was summed for every appearance of couple ('user', 'item')
The second file used is ''meta.csv'' and it contains more detailed information about the applications. The columns it contains give more precise view of the apps, as it has details about the name of the app, category, description. The interesting part of this dataset is the column that contains url path to applications' icons. This was later used in C# to give graphical recommendation of apps. This file has been used to recommend the mobile application by its name based on its id that is given in the first file in item column.
The main idea behind this recommender system is to explore the dataset to discover the similar users to a user being suggested an application. User's ID can be inserted into textbox inside C# form application.

After clicking the 'recommend' button, C# starts the process which opens and executes python script. The argument for python script is the inserted user ID which is then being forwarded through run_cmd function in C# to python.
 .
.
The results of the script are written into files, for each of the metrics used, and C# then reads the neccessery url-s so it can load the pictures into picture boxes on the main form.

Applications that are suggested should not already be used by user for which the recommendation is being built. Instead, the first k applications sorted by the biggest predicted score would be recommended. For each metric used for determining the similarity between users, the results are presented inside a different groupbox on main form.
The Pearson Correlation Coefficient is a measure of correlation between two variables (in this specific case the correlation between two users). It ranges between -1 and 1 inclusive. 1 indicates perfect agreement. -1 indicates perfect disagreement. This way we can use it to find the individual who is most similar to the person we are interested in. The formula for the Pearson Correlation Coefficient, if we have one dataset {x1,...,xn} containing n values and another dataset {y1,...,yn} containing n values then that formula for r is:
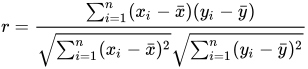
with the sample mean being:
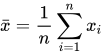
and analogously for 
Cosine similarity is defined as

where · indicates the dot product and ||x|| indicates the length of the vector x. The length of a vector is

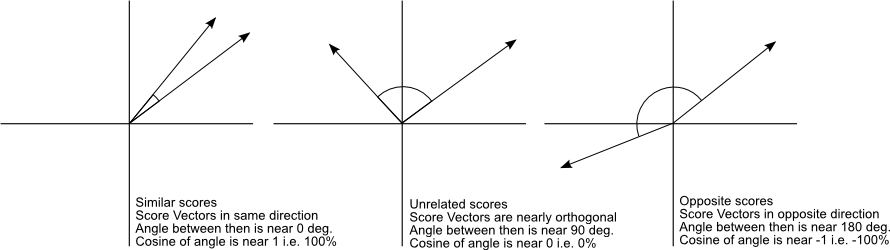
The cosine similarity between two vectors is a measure that calculates the cosine of the angle between them. This metric is a measurement of orientation and not magnitude, it can be seen as a comparison between documents on a normalized space because we’re not taking into the consideration only the magnitude of each word count (tf-idf) of each document, but the angle between the documents.
Manhattan distance
The easiest distance measure to compute is what is called Manhattan Distance or cab driver
distance. In the 2D case, each person is represented by an (x, y) point. I will add a subscript
to the x and y to refer to different people. So (x1, y1) might be A and (x2, y2) might be the B. Manhattan Distance is then calculated by | x1 - x2| + | y1 - y2 |
The absolute value of the
difference between the x values summed with
the absolute value of the difference
between the y values
Minkowski distance - a generalization With Minkowski distance metric we can generalize Manhattan Distance and even Euclidean Distance.

When
- r = 1: The formula is Manhattan Distance.
- r = 2: The formula is Euclidean Distance
- r = ∞: Supremum Distance
With the realization of complete recommender system there were interesting facts that came up regarding the dataset and results. I was able to see that some of the metrics gave similar results, while others went on a completely different path in application recommendation. For instance, user with user id 605 got the same recommendation based on Minkowski and Manhattan similarity function, and all four metrics predicted the Google Search app to be relevant to the user in question.

For user 305 again gets suggested to install same apps by both Minkowski and Manhattan, but in this case, Pearson distance suggests same set of applications matching the two mentioned functions. However, cosine in this case is very far from the remaining three functions, and the first match comes on 14th places in recommended items, whichi is Facebook application, but this is not included in the contraint set for recommendations, in our case, 5 applications.

We can see one more interesting matching with user 11. All four distance measures have obtained two applications in their recommendation sets that matched all others, Facebook and Gmail. In this case, we don't see complete copy between Minkowski and Manhattan and all other applications are quite different in categories and score.

Based on these results, it can be concluded that the best strategy for obtaining the optimal recommendation set would be a mixture of all these methods, but with massive datasets that would be very inefficient. Cosine similarity is a good option with sparse datasets, and Pearson gives best results when used on normalized vectors. Manhattan and Minkowski in this case proved correct, and could be considered the best option because of the multiple times when they matched each other.
This application is written both in Python and C#.
The pandas package has been imported for reading, cleaning and manipulating the csv file with the loadDataSet and cleanDataset functions inside the recommender class.
The overall usage history of application is recorded inside the dictionary which, because of its hashable nature, allowed to join together users and all of their used apps in a most convenient form for recommendation.
The recommender class contains the function which computes the nearest neighbors, in this case, the most similar users. This function is being used in recommend function which requests user id as an input parameter and returns k applications which are best suited for the given user.
Python script is being callend inside C# Form application with new process, and C#, after the execution of the scrit continues to read the needed results. Recommended apps are them presented using picture boxes.
This application has been developed as a part of the project assignment for the subject Intelligent Systems at the Faculty of Organization Sciences, University of Belgrade, Serbia.
The literature that has been used in realization of this project can be found here:
- A programmer's guide to data mining http://guidetodatamining.com/
- Programming collective intelligence by Toby Segaran
This software is licensed under the MIT License.
The MIT License (MIT)
Copyright (c) 2017 Bojana Ranković - bojana.nu@gmail.com
Permission is hereby granted, free of charge, to any person obtaining a copy of this software and associated documentation files (the "Software"), to deal in the Software without restriction, including without limitation the rights to use, copy, modify, merge, publish, distribute, sublicense, and/or sell copies of the Software, and to permit persons to whom the Software is furnished to do so, subject to the following conditions:
The above copyright notice and this permission notice shall be included in all copies or substantial portions of the Software. THE SOFTWARE IS PROVIDED "AS IS", WITHOUT WARRANTY OF ANY KIND, EXPRESS OR IMPLIED, INCLUDING BUT NOT LIMITED TO THE WARRANTIES OF MERCHANTABILITY, FITNESS FOR A PARTICULAR PURPOSE AND NONINFRINGEMENT. IN NO EVENT SHALL THE AUTHORS OR COPYRIGHT HOLDERS BE LIABLE FOR ANY CLAIM, DAMAGES OR OTHER LIABILITY, WHETHER IN AN ACTION OF CONTRACT, TORT OR OTHERWISE, ARISING FROM, OUT OF OR IN CONNECTION WITH THE SOFTWARE OR THE USE OR OTHER DEALINGS IN THE SOFTWARE.