
Live per-IP network monitor for your terminal. Sortable in/out traffic by remote host, with reverse-DNS, WHOIS fallback, and IP-class labels — so you can see who your machine is actually talking to.




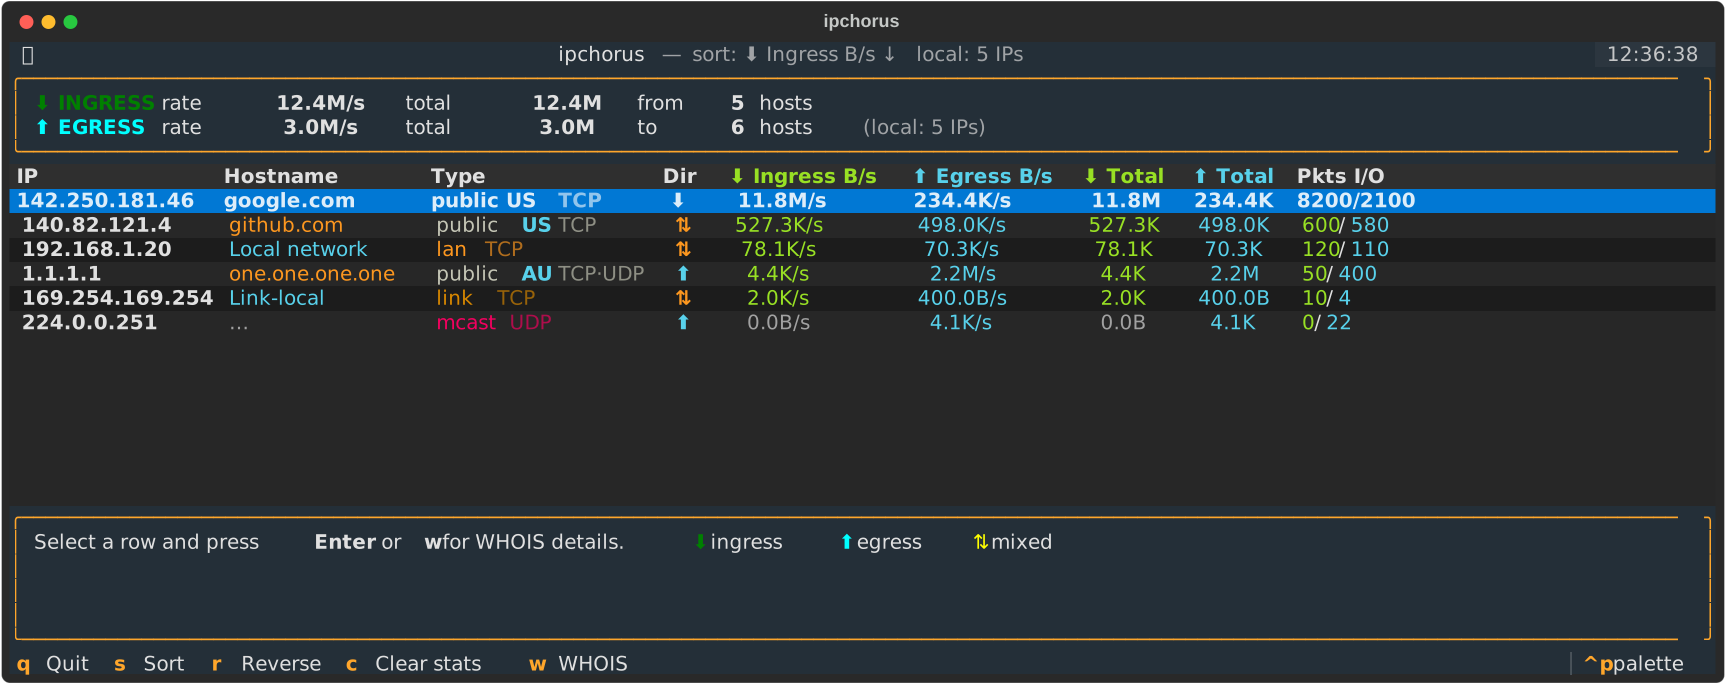
ipchorus answers a single question in one screen: "who is on the other end of every connection my machine has open right now?"
- Aggregates packets per remote IP in real time
- Tells you what kind of peer it is (
public/lan/mcast/bcast/ …) - Resolves the hostname via reverse DNS — and falls back to the WHOIS org name when there's no PTR record
- Lets you drill into any IP for full WHOIS / RDAP details (ASN, network, country, registry)
All in a single keystroke-driven terminal UI. No browser, no agents, no cloud.
- Per-remote-IP traffic table — live ingress/egress rates, totals, packet counts
- Direction indicators with color: ⬇ ingress (green), ⬆ egress (cyan), ⇅ mixed (yellow)
- IP classification column —
public,lan,link,cgnat,mcast,bcast,local,rsvd— including dynamic detection of your own subnet's broadcast address - Protocol awareness — TCP / UDP / ICMP, shown inline per flow
- Asynchronous reverse DNS with on-the-fly caching
- WHOIS / RDAP fallback — when a host has no PTR record, the org name from RDAP fills the Hostname column in italic
- Optional GeoIP enrichment — country code next to every public IP, plus a Geo line in the WHOIS detail, looked up locally from a MaxMind GeoLite2 database (no network calls per lookup, no rate limits)
- Drill-down panel — select any row to see ASN, org, network name, CIDR, country, registry
- Multi-key sorting — cycle through ingress / egress / totals / last-seen / IP, reverse on demand
- IPv4 + IPv6 support
- BPF filter support — focus on a port, host, or VLAN with
--filter - Single-interface mode —
--iface eth0for noisy hosts - Zero web stack — pure terminal, runs over SSH without forwarding
The screenshot above shows the UI with a mix of:
- A public host with a real PTR (
google.com, yellow) - A public host with no PTR — falls back to WHOIS org in italic cyan
- A LAN peer (
lan TCP, yellow class) - A multicast destination (
mcast UDP, magenta — mDNS) - An EC2 metadata endpoint (
link TCP, orange — link-local)
| Component | Version |
|---|---|
| Python | ≥ 3.10 |
| OS | Linux (other UNIX may work; tested on Linux) |
libpcap |
System package — apt install libpcap0.8, pacman -S libpcap, etc. |
uv |
Modern Python package manager — see below |
What is
uv?uvis a fast, all-in-one Python project manager from Astral (the people behindruff). It replacesvenv,pip,pip-tools,virtualenv, andpyenvwith a single ~25 MB binary. One command (uv sync) readspyproject.toml, creates an isolated.venv, installs every dependency at a locked version, and is ready to run. It's the simplest Python toolchain that exists today, which is why ipchorus uses it.
On Linux / macOS:
curl -LsSf https://astral.sh/uv/install.sh | shOn Windows (PowerShell):
powershell -ExecutionPolicy ByPass -c "irm https://astral.sh/uv/install.ps1 | iex"Or via your package manager:
# Arch
sudo pacman -S uv
# Homebrew
brew install uv
# pipx
pipx install uv
Verify it's installed:
uv --versionDon't want
uv? You can still usepython -m venv+pip install .the old way —pyproject.tomlis standards-compliant. Butuv syncis genuinely a single command that does everything, so it's worth the 5 seconds.
git clone https://github.com/aganet/ipchorus.git
cd ipchorus
uv sync                       # creates .venv and installs everything from pyproject.toml + uv.lock
sudo .venv/bin/ipchorus        # run it (needs root for raw-socket capture)
That's it. uv sync is reproducible, fast, and replaces venv + pip + lockfile management. uv sync also installs the ipchorus console script at .venv/bin/ipchorus, so you don't need to publish to PyPI to run it.
If you'd rather not type sudo every time, see Privileges below for granting cap_net_raw once — after that, uv run ipchorus works without sudo.
uv tool install ipchorus     # recommended — isolated, on $PATH globally
# or:  pipx install ipchorus
# or:  pip install ipchorus   # if you have a system Python you don't mind polluting
Either way you get a ipchorus console script.
ipchorus can show a country code next to every public IP and a Geo line in the WHOIS detail panel, looked up locally against a MaxMind GeoLite2 database. It's purely additive — ipchorus works fine without it.
To enable it (one-time):
-
Create a free MaxMind account at https://www.maxmind.com/en/geolite2/signup.
-
Generate a license key in your account dashboard.
-
Run the bundled helper:
.venv/bin/ipchorus --setup-geoip
Paste the key when prompted. The helper downloads the ~6 MB
GeoLite2-Country.mmdbto~/.local/share/ipchorus/and ipchorus picks it up automatically on next launch.
Alternative locations checked on startup, in order:
$IPCHORUS_GEOIP_DB(full path to a.mmdb)~/.local/share/ipchorus/GeoLite2-Country.mmdb/usr/share/GeoIP/GeoLite2-Country.mmdb/var/lib/GeoIP/GeoLite2-Country.mmdb
The MaxMind license is free for personal/internal use. Updates are released weekly; re-run --setup-geoip whenever you want a fresh copy.
# from source (after uv sync)
sudo .venv/bin/ipchorus

# or, with cap_net_raw granted once (see Privileges below), no sudo needed:
uv run ipchorus# Sniff only one interface (faster, less noise)
sudo .venv/bin/ipchorus -i wlan0
# Exclude your SSH session from the view
sudo .venv/bin/ipchorus -f "not port 22"
# Verify your capture privileges without launching the UI
sudo .venv/bin/ipchorus --selftest 5| Flag | Description |
|---|---|
-i, --iface IFACE |
Capture on a single interface (default: all) |
-f, --filter BPF |
BPF expression — e.g. 'tcp and not port 22' |
--selftest [N] |
Non-UI 5-second capture sanity-check; prints top flows + WHOIS |
-h, --help |
Show full help |
| Key | Action |
|---|---|
↑ / ↓ |
Move cursor between rows |
Enter / w |
WHOIS / RDAP lookup for the selected IP |
s |
Cycle sort column |
r |
Reverse sort direction |
c |
Clear all collected stats |
q |
Quit |
| Label | Color | Meaning |
|---|---|---|
public |
white | Routable internet host |
lan |
yellow | RFC 1918 (10/8, 172.16/12, 192.168/16) or ULA (fc00::/7) |
link |
orange | Link-local (169.254/16, fe80::/10) |
cgnat |
magenta | Carrier-grade NAT (100.64.0.0/10) |
mcast |
magenta | Multicast (mDNS, SSDP, IGMP, IPv6 all-nodes, …) |
bcast |
red bold | Broadcast — 255.255.255.255 or your subnet broadcast |
local |
dim | Loopback (127/8, ::1) |
rsvd |
dim | Reserved / unspecified ranges |
Subnet broadcasts are computed dynamically at startup from your interface netmasks (via psutil), so DHCP/ARP-style chatter on your LAN lights up in red.
Packet capture requires CAP_NET_RAW (and CAP_NET_ADMIN for some filter operations). Three ways to grant it:
# 1. Run as root (simplest)
sudo .venv/bin/ipchorus

# 2. Grant capability to your venv's Python binary (run once)
sudo setcap cap_net_raw,cap_net_admin=eip "$(realpath .venv/bin/python3)"
uv run ipchorus                  # no sudo needed afterwards

# 3. Run inside a container with --cap-add=NET_RAW
Security note — granting
cap_net_rawto a Python binary lets any script run by that interpreter sniff packets. Prefer option (1) unless you understand the implication.
                  ┌─────────────────────┐
   packets   →    │  scapy AsyncSniffer │  (background thread)
                  └──────────┬──────────┘
                             │ per-packet callback
                  ┌──────────▼──────────┐
                  │   TrafficTracker    │  defaultdict[IP → FlowStats]
                  │   lock-protected    │  bytes/pkts/protocols/last_seen
                  └──────────┬──────────┘
                             │ snapshot() every 1 s
                  ┌──────────▼──────────┐        ┌──────────────┐
                  │   IPChorusApp        │ ←──────│ DNSResolver  │  ThreadPool, LRU
                  │   (Textual UI)      │        └──────────────┘
                  │                     │        ┌──────────────┐
                  │   DataTable + bars  │ ←──────│ WhoisLookup  │  ipwhois / RDAP
                  └─────────────────────┘        └──────────────┘
- Capture: scapy
AsyncSnifferruns in its own thread, fed by libpcap. - Aggregation: every packet → direction is decided by matching
src/dstagainst the set of local IPs; bytes & protocol are added to the per-remote-IPFlowStats. Lock-protected for safe concurrent reads. - Reverse DNS:
socket.gethostbyaddrruns in a 4-worker thread pool. Results are cached (including negative cache — empty string means "tried, no PTR"). - WHOIS / RDAP:
ipwhoisdoes an RDAP lookup (modern WHOIS). The lookup pool is idempotent — multiple requests for the same IP coalesce into a single network call. Fallback population (showing the org instead of hostname) is throttled to the top 50 visible rows to avoid spamming RDAP registries. - UI: Textual refreshes the data table every second; rows are re-rendered with
rich.text.Textso coloring and styles survive the cell layout.
I wanted to build the simplest possible terminal tool that gives me the most informational view of my host's network — at a glance, in one screen, without a daemon, a web UI, or a config file.
The goal was a tool I could sudo into on any Linux box and immediately know:
- who am I talking to right now (IP + hostname or org),
- in which direction the traffic is flowing,
- what kind of peer they are (public, LAN, multicast, broadcast, …),
- and how loud they are (live bytes in/out, packet counts).
Everything in ipchorus exists to serve that single question. No more, no less.
Planned, in rough priority order:
- Persistent rDNS / WHOIS / GeoIP cache (survive restarts)
- GeoIP enrichment (MaxMind GeoLite2-Country) — see Optional: GeoIP enrichment
- Per-process attribution via
/proc/net/{tcp,udp}cross-reference - Export / pcap-replay mode
- Configurable color theme via TOML
- Multi-host aggregation (read pcap from remote tap)
Explicit non-goals: a web UI, an agent/daemon, packet payload inspection, IDS-style alerting. The tool is meant to stay a focused, one-file terminal monitor.
PRs and issues welcome. To set up a dev environment:
git clone https://github.com/aganet/ipchorus.git
cd ipchorus
uv sync

# Quick smoke check (no UI)
sudo .venv/bin/ipchorus --selftest 5
The codebase is a single file (ipchorus.py) for now — kept that way deliberately for hackability. Please:
- Open an issue first for non-trivial changes.
- Keep new features behind an explicit flag if they change default behavior.
- Add a row to the IP-class reference table if you add a new classification.
MIT © aganet