

Tool + app for visualizing time series data.
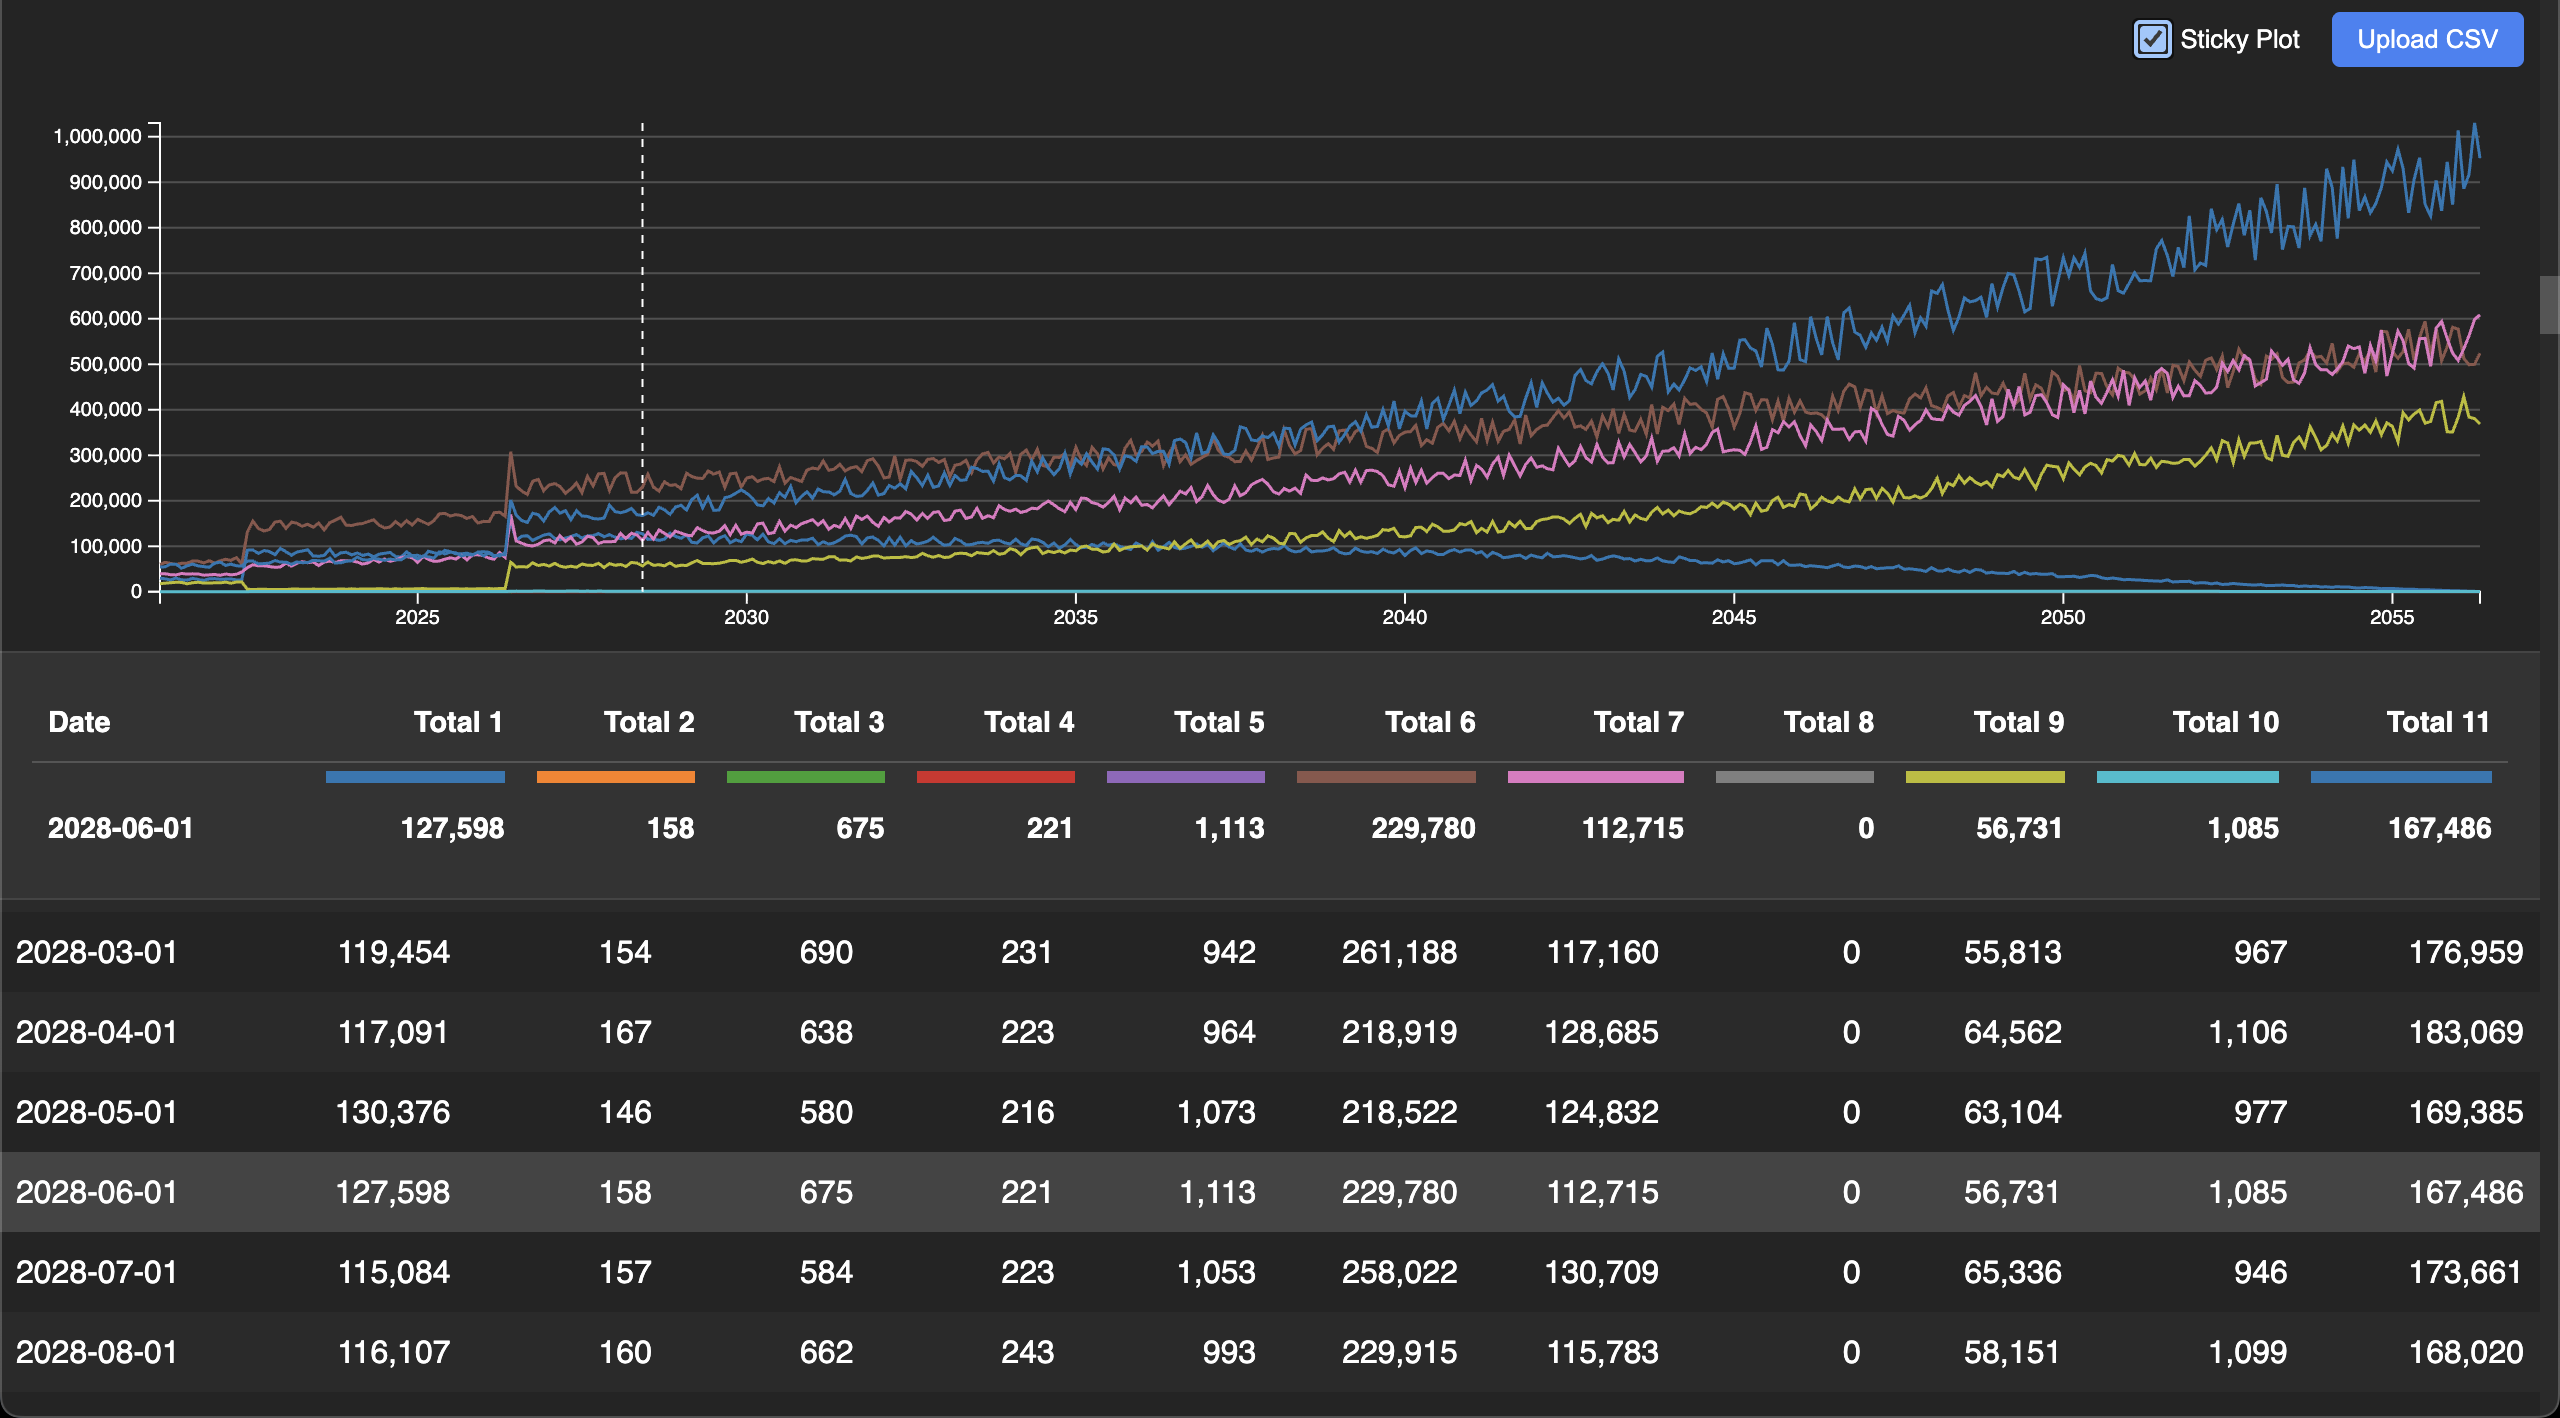
Visit https://aaronstacy.com/plottimeseries
You can also update the CSV file using the button in the upper right corner, and share what you are looking at with the button next to it. The data is read locally, nothing ever leaves your browser.
[An example of this link doesn't work with GitHub Markdown rendering][example_csv_hash], but you can find it in at the bottom of the source of this README.md file.
The Share Link button in the upper right builds that link out of whatever
the page is currently plotting -- uploaded file included -- and copies it to
your clipboard. The CSV is gzip'd and encoded in the browser, so the data still
never leaves your machine. (If the clipboard is not available, the link is put
in the address bar instead.) A report opened from disk has no button: its
file:// link would only open for someone who already has that file.
The link itself is a gzip'd + base64 encoded CSV in the URL fragment
#csv=.... Plain URL encoded text in the ?csv= query parameter also works,
but that is sent to the server as a request. To build the URL from a shell
instead, you can run:
printf 'https://aaronstacy.com/plottimeseries#csv=%s' "$(gzip -nc your.csv | base64 | tr -d '\n' | tr '+/' '-_' | tr -d '=')"This only works for smaller files, typically < 3 MB or so.
#csv=... also takes plain URL encoded text, the same thing ?csv=... takes,
so a small hand-written link can skip the gzip pipeline and still keep the data
out of the request:
printf 'https://aaronstacy.com/plottimeseries#csv=%s' "$(jq -sRr @uri < your.csv)"Which of the two a link uses is read off the payload, with no flag to set:
base64url spells everything in A-Z a-z 0-9 - _ =, and a CSV needs at least the
comma between its date column and a value column, so anything holding a
character outside that alphabet is read as text. Gzip is what makes a whole
dataset fit; URL encoding costs about three bytes per comma and newline.
Every commit on main publishes prebuilt artifacts to the
latest release.
Neither of them needs npm, a checkout, or a build:
-
plottimeseries.cjs, a single JavaScript file that runs on any stable Node.js:node plottimeseries.cjs path/to/your/file.csv > index.html -
plottimeseries-<platform>.tar.gz, holding the sameplottimeseries.cjsplus two standalone executables that do not need Node.js at all:tar -xzf plottimeseries-linux-x64.tar.gz ./plottimeseries path/to/your/file.csv > index.html ./plottimeseries-compiled path/to/your/file.csv > index.html
All three do the same thing and print the same bytes.
plottimeseriesis a Node.js single executable application of the script above injected into a copy of the Node.js binary.plottimeseries-compiledis the same program compiled to native code by scriptc, with no JavaScript engine in it at all, so it is smaller and starts faster.
Then open index.html in a web browser.
From a checkout the same thing is npm run build:
- Clone this repository
- Install dependencies:
npm install - Build the assets:
npm run build path/to/your/file.csv > index.html - Open
index.htmlin a web browser
npm run build:standalone builds all three artifacts locally into dist/. Both
executables are built for the platform you run it on: the single executable
application embeds whichever Node.js ran the build, and the compiled one needs
clang on PATH. If scriptc cannot compile, the build says so and carries on
with the other two.
The CLI has to stay inside the subset of TypeScript that scriptc compiles
statically, which is why scripts/cli.ts and everything it imports avoid
throw, regular expressions and DOM types. npm run scriptc:coverage reports
what does not compile, and npm run validate runs it, so drifting out of the
subset fails there rather than quietly dropping the compiled executable
from a release.
The CSV can also be piped in on stdin, and the y scale can be pinned with
--y-max / --y-min (note the -- that stops npm from eating the flags):
npm run build -- --y-max 100 --y-min 0 path/to/your/file.csv > index.html
cat path/to/your/file.csv | npm run build -- --y-max 100 > index.html
The prebuilt artifacts take the same arguments, without the --:
cat path/to/your/file.csv | ./plottimeseries --y-max 100 > index.htmlIn the app the same settings are available as yMax / yMin query parameters.
A column header can carry a style spec in curly braces. Commas inside the braces do not split the CSV field, so all three of these are equivalent:
date,col1{type: decimal, places: 2},col2
date,col1{type:'decimal'\, places: 2},col2
date,"col1{type: decimal, places: 2}",col2| Key | Values | Effect | Example |
|---|---|---|---|
type |
percent, decimal, integer, currency |
How numbers are formatted, instead of guessing from the data range | all four |
places |
integer 0-20 | Decimal places (decimals also works) |
0 vs 4 |
currency |
ISO code, e.g. eur |
Currency for type: currency, defaults to USD |
eur and jpy |
color |
any CSS color | Line and legend color, instead of the generated one | named and hex |
label |
any text | Header text, instead of the prettified column name | avg_temp_c renamed |
plot |
false |
Keep the column in the tables but leave it off the plot | volume in the table only |
For example (open it):
date,ratio{type: percent, places: 2},revenue{type: currency, color: #d62728},id{plot: false, label: 'Trade ID'}
2026-01-01,0.7,1234.5,A-1
2026-01-02,0.62,2310.25,A-2
2026-01-03,0.81,1875.4,A-3
2026-01-04,0.55,2640.75,A-4
Those links all put the CSV in the ?csv= query parameter as plain URL-encoded
text, so they can be pasted into a URL decoder to see exactly what they set.
Unrecognized keys and values are ignored, so a typo in a spec cannot break the
plot. Column names are matched after the spec is stripped, so col1{...} is
still the column col1 everywhere else.
A lot of time series data just has a date, and frequently those can be duplicated, which renders weirdly. The Spread Duplicate Dates checkbox next to that button nudges rows that share a date apart along the time axis, so rows on the same date read as separate points rather than one hiding the others (example).
npm installnpm run dev- Open
http://localhost:3000in a web browser
To validate changes, run npm run validate.
The standalone artifacts are built separately, since scriptc and the single executable application need a toolchain rather than a sandbox:
npm run build:standalone./dist/plottimeseries public/data.csv > /dev/null && ./dist/plottimeseries-compiled public/data.csv > /dev/null
The generated report is a single self-contained HTML file with the CSV, styles and bundle inlined, so it can be locked down tightly:
- Content-Security-Policy, generated in
scripts/securityHeaders.tsand emitted as a<meta>tag byscripts/report.ts. It isdefault-src 'none'plus a sha256 hash for each inline<script>and<style>, so nothing runs but the exact bundle that was built.npm run validaterecomputes the hashes from the built page and fails if they and the policy have drifted apart. Because it sits inrenderReport, every artifact emits it —npm run build, the.cjs, the executable and the compiled binary still print the same bytes. It stays inside the scriptc subset for that reason:node:crypto's sha256 compiles statically, so the binary needs no JavaScript engine to produce it. - No
unsafe-eval. CSV parsing usesd3.csvParseRowsrather thand3.csvParse, because the latter compiles a row-to-object function withnew Functionout of the column names — which, for this app, can come from the?csv=query parameter. _headers, written next to the site by--headers-file. GitHub Pages ignores it — it is the Cloudflare Pages / Netlify convention — but it is the only way to deliverframe-ancestors,X-Frame-OptionsandX-Content-Type-Options, so it is generated for the day the site moves to a host that reads it.- Framing. Since GitHub Pages cannot send
X-Frame-Optionsand a<meta>CSP ignoresframe-ancestors, the app refuses to render when it is not the top window (src/frameGuard.ts). That check travels with the file, so it also applies to a report opened from disk. - Decompression limits.
#csv=hands attacker-controlled bytes to a gzip decoder, and gzip reaches about 1032:1 — a link small enough to paste into a chat message expands to gigabytes.src/csvFragment.tsdecompresses as a stream and aborts once the output passes 32 MiB, so a hostile link fails with a message instead of taking the tab with it. - Nothing is ever sent to a server. The fragment exists so that sharing a dataset does not require a server to store it. There is no endpoint to authenticate, no bucket to leave public, and no credential in the browser — the security property is that the data never leaves the machine that has it.
- CI requests no token scopes by default, pins actions to commit SHAs,
checks out without persisting credentials, and installs with
--ignore-scripts.