GUI Guide
The desktop application (Tacho Explorer, app/gui.py) provides a two-pane explorer for digital tachograph data: a regedit-style section tree on the left and, on the right, either an Excel-style data table or an interactive chart.
-
Windows: Double-click
TachoReader.exe. -
macOS: Right-click
TachoReader→ Open. -
From source:
python app/gui.py.
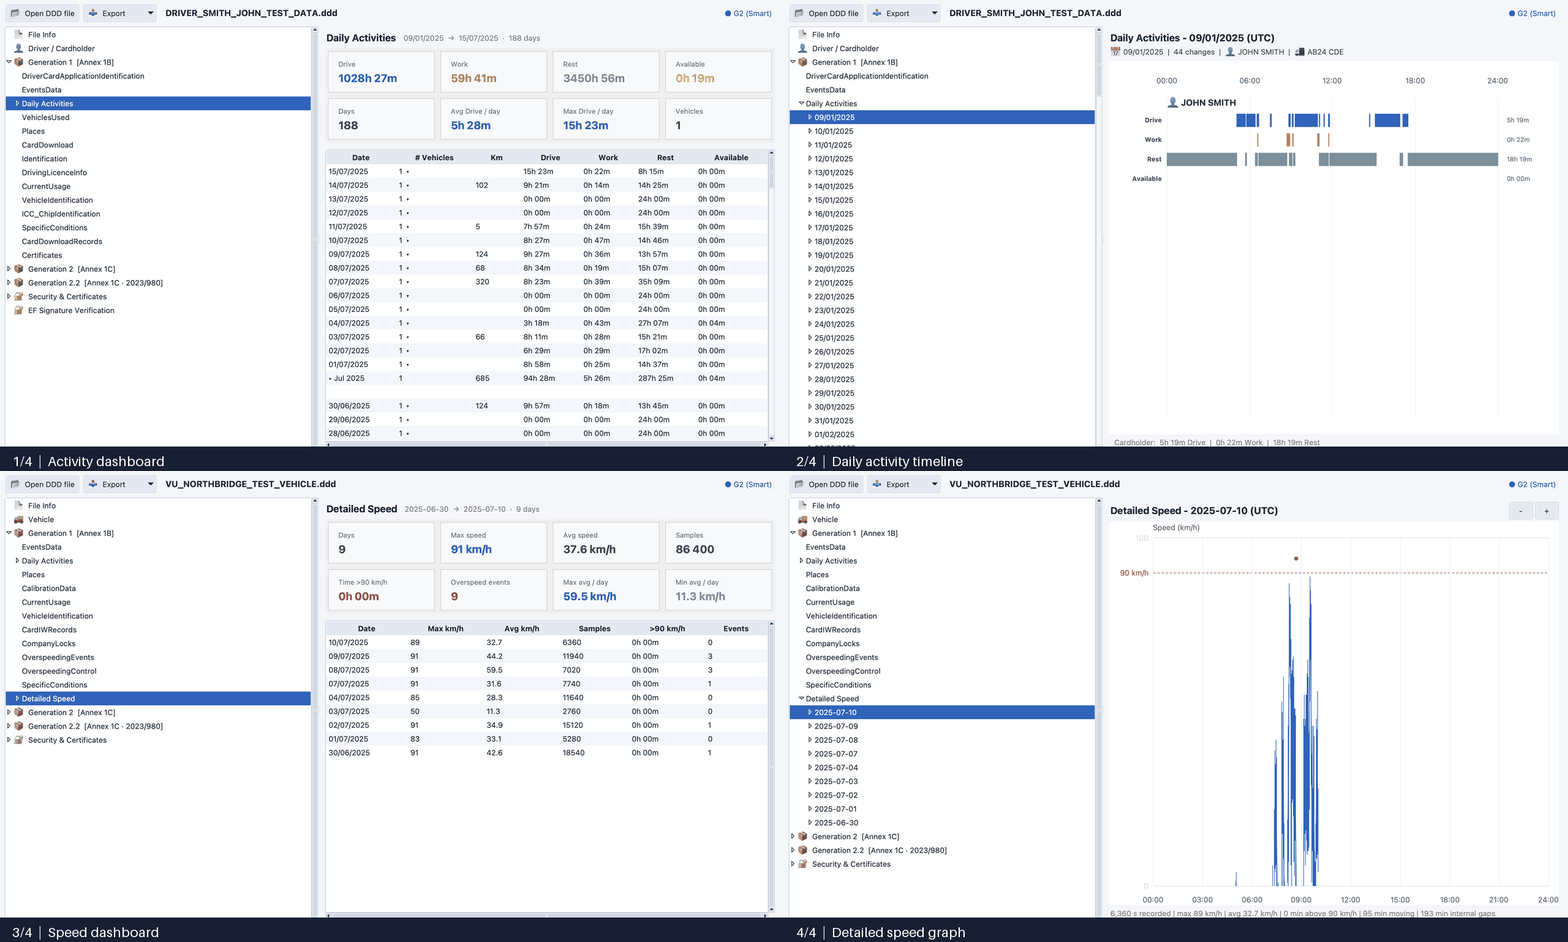
Activity dashboard · daily activity timeline · speed dashboard · detailed speed graph. Preview uses anonymized test data.
| Control | Action |
|---|---|
| 📂 Open DDD file | Opens a file dialog to select a .ddd file |
| 📤 Export | Drop-down menu: PDF (.pdf), Excel (.xlsx), CSV (.csv), JSON (.json) |
| File label | Name of the currently loaded file |
| Integrity banner | Warning shown only when there is a problem — click it for full details |
| Generation badge | Detected generation (G1, G2, G2.2) and file type (Card / VU) |
Parsing runs in a background thread — a progress bar appears in the status bar while a file is loading, and the window stays responsive.
The integrity banner stays quiet when a file verifies cleanly. It only appears when there is something worth your attention, and clicking it opens a details popup covering:
- TREP completeness — which mandatory download sections are present, missing, or suspect.
- Cryptographic validation — the signature chain result (ERCA → MSCA → Card/VU) and, for cards, EF signature verification.
- Recovered data — anything reconstructed by best-effort salvage of a partial/corrupted download.
Possible signature outcomes include Verified, partial variants (e.g. Verified (Local Chain), Verified (VU Chain), Missing ERCA), an Invalid Certificate Chain failure, or a Parse error. A partial or missing chain means the data is still readable — only the cryptographic proof is incomplete.
The tree organizes all parsed data into sections. Clicking a section shows its records (as a table or chart) on the right. Typical top-level sections:
| Section | Contents |
|---|---|
| File Info | File name, origin (Driver Card / Vehicle Unit, including "from VU download"), generation, integrity, decoder failures |
| 👤 Driver / Cardholder | Card holder identity (driver card files) |
| 🚚 Vehicle | VIN, plate, registration nation, tachograph (next calibration, tyre size, authorised speed) |
| 📊 Activity & Usage | Daily activities (day-by-day hierarchy with charts), vehicles used, events, faults, places, calibrations, control activities, and more |
| 🛰️ G2.2 — Smart V2 | GNSS accumulated driving, GNSS places, border crossings, load/unload records, load sensor, trailers |
| 🚚 Vehicle Unit (VU) | VU identification, sensor pairings, card insertions/withdrawals, time adjustments, company locks, downloads, power interruptions, overspeeding control, ITS consents, detailed speed |
| 🔐 Security & Certificates | Certificates and signature verification details |
| 🧩 Raw Tags | Every raw tag occurrence, for low-level inspection |
Sections only appear when the loaded file actually contains that kind of data — a G1 driver card will not show the G2.2 or VU groups.
Nation fields (registration, issuing, sensor) are shown with their full English country name (e.g. Italy, Germany) rather than the raw code.
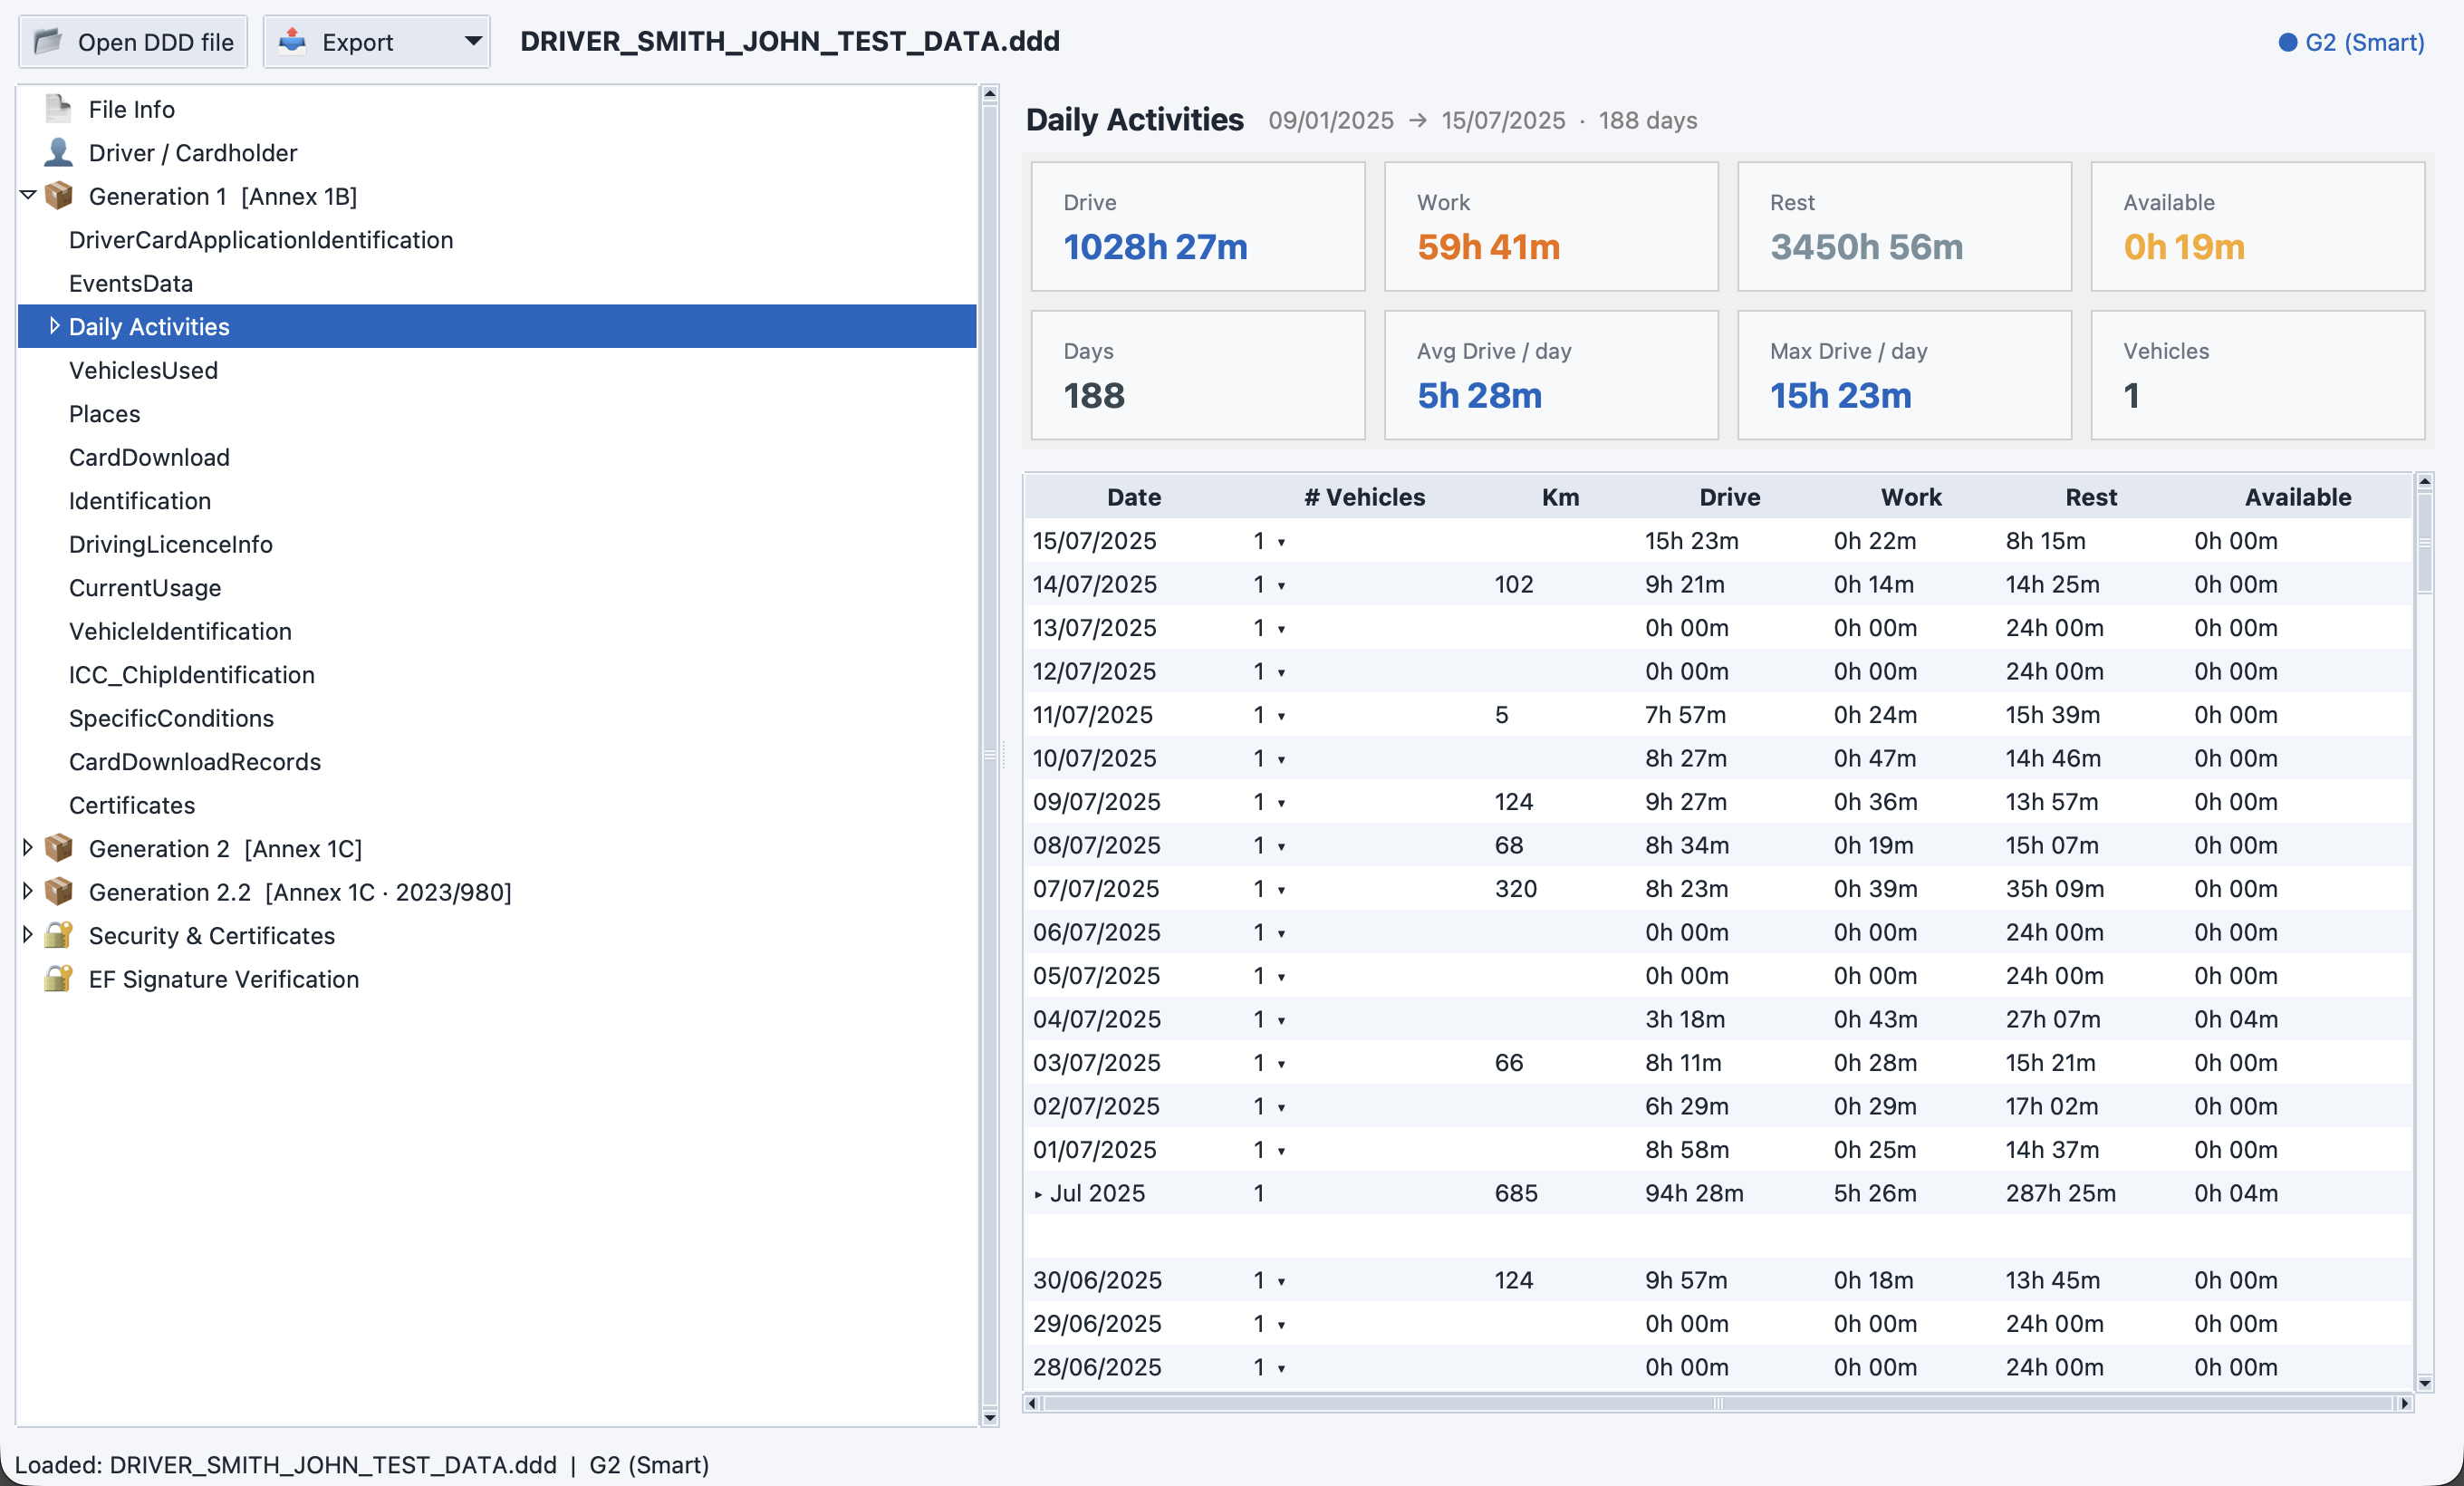
Selecting the Daily Activities parent node opens an activity dashboard: KPI cards (total drive/work/rest hours, active days) plus a table grouped by month with per-month totals.
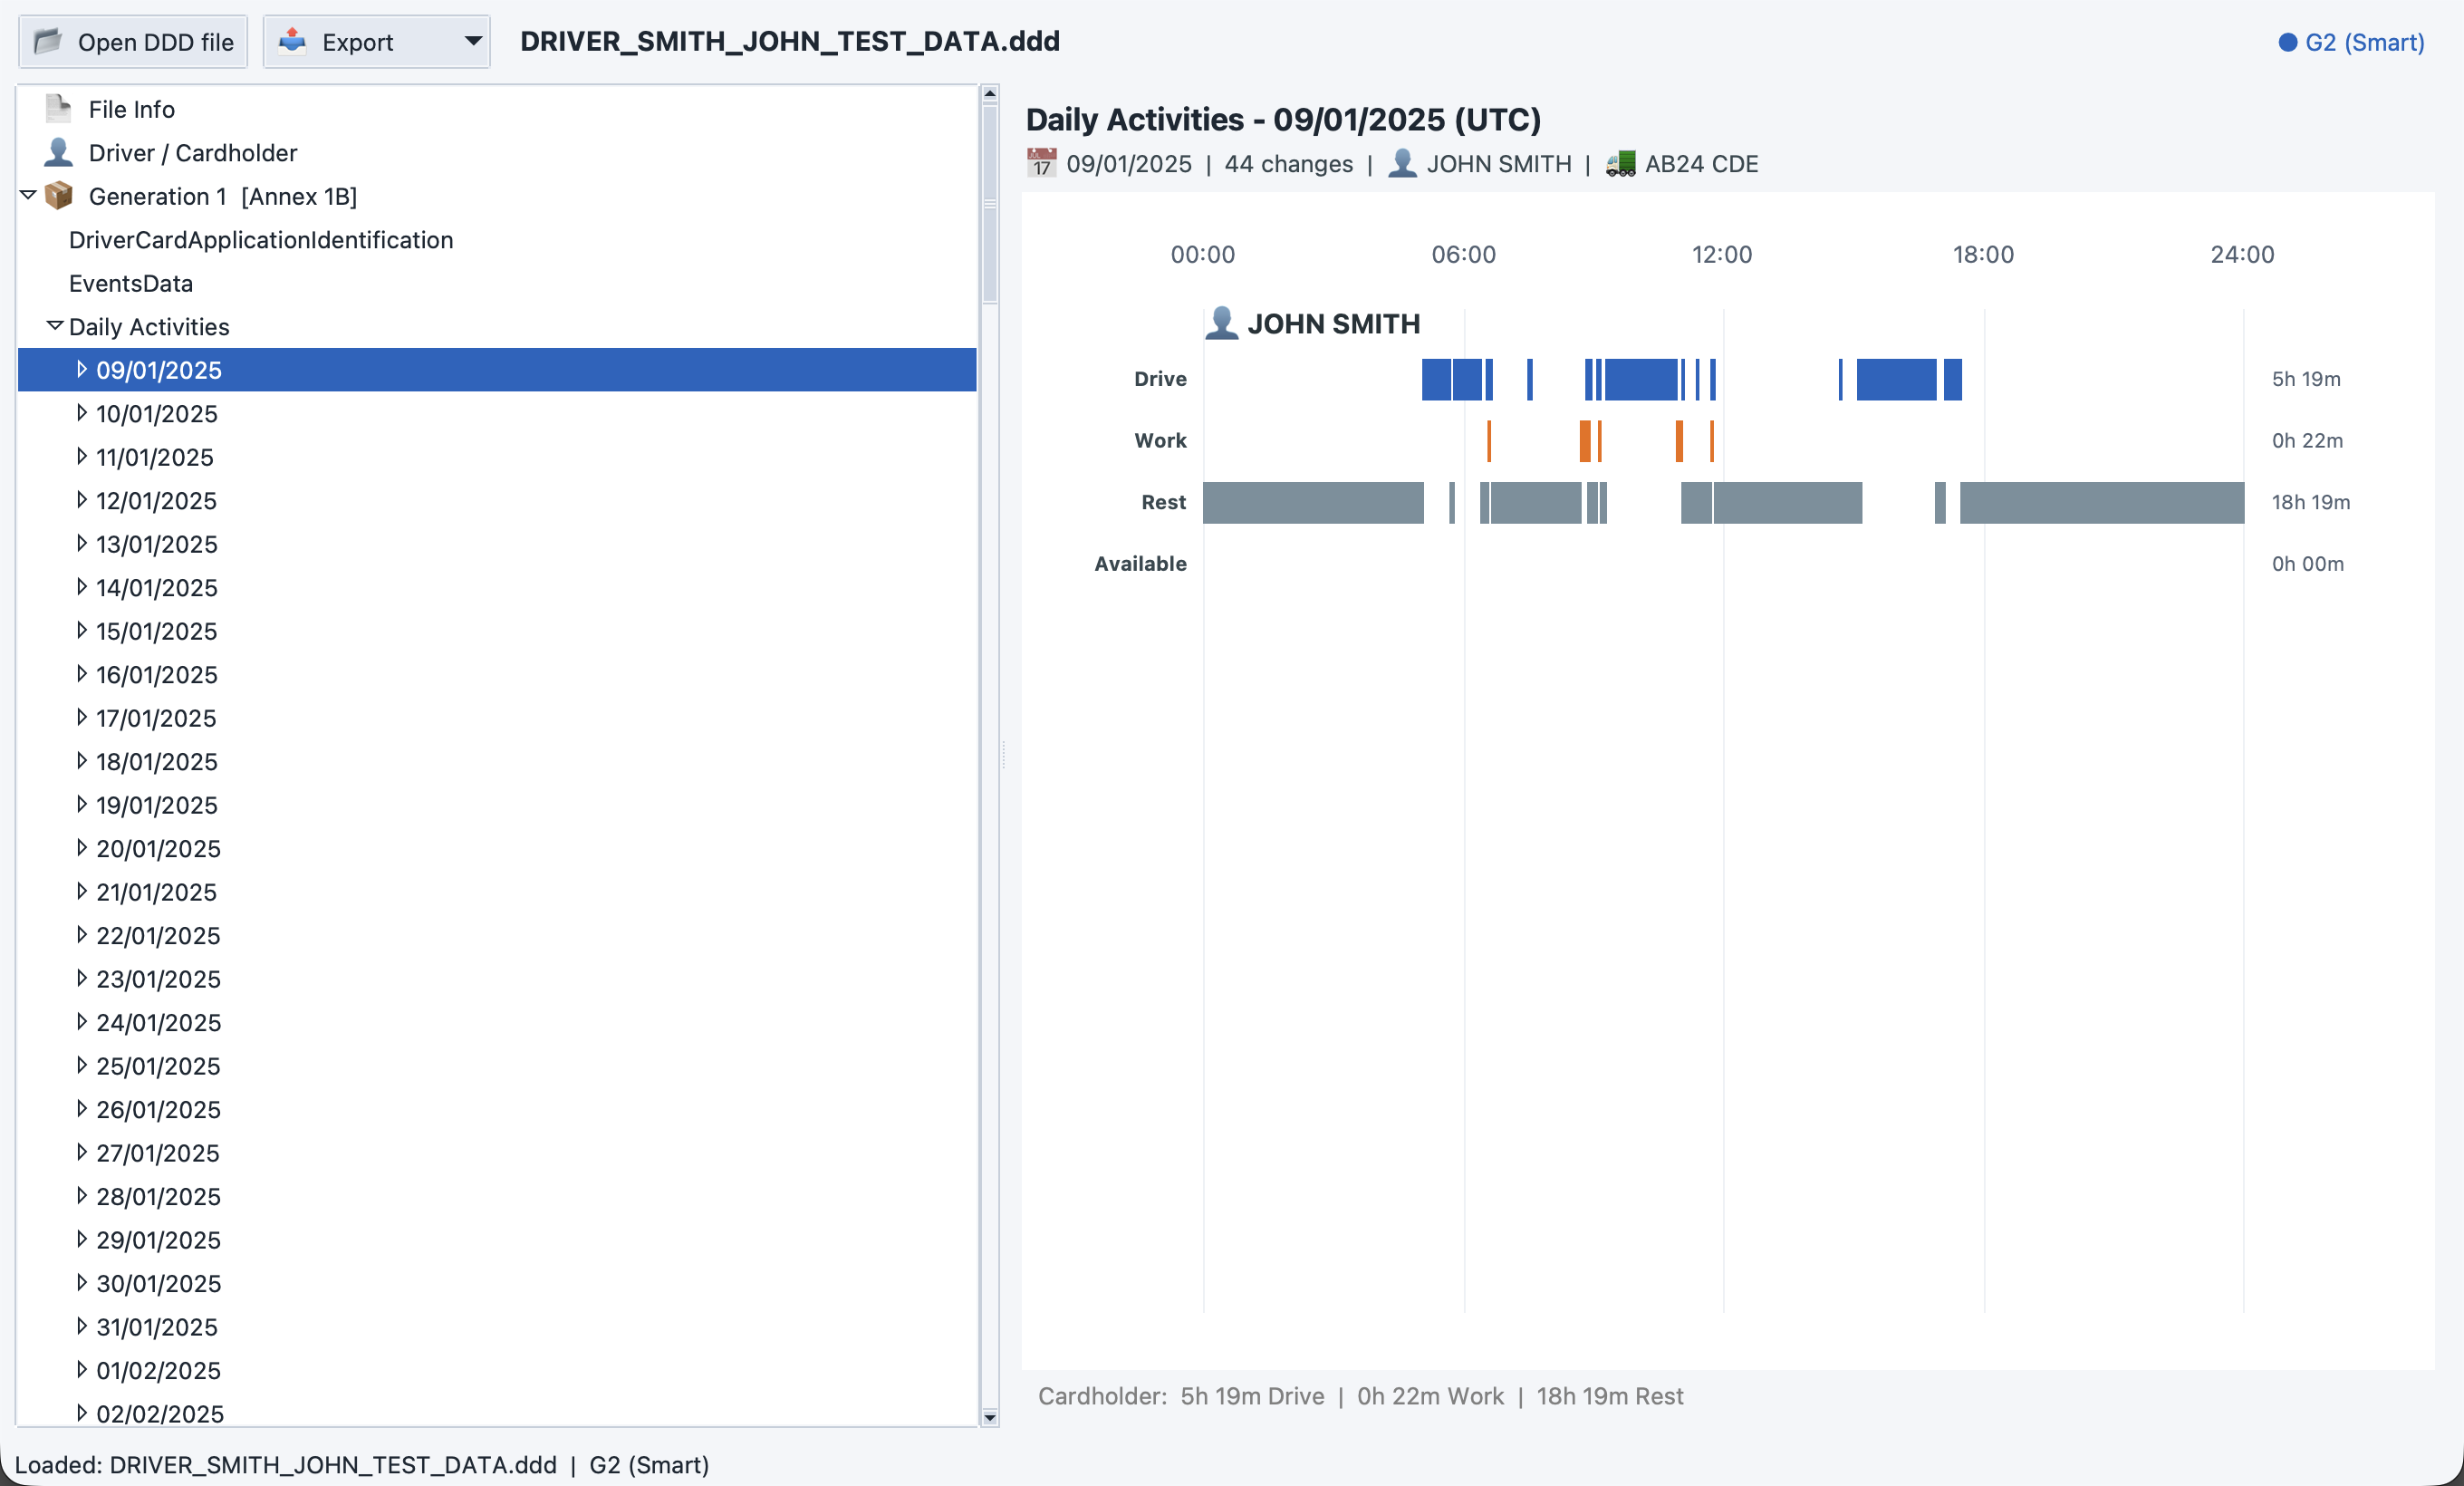
Expanding the node lists one entry per day. Selecting a day opens the activity timeline chart:
- A 24-hour timeline with coloured bands for Drive, Work, Available, and Rest/Break.
- Crew (dual-slot) days are drawn per slot, so two drivers recording at once are not flattened together.
- Out-of-scope periods and specific-condition markers appear as triangles.
- For driver-card files, the info line shows the vehicle(s) driven that day — a single plate, or every plate with its start–end window when the driver changed vehicle during the day.
Each day also keeps a raw-record child table (time, activity type, card slot, crew status, odometer, daily counter).
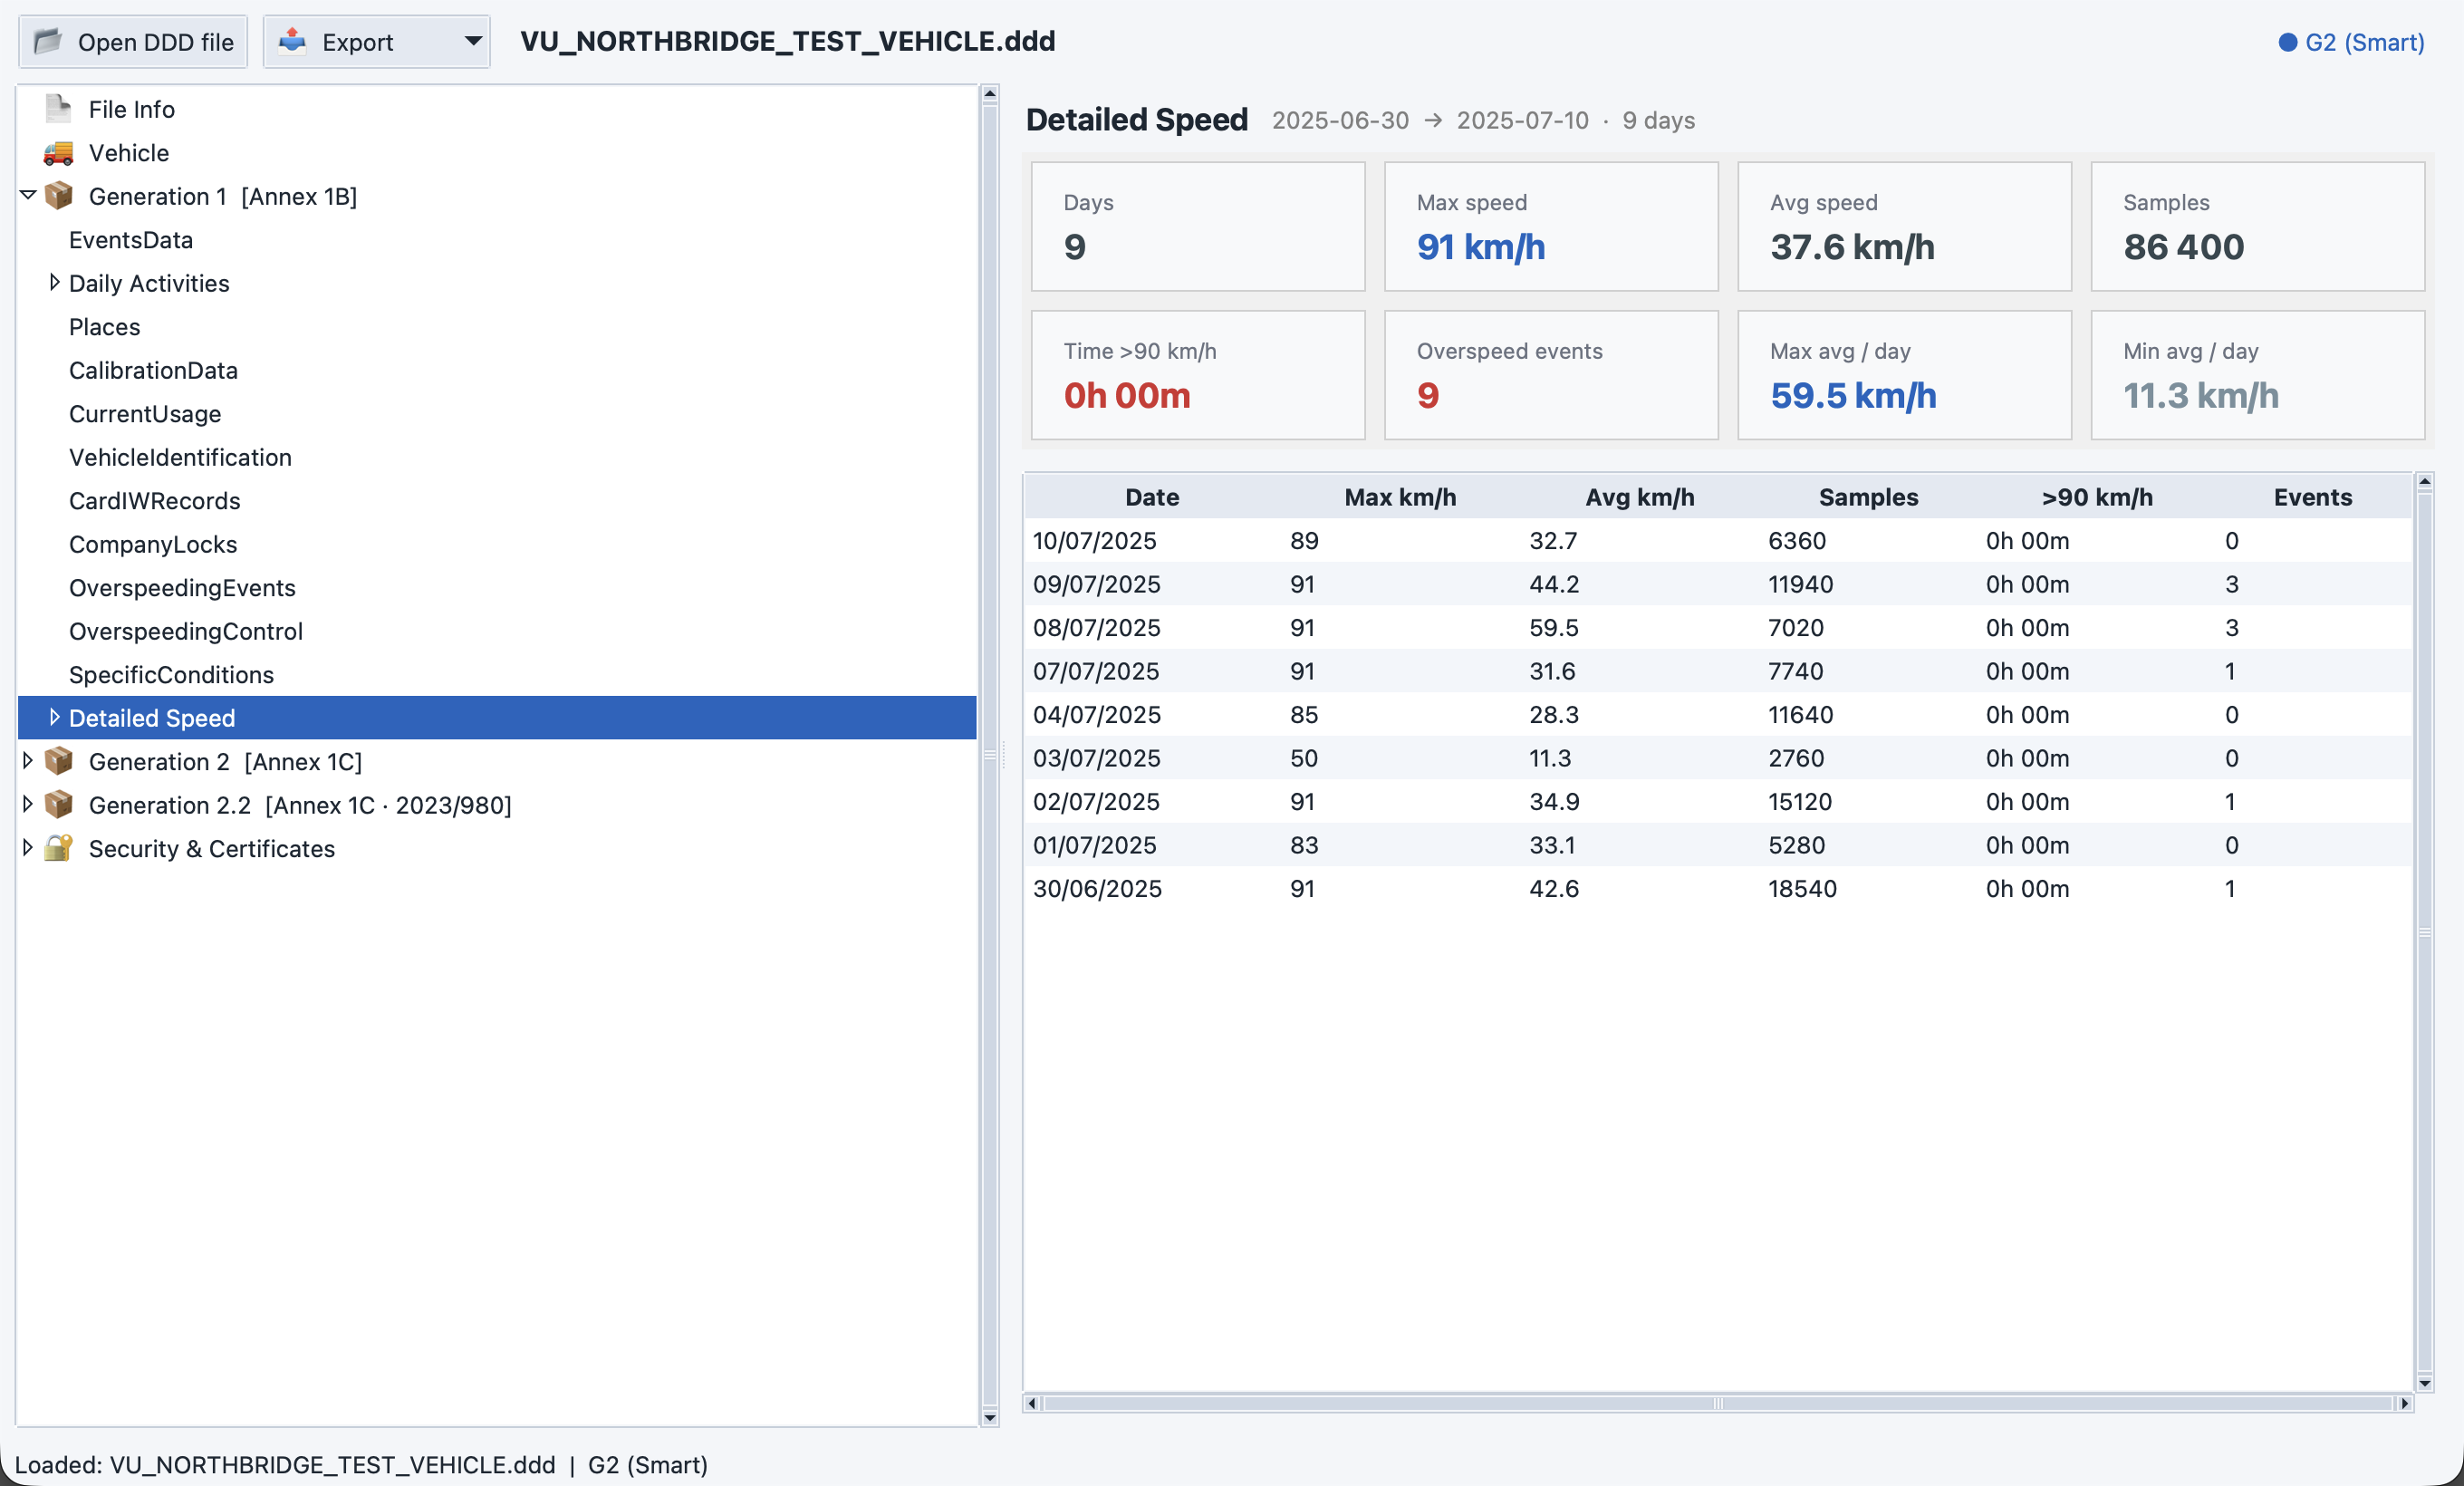
Selecting Detailed Speed opens a speed dashboard (KPI cards + per-day statistics). Expanding it lists each day; selecting a day opens the speed graph:
- The recorded speed curve over the day (UTC).
- Overspeeding events flagged as red markers with hover details.
- The authorised speed limit (from calibration, otherwise the default) drawn as a reference line, with the over-speed zone shaded.
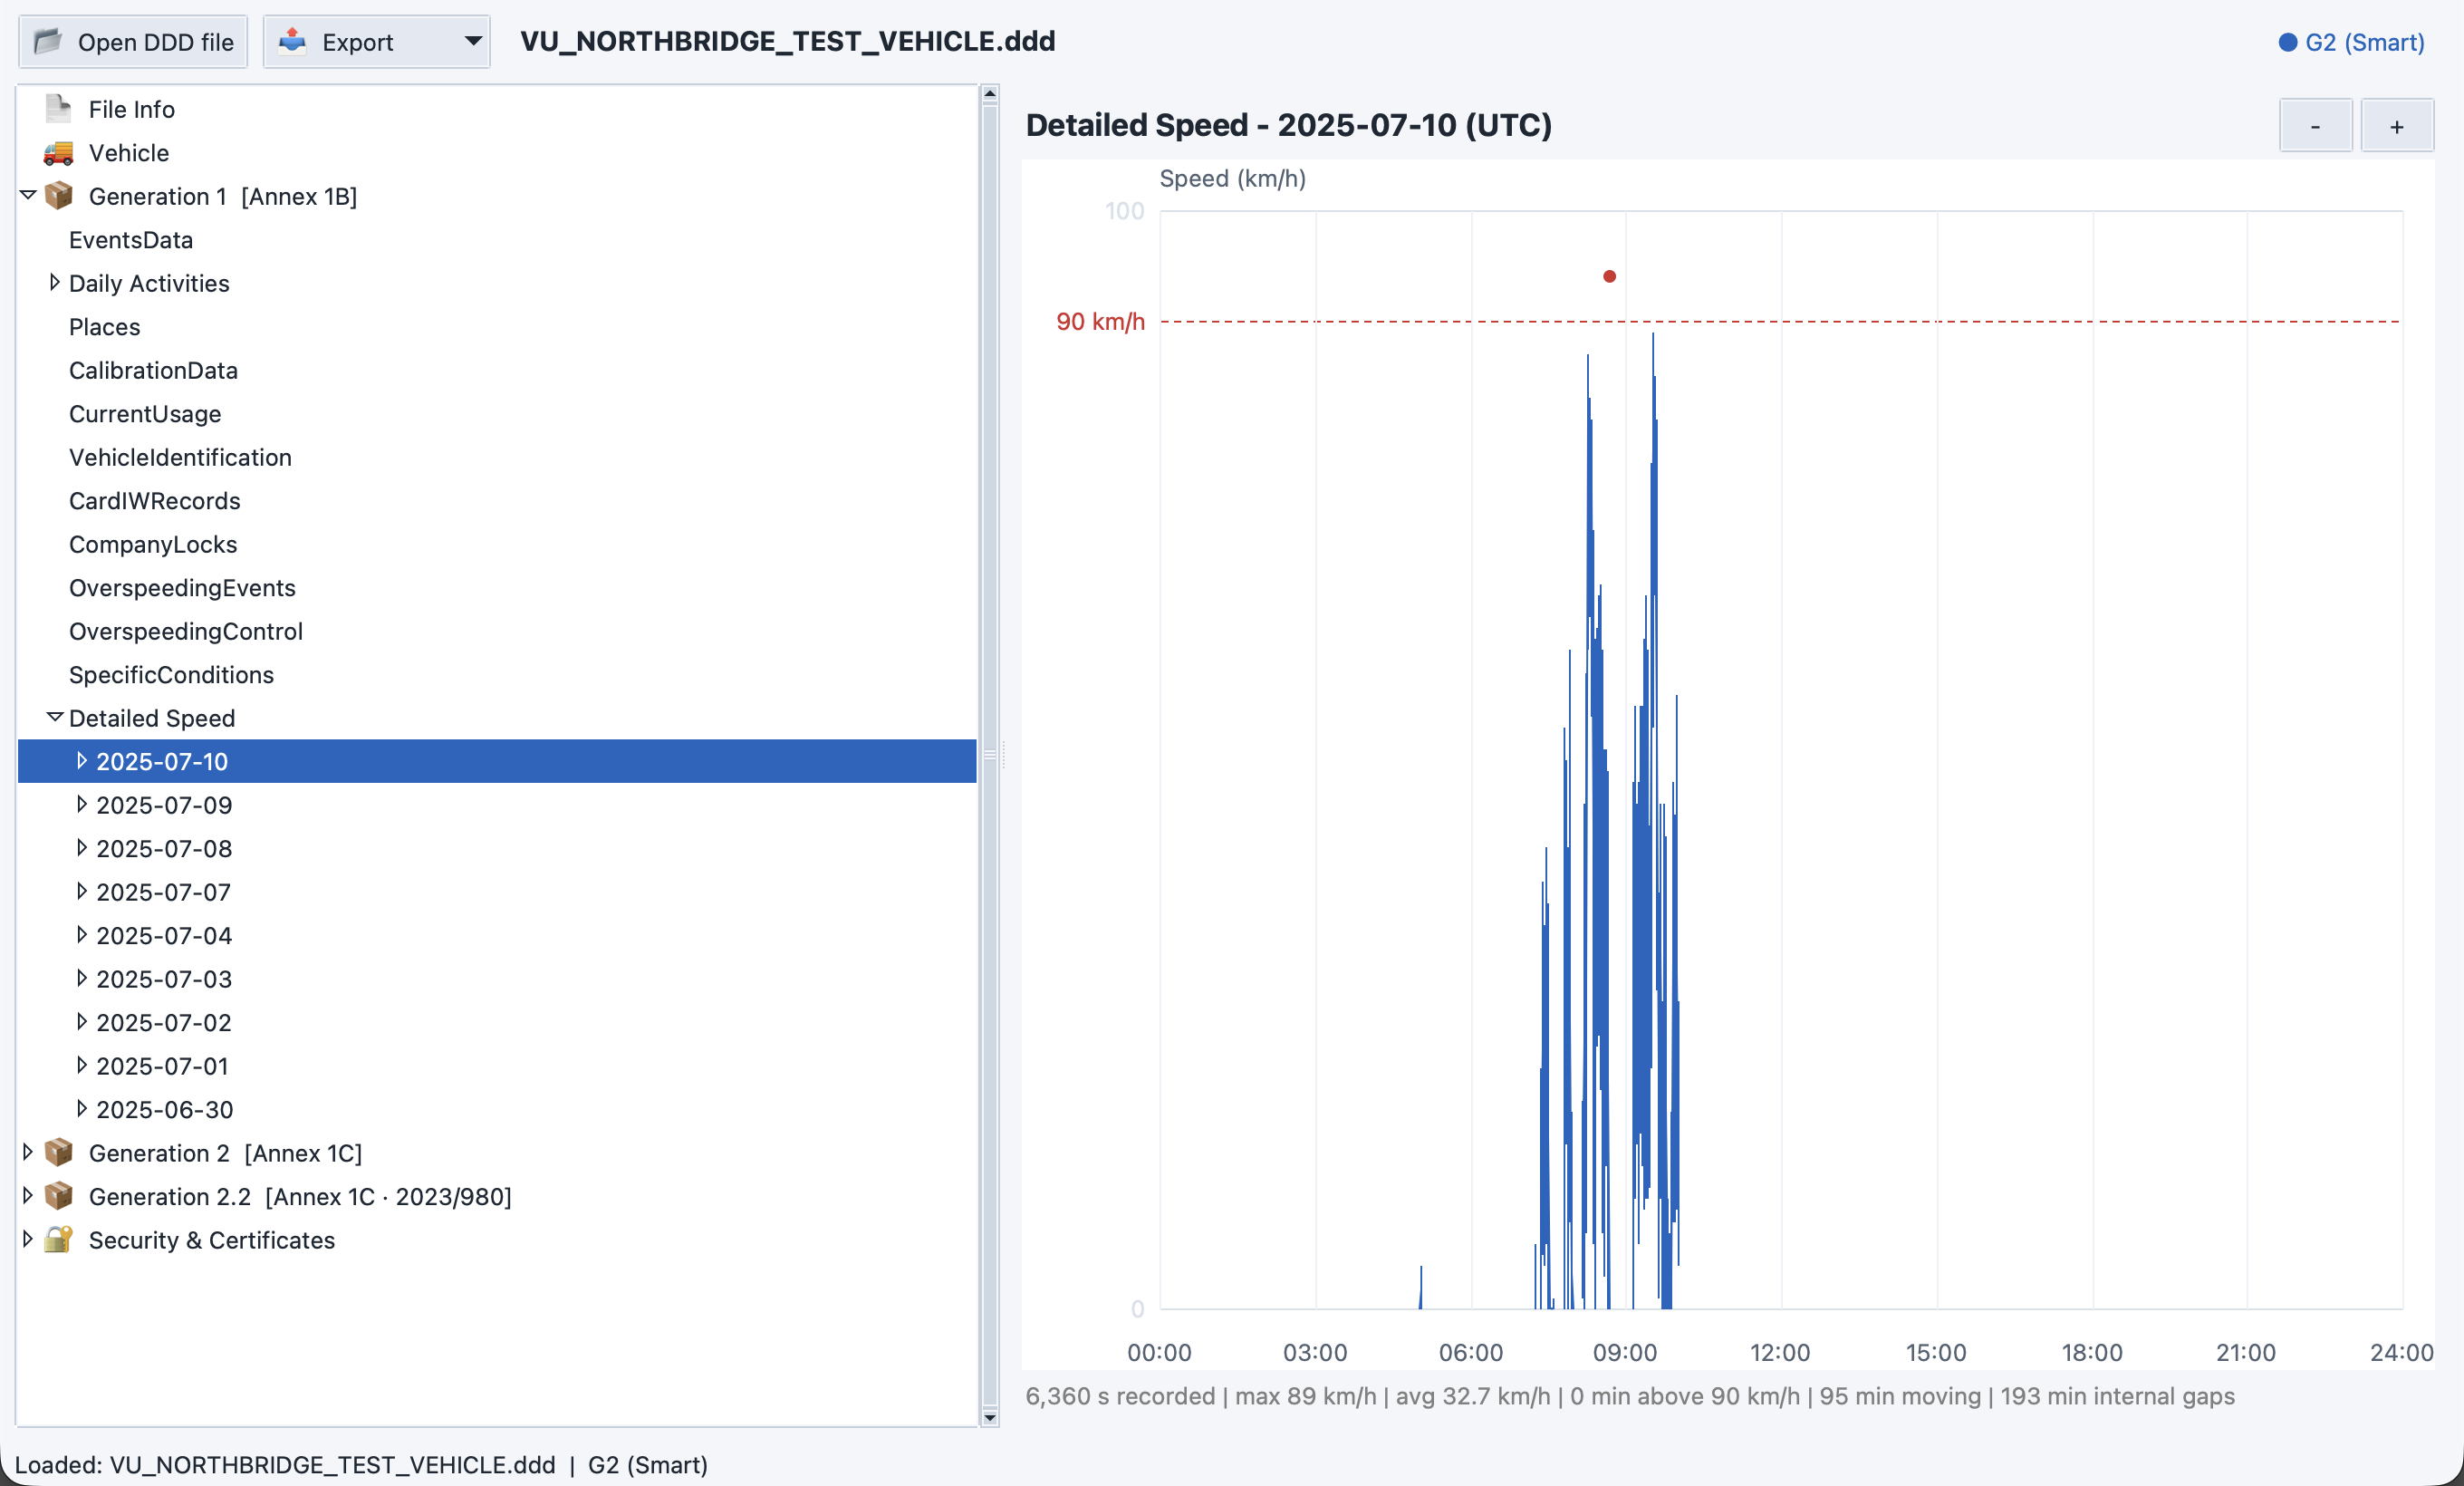
For VU downloads, a TACHOGRAPH DOWNLOAD panel reports completeness against the mandatory TREP sections for that generation (present / missing / suspect, plus a completeness percentage).
If a VU download is genuinely partial or corrupted, a CORRUPTED / PARTIAL FILE page is shown and auto-selected. It lists the completeness, sections present, missing mandatory sections, sections whose data was discarded as implausible, and any data recovered by best-effort salvage.
Note that a driver-card image wrapped inside a stand-alone VU download is not treated as corrupt — the reader detects it from its content and shows it as a normal driver card (File Info marks the origin as Driver Card (from VU download)).
For non-chart sections the right pane shows a sortable grid:
- Sort: click any column header to sort; click again to reverse.
- Filter: type in the 🔎 filter box to show only matching rows.
- Resizable columns: columns auto-fit on first load, then keep the width you set; you can widen a column past the window edge and scroll horizontally.
- Record count: shown next to the section title.
Values are formatted for readability: timestamps as YYYY-MM-DD HH:MM, coordinates with 5 decimals, nations as full country names, and the tachograph "not available" sentinel values shown as an em-dash or empty.
The Export menu saves the currently loaded file's data:
| Format | Description |
|---|---|
| Formatted report with cover summary and section tables | |
| Excel | Multi-sheet workbook (.xlsx), one sheet per data section |
| CSV | All sections in a single CSV, separated by titled blocks |
| JSON | Full structured output with all parsed fields |
Exports run on a background thread with a progress bar. Click a format, choose a save location, and the file is written. For details on each format, see the Export Guide.