A modular graph visualization tool built with Django and D3.js that enables exploration of complex data relationships through interactive graph visualizations.
Graph Explorer uses a plugin-based architecture to support multiple data sources and visualization methods. The application loads graph data from various sources, stores it in Neo4j, and renders interactive visualizations using D3.js.
- Workspace Management: Create and manage multiple workspaces, each with its own graph data and configuration
- Plugin-Based Data Sources: Extensible system for connecting to various data sources (Spotify, RDF, PostgreSQL, etc.)
- Multiple Visualization Modes: Switch between different visualizers and view modes in real-time
- Interactive Graph Exploration: Pan, zoom, drag nodes, and explore relationships with mouse controls
- Advanced Search & Filtering: Search nodes by any field and apply complex filters to focus on specific data
- Real-Time Data Refresh: Reload graph data from sources with a single click
- Built-in CLI: Command-line interface for programmatic graph manipulation and automation
- Responsive UI: Modern web interface with multiple view modes for different exploration needs
The project is organized into several modular components:
api- Core data models and plugin interfaces (pip package)core- Application logic and graph processing (pip package)graph_explorer- Django web application that serves the UIplugins- Extensible data source and visualizer implementations (pip packages)
All components communicate through the api package, which defines the standard interfaces and data models.
Data Sources:
- Spotify - Builds graphs of artists and their related/similar artists
- RDF - Imports graphs from Turtle RDF format
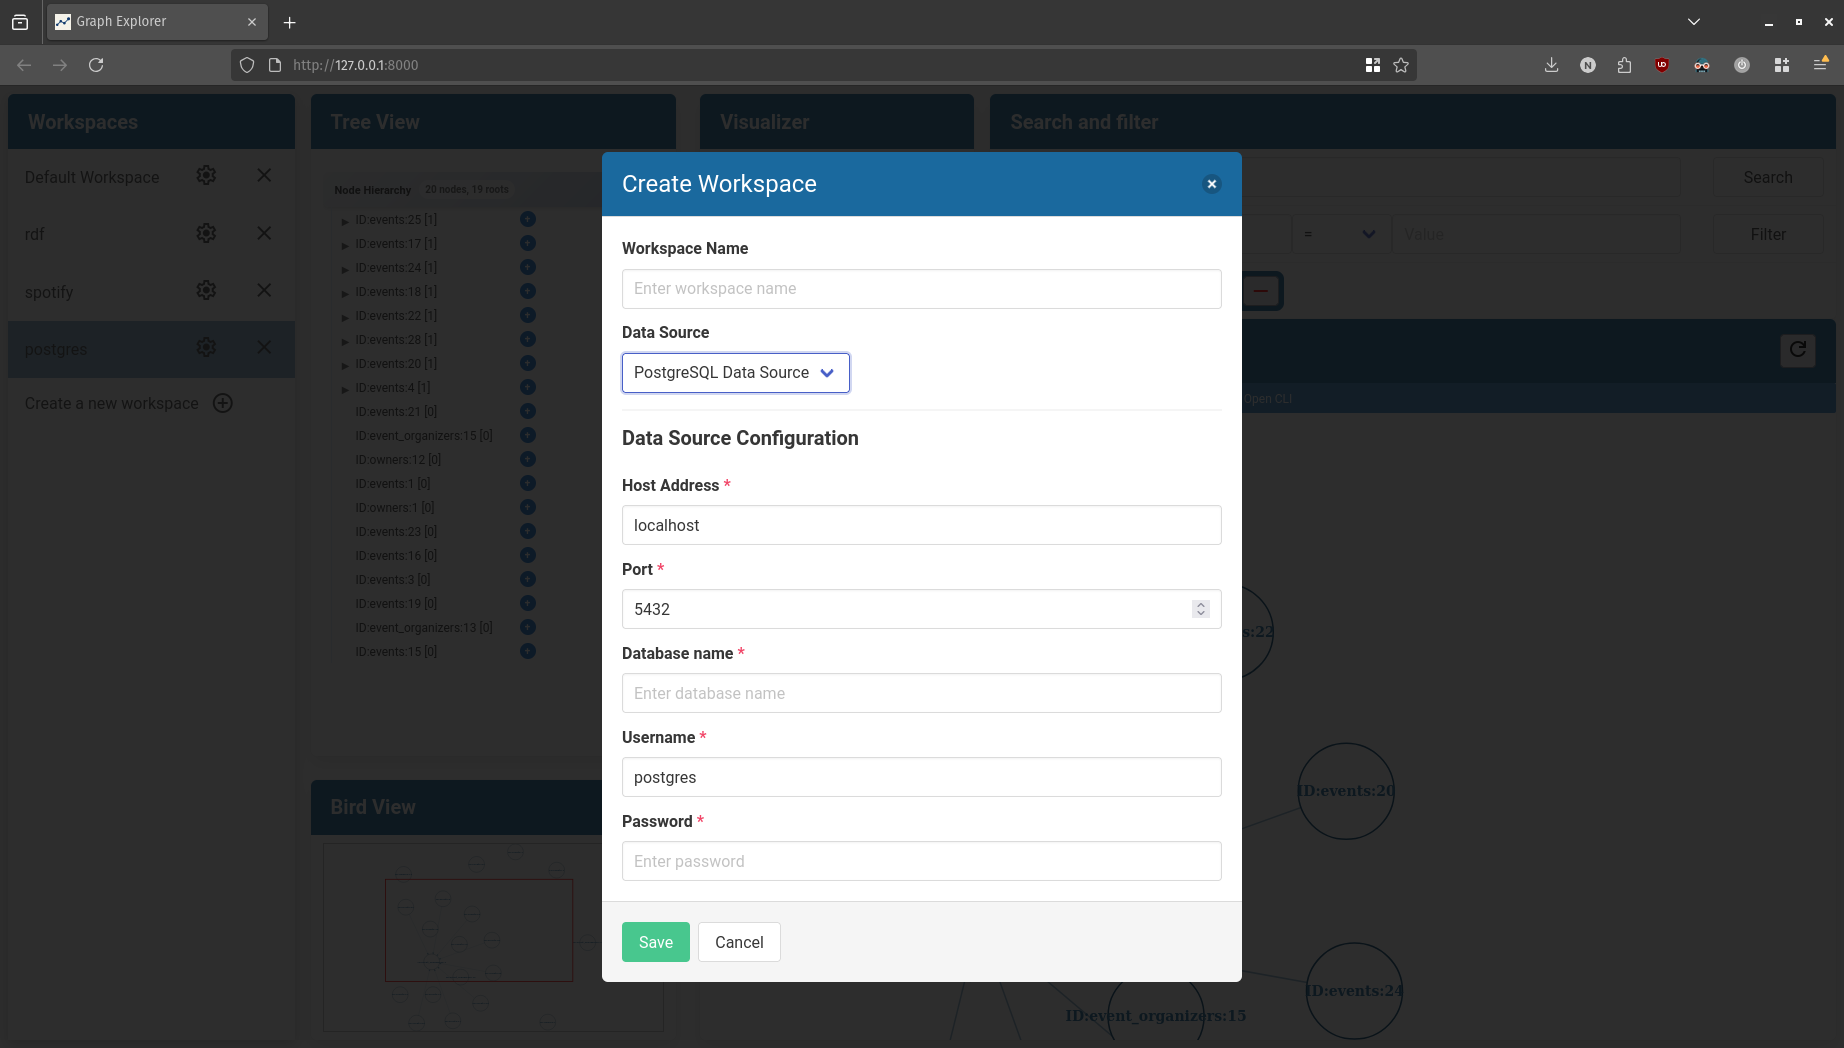
- PostgreSQL - Creates graphs from database schemas with tables as nodes and relationships as edges
Visualizers:
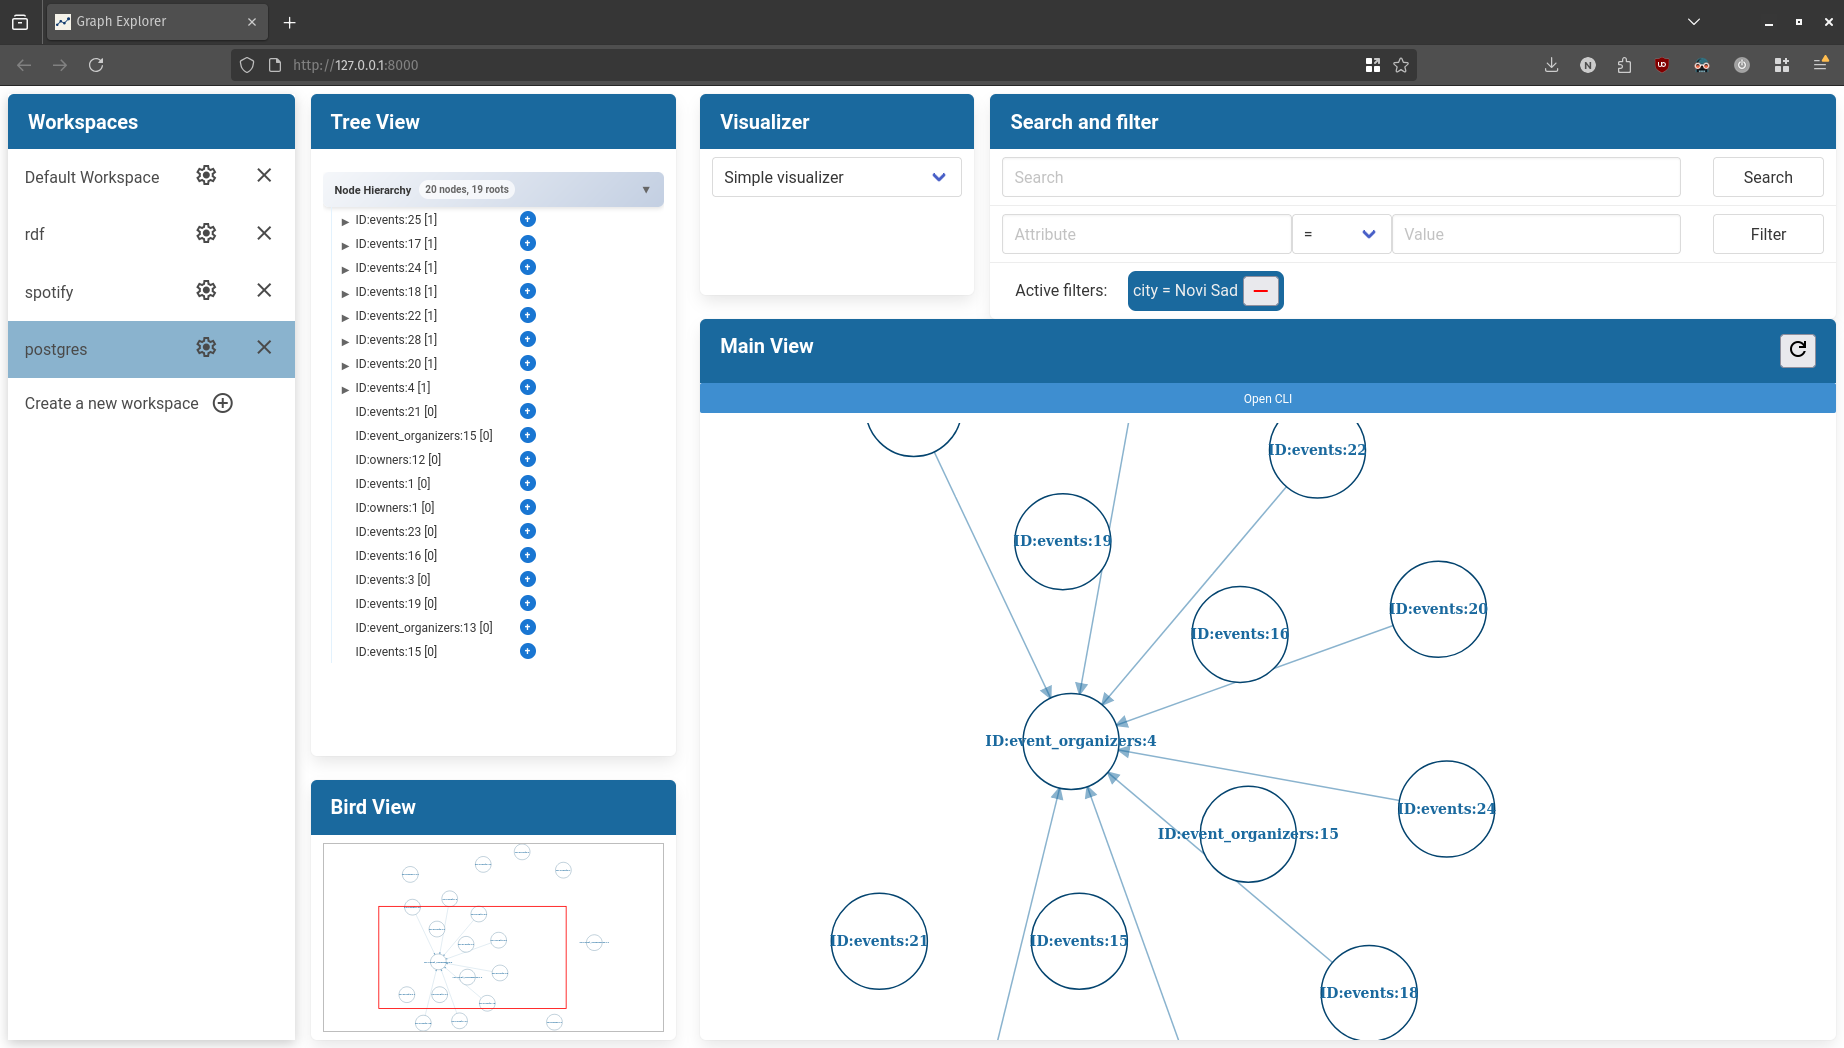
- Simple Visualizer - Basic node-link diagram, displaying minimal node information
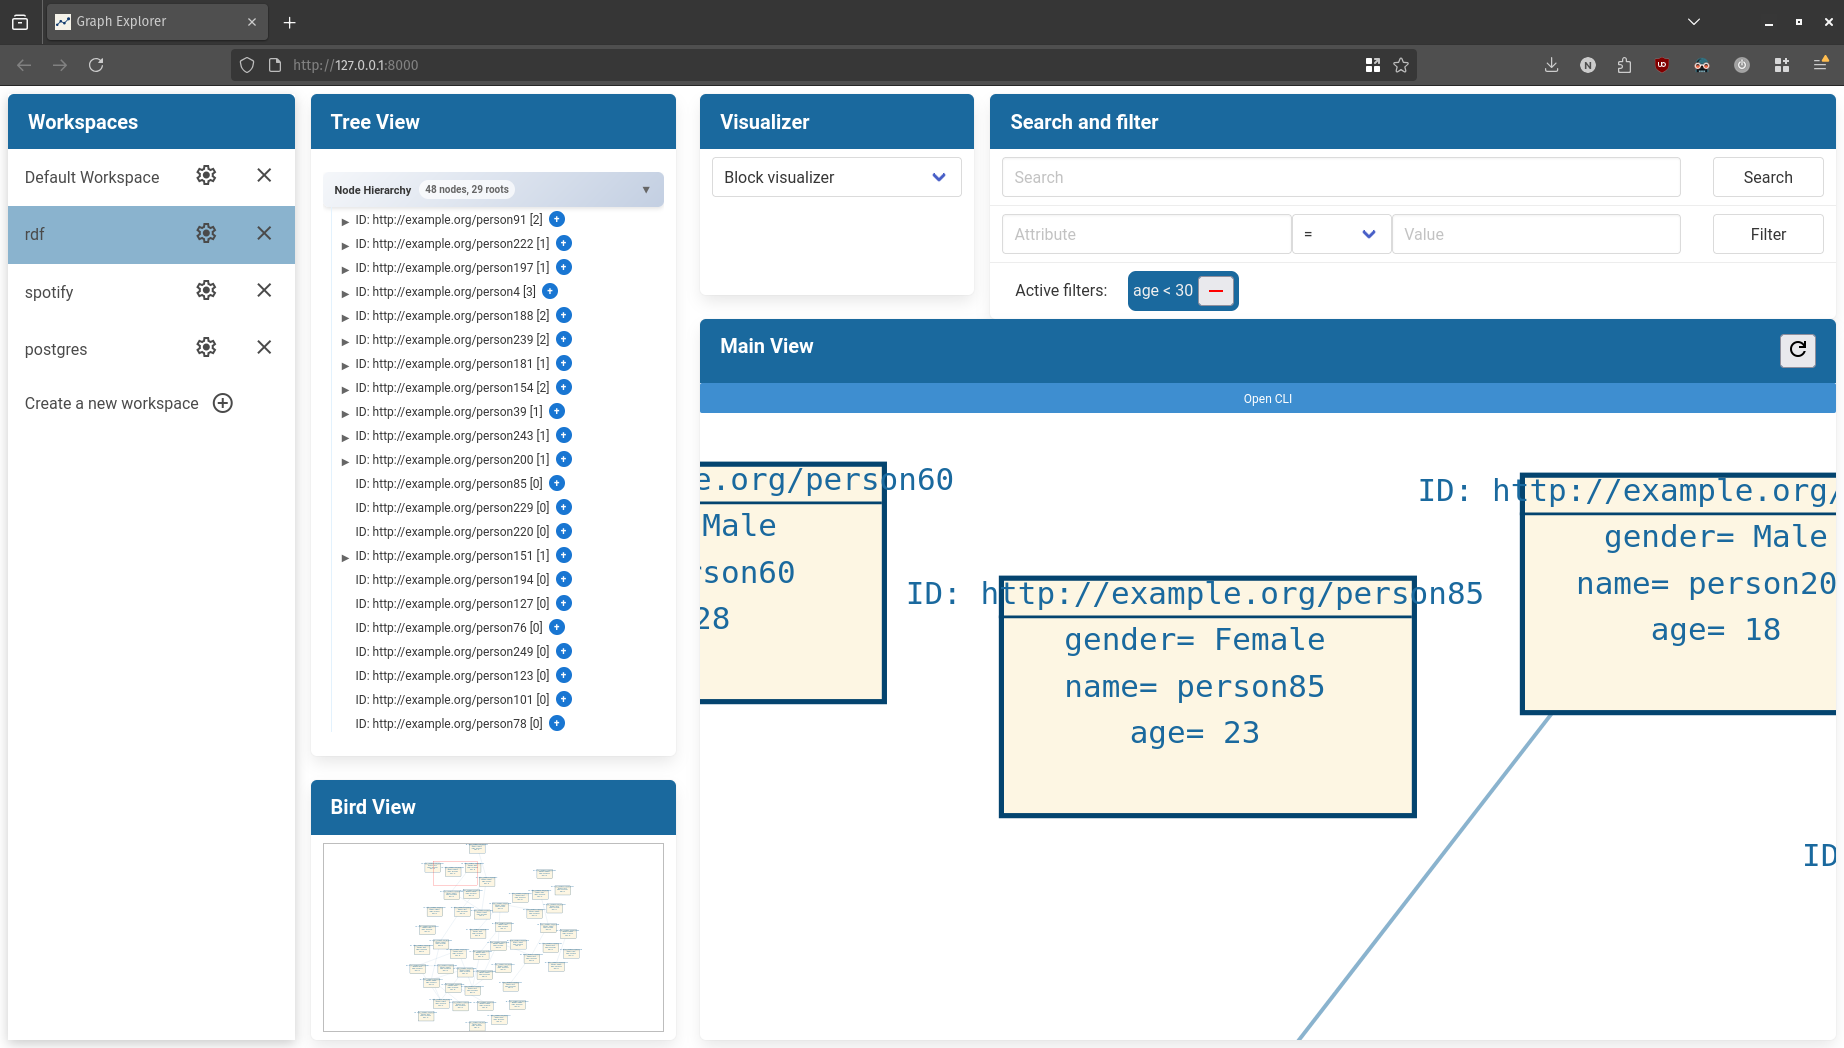
- Block Visualizer - Displays all data for each node, allowing full insight into all the details
- Python 3.10+
- Neo4j database instance
- Docker and Docker Compose (for containerized setup)
The fastest way to get started:
docker compose up -d --buildThis will:
- Start a Neo4j container with default credentials
- Build and run the Django application
- Make the app available at
http://localhost:8000
For local development without Docker:
-
Create virtual environment (recommended):
python -m venv venv
source venv/bin/activate  # Linux/macOS
# or
venv\Scripts\activate     # Windows
-
Start Neo4j: You can use the provided docker-compose or set the connection parameters as environtment variables.
cd neo4j docker compose up -d -
Run the setup script:
# Linux/macOS
./setup.sh

# Windows
setup.bat

# Or specify a custom port
./setup.sh 3000
The setup script will:
- Install all Python dependencies
- Install core packages and plugins
- Set up default environment configuration
- Start the Django development server on localhost:8000
For full development control:
-
Create virtual environment (recommended):
python -m venv venv
source venv/bin/activate  # Linux/macOS
# or
venv\Scripts\activate     # Windows
-
Install dependencies:
pip install -r requirements.txt
-
Install core packages:
pip install -e ./api
pip install -e ./core
-
Install plugins (optional):
# Visualizers
pip install -e ./plugins/visualizer/simple_visualizer
pip install -e ./plugins/visualizer/block_visualizer

# Data sources
pip install -e ./plugins/datasource/rdf_datasource
pip install -e ./plugins/datasource/spotify_datasource
pip install -e ./plugins/datasource/postgresql_datasource
-
Configure environment:
cp ./core/src/core/.example.env ./core/src/core/.env
-
Start Neo4j and run the application:
cd neo4j && docker compose up -d
cd ../graph_explorer
python manage.py runserver
Configure the application by editing /core/src/core/.env:
# Neo4j Configuration
NEO4J_URI=bolt://localhost:7687
NEO4J_USERNAME=neo4j
NEO4J_PASSWORD=passwordDefault credentials: neo4j/password
The included Neo4j configuration enables APOC plugins for advanced graph operations. You can access the Neo4j browser at http://localhost:7474.
- Access the Application: Navigate to
http://localhost:8000 - Default Workspace: The application starts with a default workspace that you can modify or use as-is
- Create New Workspace: Optionally create additional workspaces for different projects or data sets
- Select Data Source: Choose from installed data source plugins (Spotify, RDF, PostgreSQL, etc.)
- Configure Parameters: Set required parameters for your chosen data source:
- Spotify: Artist names or IDs to explore
- RDF: Upload Turtle files or provide RDF endpoints
- PostgreSQL: Database connection details and schema preferences
- Load Data: Click the save button to import graph data from your configured source
- Refresh Data: Use the refresh button to reload the latest data from your source at any time
- Select Visualizer: Choose from available visualizer plugins using the dropdown menu
- Switch Anytime: Visualizers can be changed without reloading data, allowing quick comparison of different rendering styles
The application provides three distinct view modes for exploring your graph:
-
Main View:
- Primary interactive graph visualization
- Full-featured node manipulation and exploration
- Pan, zoom, and drag functionality
- Hover nodes for detailed information
-
Bird's Eye View:
- Miniature overview of the entire graph
- Navigate large graphs efficiently
- Quick jumping to different graph regions
- Visual indicator of current viewport in main view
-
Tree View:
- Hierarchical, expandable representation
- Similar to file explorers (like VS Code)
- Collapse/expand node branches
- Ideal for exploring nested relationships and hierarchies
- Universal Search: Search for nodes by any field or property
- Advanced Filtering: Apply filters based on:
- Field name (any node property)
- Operators:
eq(equal),neq(not equal),gt(greater than),gte(≥),lt(less than),lte(≤) - Custom values for precise data exploration
- Real-time Results: Filters and searches update the visualization immediately
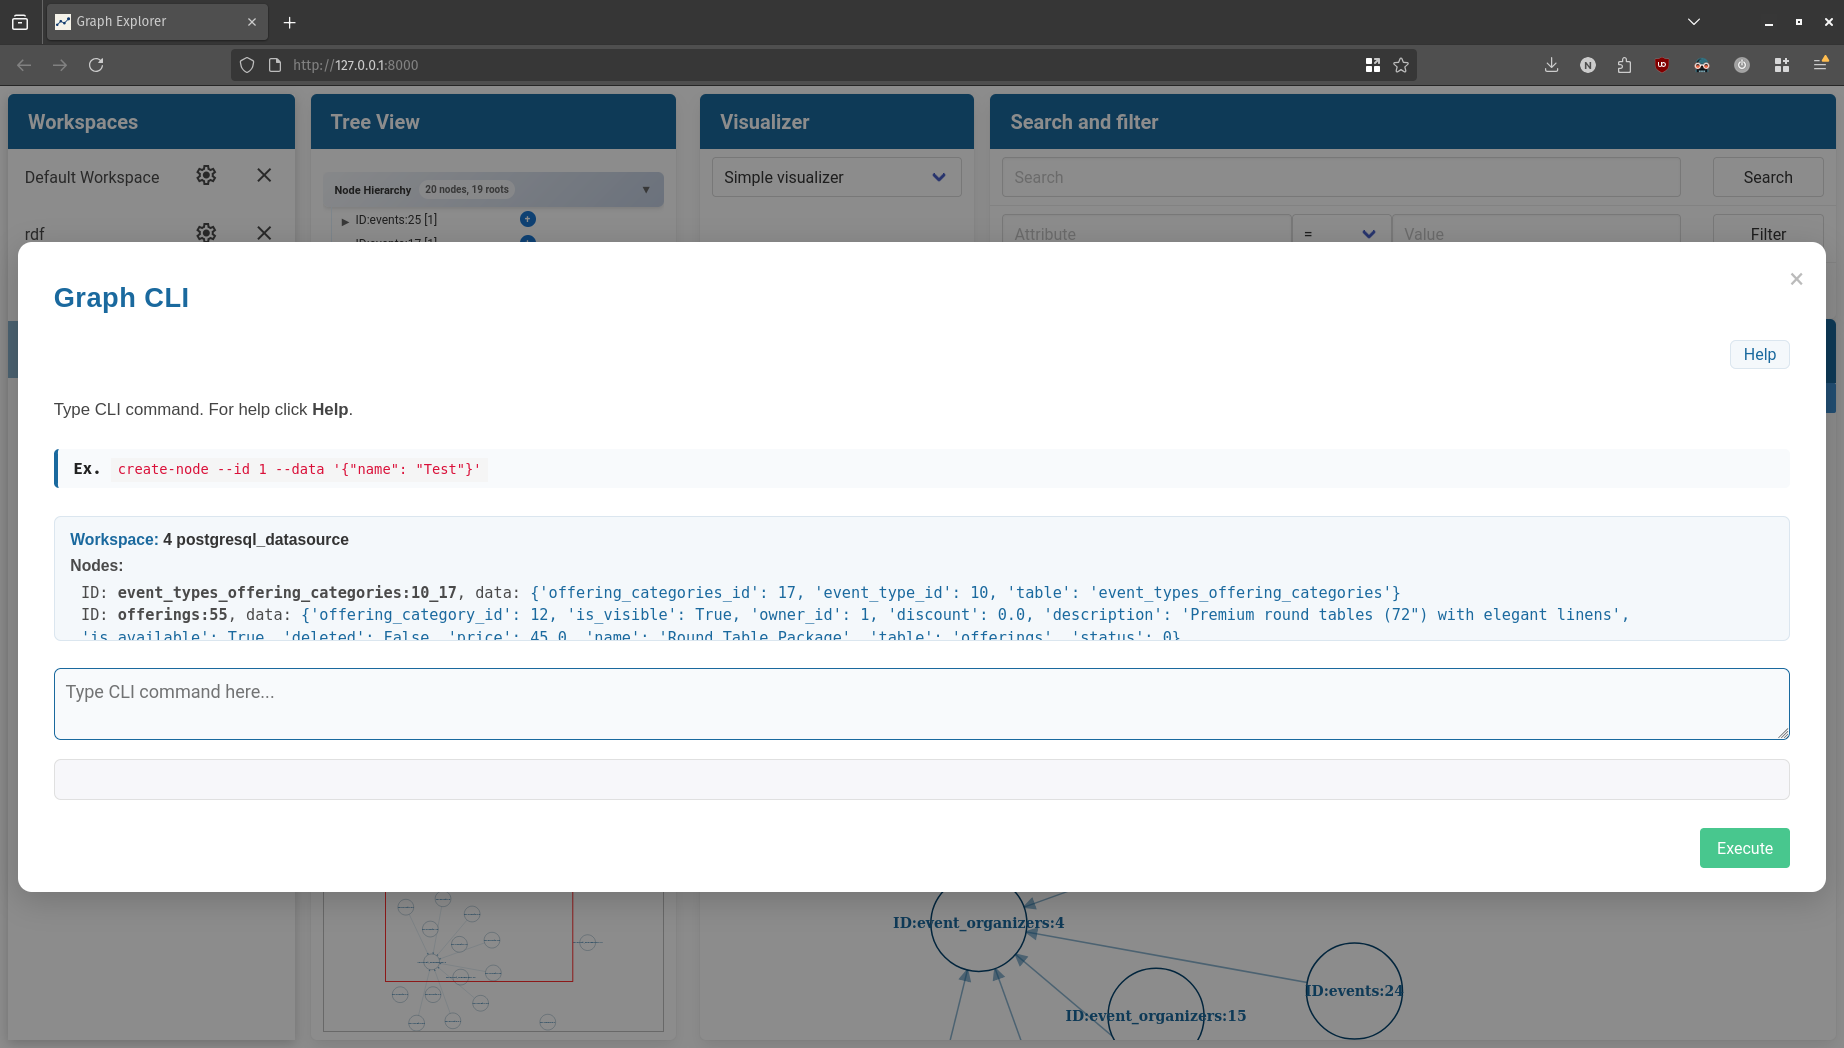
Graph Explorer includes a powerful CLI for programmatic graph manipulation and automation.
- In-App Console: Click the console button in the web interface to open an embedded CLI
- Django Management: Use Django's management command system:
python manage.py graph_cli <command> --workspace <workspace_id> [options]
Node Management:
# Create a new node
create-node --id <node_id> [--data '{json_properties}']
# Example: create-node --id user_123 --data '{"name": "John Doe", "age": 30}'

# Update existing node properties
update-node --id <node_id> [--data '{json_properties}']
# Example: update-node --id user_123 --data '{"age": 31, "city": "New York"}'

# Remove a node and all its connections
delete-node --id <node_id>
# Example: delete-node --id user_123
Edge Management:
# Create relationship between nodes
create-edge --src <source_id> --tgt <target_id> [--data '{json_properties}']
# Example: create-edge --src user_123 --tgt company_456 --data '{"role": "employee", "since": "2020"}'

# Update edge properties
update-edge --src <source_id> --tgt <target_id> [--data '{json_properties}']
# Example: update-edge --src user_123 --tgt company_456 --data '{"role": "manager"}'

# Remove relationship
delete-edge --src <source_id> --tgt <target_id>
# Example: delete-edge --src user_123 --tgt company_456
Data Exploration:
# Search nodes by text content
search --query <search_term>
# Example: search --query "John"  # Finds nodes containing "John" in any field

# Filter nodes by specific criteria
filter --field <property_name> --operator <op> --value <filter_value>
# Examples:
filter --field age --operator gt --value 25        # Age greater than 25
filter --field name --operator eq --value "John"   # Name exactly equals "John"
filter --field city --operator neq --value "NYC"   # City not equal to "NYC"
Graph Management:
# Remove all nodes and edges from current workspace
clear-graphWeb Console Example:
# In the web interface console:
create-node --id city_001 --data '{"name": "Novi Sad", "country": "Serbia", "population": 380000}'
create-node --id city_002 --data '{"name": "Belgrade", "country": "Serbia", "population": 1700000}'
create-edge --src city_001 --tgt city_002 --data '{"relationship": "nearby", "distance_km": 80}'
Django Management Example:
# From command line:
python manage.py graph_cli create-node --workspace 1 --id my_node --data '{"city": "Novi Sad"}'
python manage.py graph_cli filter --workspace 1 --field population --operator gte --value 500000- Node Interaction: Click nodes to view properties, drag to reposition
- Dynamic Updates: All changes (via UI or CLI) reflect immediately in visualizations
- Multi-Workspace: Switch between workspaces without losing data or configuration
- Multi-session access: Workspace configurations and graph data are persisted for later use
Create a new data source by implementing the DataSourcePlugin interface:
from api.components.datasource import DataSourcePlugin, DataSourceConfigParam
from api.models.graph import Graph

class MyDataSourcePlugin(DataSourcePlugin):
    def name(self) -> str:
        return "My Data Source"

    def identifier(self) -> str:
        return "my_datasource"

    def get_configuration_parameters(self) -> List[DataSourceConfigParam]:
        return [
            DataSourceConfigParam(
                name="api_key",
                value_type=DataSourceConfigParam.Type.PASSWORD,
                display_name="API Key",
                required=True
            ),
            DataSourceConfigParam(
                name="endpoint",
                value_type=DataSourceConfigParam.Type.URL,
                display_name="API Endpoint",
                default="https://api.example.com"
            )
        ]

    def load(self, **kwargs) -> Graph:
        # Your data loading logic here
        # Return a Graph object
passCreate custom visualizations by implementing the VisualizerPlugin interface:
from api.components.visualizer import VisualizerPlugin
from api.models.graph import Graph

class MyVisualizerPlugin(VisualizerPlugin):
    def name(self) -> str:
        return "My Visualizer"

    def identifier(self) -> str:
        return "my_visualizer"

    def display(self, graph: Graph, **kwargs) -> str:
        # Generate HTML string with D3.js visualization
        # Follow the integration rules for interactivity:
        # - Use enabled="true", drag="true", tooltip="true", zoom="true", click-focus="true"
        # - Nodes: <g class='node'>
        # - Links: <path class='link'>
return html_string-
Create a pyproject.toml for your plugin:
 [build-system]
 requires = ["setuptools >= 61.0"]
 build-backend = "setuptools.build_meta"

 [project]
 name = "my_data_source"
 version = "0.1"
 dependencies = [
     "api==0.1"
 ]
 requires-python = ">= 3.10"

 [tool.setuptools.packages.find]
 where = ["src"]

 [project.entry-points."graph_explorer.datasources"]
 my_data_source = "my_data_source.implementation:MyDataSourcePlugin"
-
Install your plugin:
pip install -e ./path/to/your/plugin
-
Restart the application to load the new plugin.
graph_explorer/
├── api/                    # Core interfaces and models
├── core/                   # Application logic
├── graph_explorer/         # Django web application
├── plugins/
│   ├── datasource/         # Data source plugins
│   └── visualizer/         # Visualizer plugins
├── neo4j/                  # Neo4j Docker setup
├── requirements.txt        # Python dependencies
├── setup.sh               # Quick setup script
├── setup.bat              # Windows setup script
└── docker-compose.yml     # Full application stack
- Fork the repository
- Create a feature branch
- Implement your changes following the plugin interfaces
- Test with the provided setup methods
- Submit a pull request
Neo4j connection issues:
- Ensure Neo4j is running:
docker ps - Check connection parameters in
.env - Verify Neo4j health:
http://localhost:7474
Plugin not loading:
- Verify plugin installation:
pip list - Check entry points in
pyptoject.toml - Restart the Django application
Port conflicts:
- Neo4j: Change ports in
neo4j/docker-compose.yml - Django: Use
./setup.sh <port>or modifymanage.py runserver
This project is licensed under the MIT License - see the LICENSE file for details.