


Accompanying Paper & Full Docs (soon) ---
HyperTA is a technical analysis optimization framework that autonomously explores the parameter space of one or more indicators — or combinations of their signals — to find configurations that maximize a user-defined objective. Indicators, performance metrics, and threshold trigger rules are all user-definable(but we provide multiple prebuilt). Rather than relying on conventional defaults(like RSI(period=14), HyperTA treats strategy parameterization as a search problem and solves it systematically, returning the optimal configuration alongside full diagnostics. Results can be Backtested against Sensitivity Analysis, Monte Carlo Simulations and other Techniques like Statistical Analwsis that we also provide.
Built for quantitative researchers, algorithmic traders, and strategy developers.
This Library uses UV package manager.
The Framework Provides about 30 prebuilt Techncial Indicators but you are obviously free to implement your own via IndicatorConstructor Class.
Some examples being:
- RSI, StochRSI, ROC, Williams %R, ADX, MACD, MA, EMA, EMA Ribbon, EMA Crossover, Ichimoku Cloud, Bollinger Bands, ATR, Donchian Channels
The framework supports distinct signal Threshold trigger mechanisms. Obviously you can plug in and code your own custom ones via the ThresholdConstructor Class.
Examples being:
2. crossUpLineThreshold: Detects fast vs. slow line crossovers (e.g., MACD signal line, EMA crossovers).
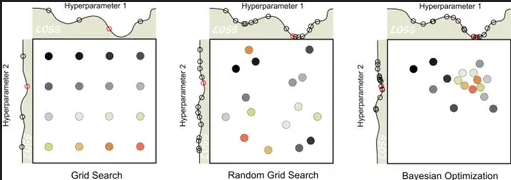
- Grid Search - Exhaustive exploration of all parameter combinations
- Random Search - Randomly selects search spaces (mainly used for bigger samples)
- Bayesian Optimization - Probabilistic guided search for optimal parameters
- More to be added...
This library was built while in mind of the fact that you can use 1 Indicator and Threshold logic OR Multiple Indicators and Threshold types at the same time + Their Combinations.
you basuially just try to find the otpimal hyperparameters for lets say RSI over a given timeseries and timeframe and a single threhsold logic lets say crossUp. Thats an optimization problem. RSI has only 1 hyperparameter called period. so you try to opimize period for this given dataset. Hyper-TA will search via the Algorithm set it posses and obviosuly the one you choose. You define what the Metric you are trying to opimize for (lets say Return) & what the search space is lets say [2-100] and it will see which period value or values give/s the biggest return/s!
Same logic Applies here but you can also define multiple search spaces each containing different Metrics to opimize for, Threhsold types, Indicators to use and what combinatiosn of all of those to be combined with what to find complex Multi dimensional Relationships and connections!
Define parameter ranges to explore all(or most - depending on search algorithm) combinations:
search_config = {
    "type": "crossUpThreshold",
    "indicator": "rsi",
    "period": [7, 14, 21],           # 3 values
    "threshold": [25, 30, 35],        # 3 values
    "indicator_params": {
        "indicator_period": [7, 14, 21]  # 3 values
    }
}
# Total combinations: 3 × 3 × 3 = 27 configurations
Keep in mind combining them is gonna get you exponentially more Combinations so i highly recomend using Random or Bayesian Search on bigger Search configs
The core innovation - composite signal generation via set logic:
- Combines signals using:
UNION(OR logic) - Any indicator triggersINTERSECTION(AND logic) - All indicators must trigger
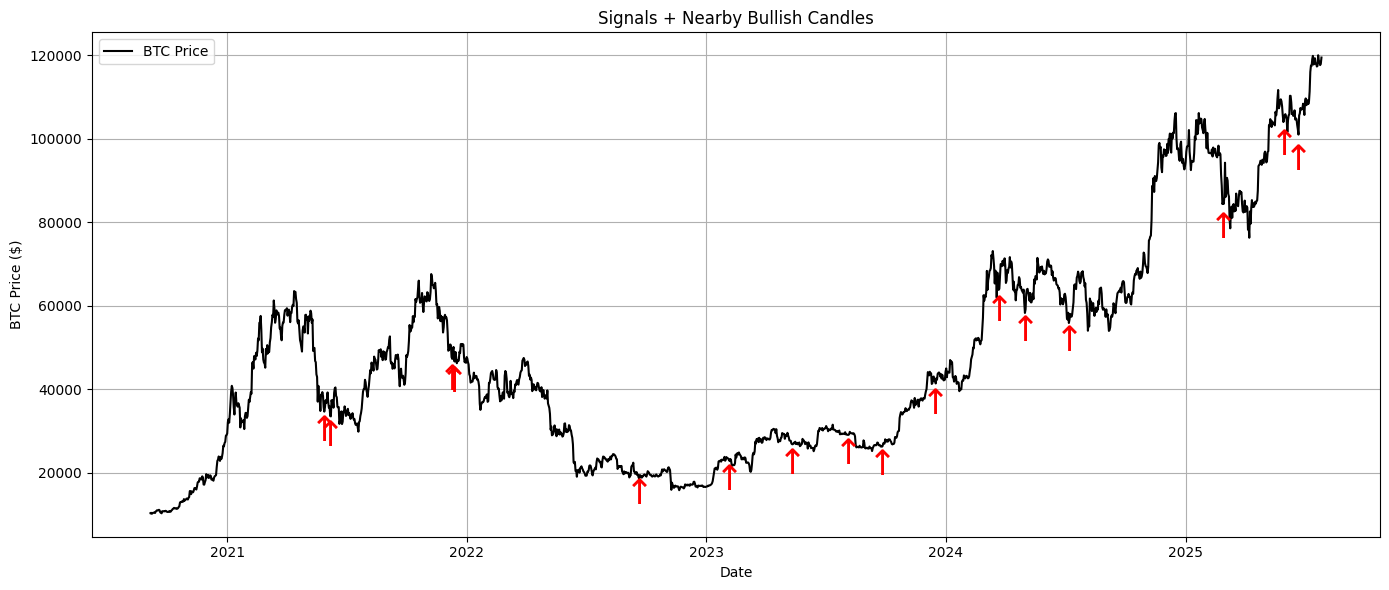
strategy = mixThresholds(price,[searchconfig[0],searchconfig[1]], search="bayesian",mode="and" )This creates extremely powerful composite signals that combine multiple technical perspectives.
src/ta/
├── functions/
│   ├── indicators/          # Technical indicator implementations
│   ├── structures/
│   │   └── market_structure/  # Market structure detection
│   └── strategies/          # Pre-built trading strategies
├── ml/                      # Machine learning modules
├── tests/                   # Unit and integration tests
├──  utils/
├── data/
├── backtesting/
├── strategies/
└── utils/
main.py
app.py
Core Libraries:(Optimization,ML/AI,Backend)
numpy,pandas,matplotlib,plotly,yfinance,finta,scikit-learn,optuna,scipy,tensorflow/pytorch,FastAPI,SQLite,joblib,typer, And many more..
╭─ Commands ───────────────────────────────────────────────────────────────────────────────────────────────────────────╮
│ docs             Open the official Hyper-TA documentation in your browser.                                           │
│ guide            Display a quick-start guide for Threshold and Mixed strategies.                                     │
│ test             Run the project test suite using pytest.                                                            │
│ health           Check the system health and project environment.                                                    │
│ version          Display the current version of Hyper-TA.                                                            │
│ fetch            Fetch the current live price for a specific ticker.                                                 │
│ list-functions   List all functions within the ta package.                                                           │
│ list-thresholds  List all available Threshold and Mixed Threshold strategies.                                        │
│ list-strategies  List all specific Threshold and Mixed Threshold strategy types.                                     │
╰──────────────────────────────────────────────────────────────────────────────────────────────────────────────────────╯- Quantitative Strategy Research - Systematic exploration of indicator combinations
- Signal Generation & Backtesting - Automated signal discovery and validation
- Multi-Indicator Optimization - Find optimal parameter sets across 10+ dimensions
- Trading System Prototyping - Rapid iteration on strategy ideas
- Market Regime Detection - Identify and classify market conditions
- ML Feature Engineering - Generate high-quality input features for predictive models
Install uv (if you dont have it) curl -LsSf https://astral.sh/uv/install.sh | sh
# Clone and setup
git clone https://github.com/MwkosP/Hyper-TA.git
cd Hyper-TA
uv sync

# Run
uv run python main.pyMIT License - see LICENSE for details.
Contributions welcome! Please open an issue or submit a PR.
This software is for research and educational purposes only. It is not financial advice. Trading involves substantial risk of loss. Always do your own research and consult with a qualified financial advisor before making investment decisions.