

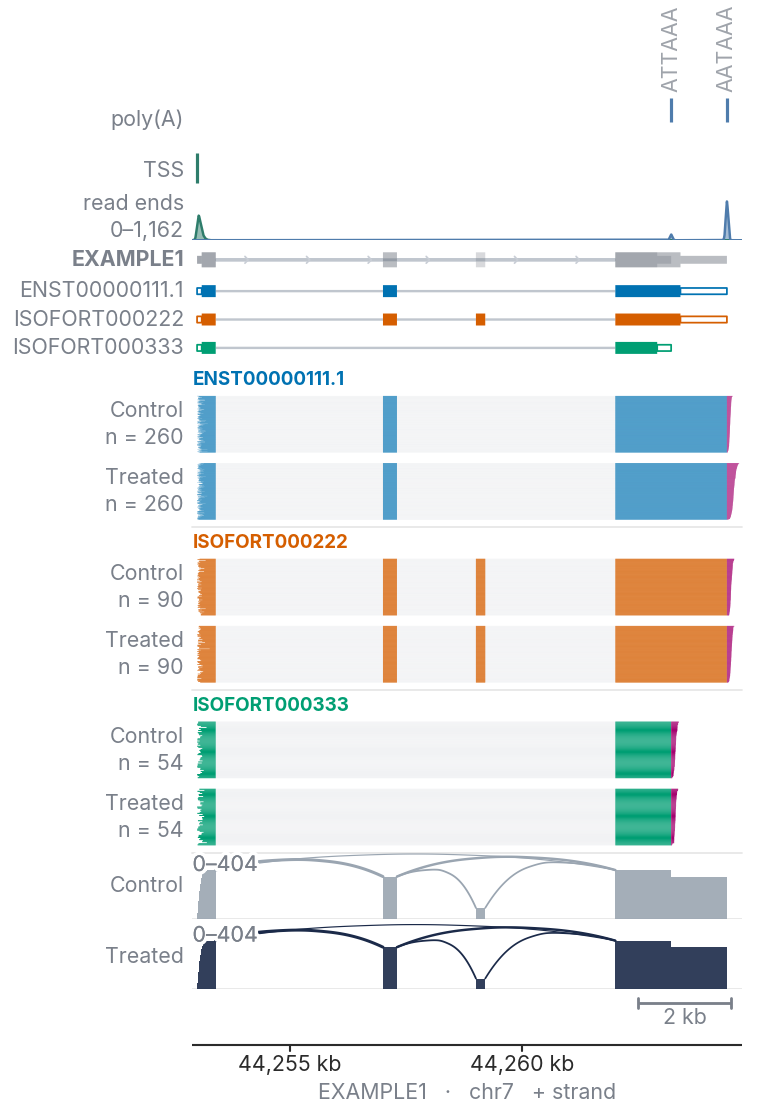
Isoform models, reads with poly(A) tails, RNA modifications, coverage and gene fusions from IsoForge long-read RNA-seq results, one gene per figure.
isotracks plot --gene SAT1 --isoforge results/project --output figures/SAT1from isotracks import plot_gene
plot_gene("SAT1", isoforge="results/project", output="figures/SAT1")results/project is the prefix IsoForge was run with (isoforge annotate --write_bam --o results/project).
Both write figures/SAT1.pdf and figures/SAT1.png at journal column width. BAM files of your own are added
with --bam (BAM files).
Install · Input · The figure · Isoforms and reads · Views · Fusion transcripts · RNA modifications · Tables · Appearance · Command line · Python API · Development · Citation
pip install isotracksPython 3.10 or later; matplotlib, numpy, pandas, pyarrow, pysam and scipy are installed with it. From source:
pip install git+https://github.com/MustafaElshani/IsoTracks.
--isoforge (isoforge=) takes the prefix IsoForge was run with, the run's directory, or any one of its files:
| File | Used for |
|---|---|
<prefix>_isoforge.gtf |
the transcript models and the gene's position |
<prefix>_isoforge_read_annot.parquet (or .tsv) |
each read's isoform and poly(A) tail length |
<prefix>_TSS_TES_Clusters/tss_clusters.bed, tes_clusters.bed |
transcription start sites and poly(A) sites |
<prefix>_isoforge_fusion*.parquet |
fusion calls, their transcripts and their reads |
<prefix>_alignments/*.bam |
the alignments, when IsoForge kept them (--write_bam) |
<prefix>_isoforge_sqanti3.bed |
coding extent of the models, when IsoForge_Sqanti3 was run |
Any of these can be given on its own instead (--annotation-gtf, --read-annot, --tss, --polya,
--fusion-table, --bam, --bed); an explicit file takes precedence over the run. Only whole reads of the
transcripts IsoForge reports are drawn (cluster_supported in the read table); --read-filter all draws every read.
The sorted, indexed BAMs IsoForge was given or kept. Replicates within a condition are pooled into one read stack.
From the run, the sample name up to its first underscore is the condition (Control_1, Control_2 → Control),
as IsoForge groups them. --bam (bam_files=) names the conditions explicitly:
isotracks plot --gene SAT1 --isoforge results/project \
    --bam "Control:Control_1.bam,Control_2.bam;Treated:Treated_1.bam,Treated_2.bam" \
--output figures/SAT1plot_gene("SAT1", isoforge="results/project", output="figures/SAT1",
bam_files={"Control": ["Control_1.bam", "Control_2.bam"],
"Treated": ["Treated_1.bam", "Treated_2.bam"]})Poly(A) tail lengths are read from the pt tag of the reads, or from the read annotation when the BAM has none.
| Option | Adds |
|---|---|
--bed (bed_file=) |
BED12 models with coding extent: CDS is drawn tall and solid, UTRs shorter and hollow. Without it models are drawn from the GTF exons. |
--reference-gtf (reference_gtf=) |
A reference annotation: places genes that are not in the run's GTF, and draws the whole genes of a fusion. |
--modkit, --dmr |
RNA modification tracks. |
| Track | Shows |
|---|---|
| poly(A) | poly(A) sites at the 3′ ends of the drawn isoforms, with their signal hexamer |
| TSS | transcription start sites at their 5′ ends |
| read ends | density of read 5′ and 3′ ends, in reads per 100 bp |
| gene | the drawn isoforms overlaid in grey, with the gene name and direction of transcription |
| isoform models | one row per isoform |
| read stacks | the reads of each isoform, one stack per condition, with poly(A) tails |
| modifications | modified fraction per site, one row per condition |
| differential modification | change in modified fraction between two sample sets |
| coverage | read depth per condition with splice-junction arcs, on one depth axis |
| scale bar and axis | genomic coordinates, chromosome and strand |
- Every figure reads 5′ to 3′ from left to right. A minus-strand gene is drawn with the axis reversed.
- Every read stack has the same height. Its read count is in the gutter (
n = 373). - Coverage is built from the reads of the drawn isoforms. An arc's thickness is the number of reads across it.
- An exon too narrow to see at the figure's scale is drawn a hairline wide, so none is lost in a long gene.
| Option | Default | Meaning |
|---|---|---|
--min-reads |
5 | least reads per isoform, summed over conditions |
--min-reads-per-condition |
off | least reads per isoform in every condition |
--max-isoforms |
12 | most isoforms drawn, best supported first; 0 for no limit |
--max-reads |
20,000 | most reads drawn per stack; 0 draws all. A thinned stack shows n = 20,000/84,512. |
--coverage-reads |
drawn |
gene builds coverage from every read of the gene |
--sort-style |
waterfall |
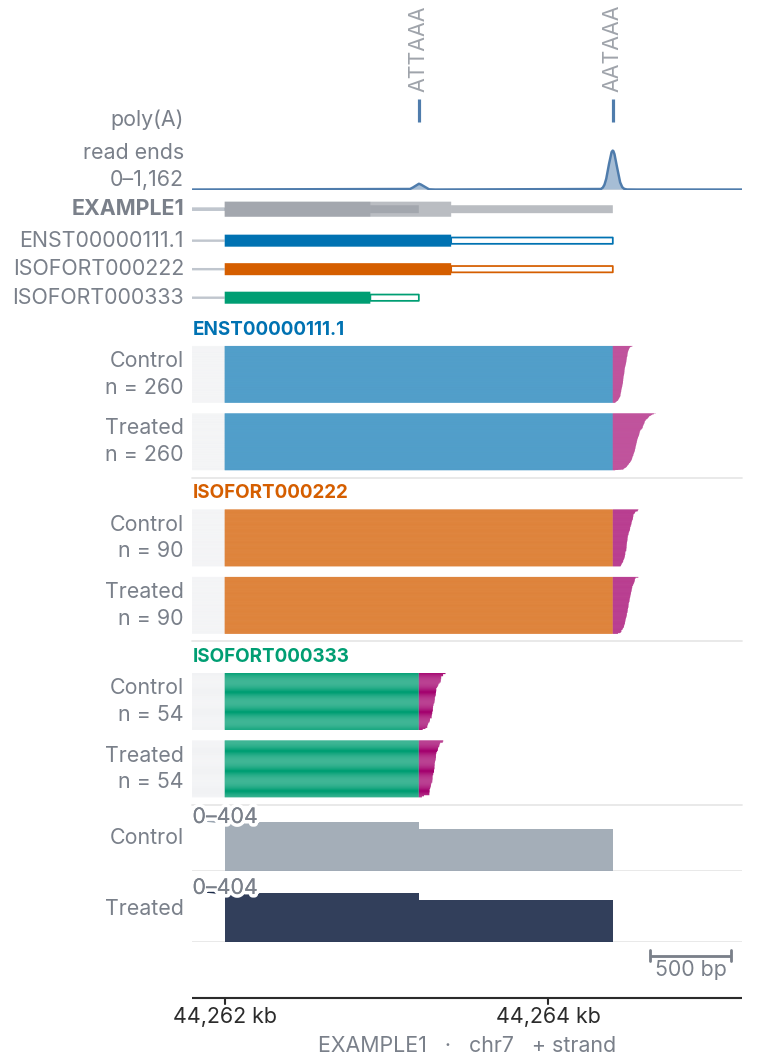
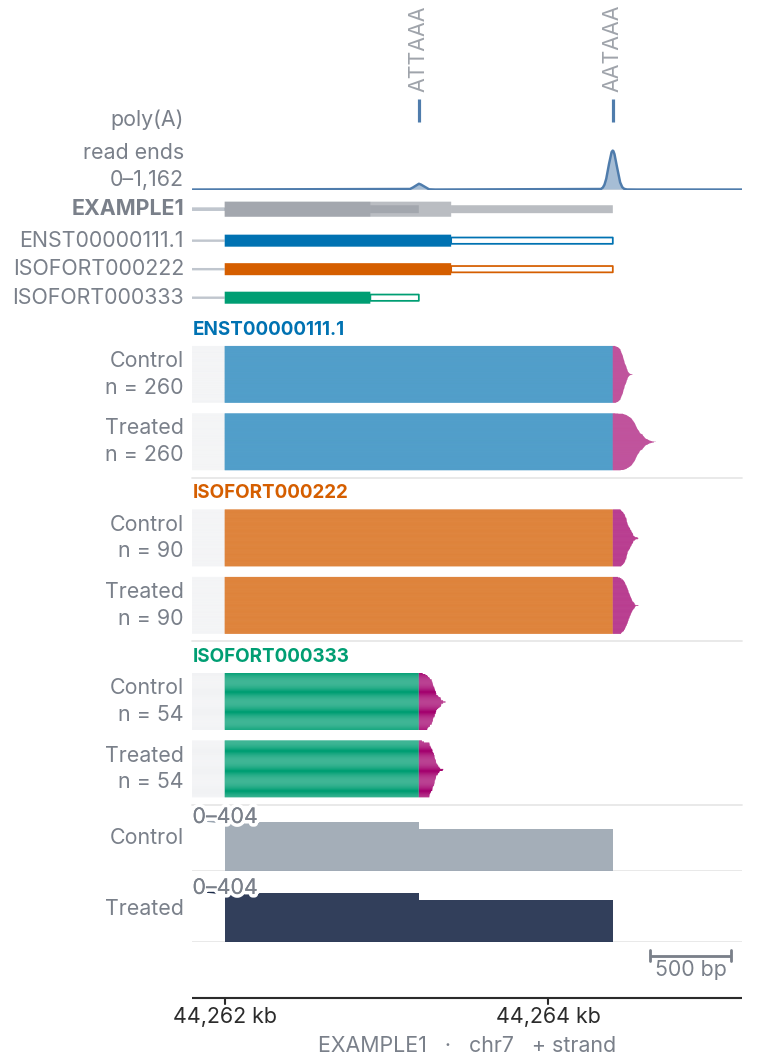
order of reads within a stack |
waterfall: longest tail at the top |
diamond: longest tail in the middle |
|---|---|
 |
 |
| default | --detail last_exon |
|---|---|
 |
 |
--introns scaled |
--introns fixed |
 |
 |
--highlight junction_2 3_utr |
--antisense whole |
 |
 |
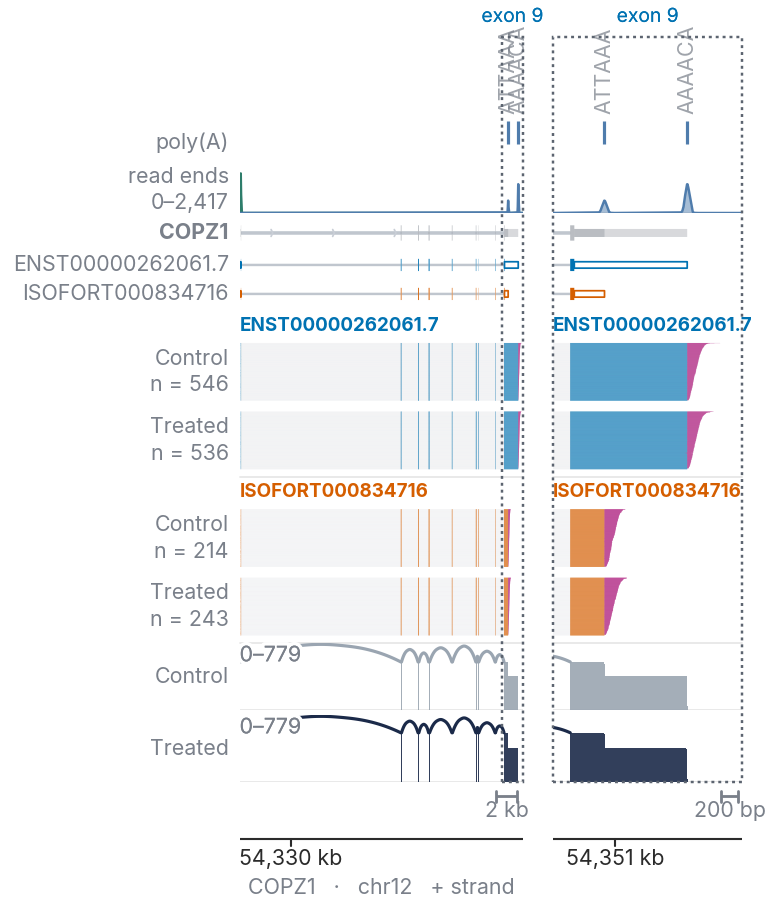
--zoom last_exon (view.plot(region=view.zoom("last_exon", padding=400))) draws part of the gene: first_exon,
last_exon, exon_<N>, 5_prime, 3_prime or whole_gene. Exons are numbered 5′ to 3′. A window reaching the
3′ end is widened to fit the longest poly(A) tail.
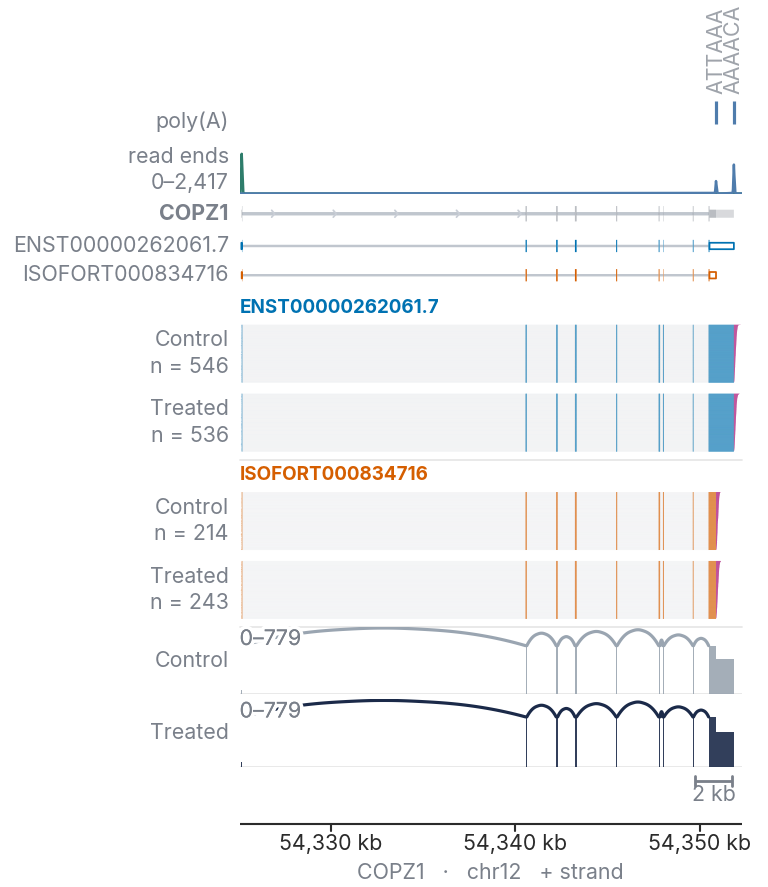
--detail (detail=) draws a region again beside the whole figure, row for row, at true scale: last_exon,
exon_<N>, 3_utr, junction_<N>, 3_prime, 5_prime or a range. --detail-share sets the fraction of the
width it takes (default 0.4). Depth and read-end density share one scale across both panels.
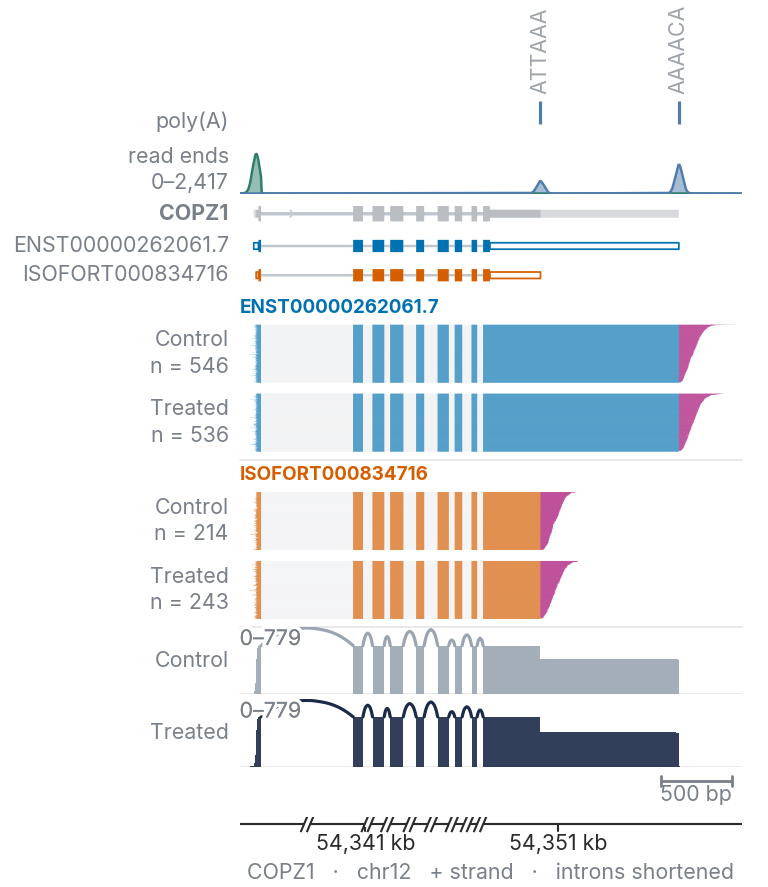
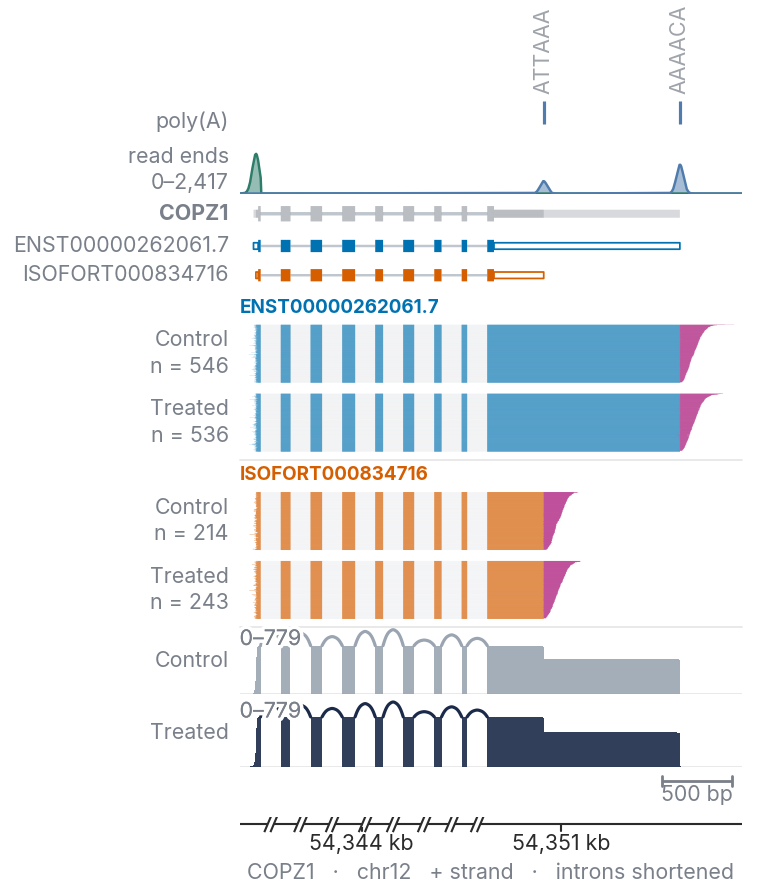
--introns scaled shrinks every intron by one factor, so that together they take --intron-share of the width
(default 0.3). --introns fixed draws every intron at the same small width. Exons, flanks and poly(A) tails stay
at true scale, and each shortened intron is marked with // on the axis.
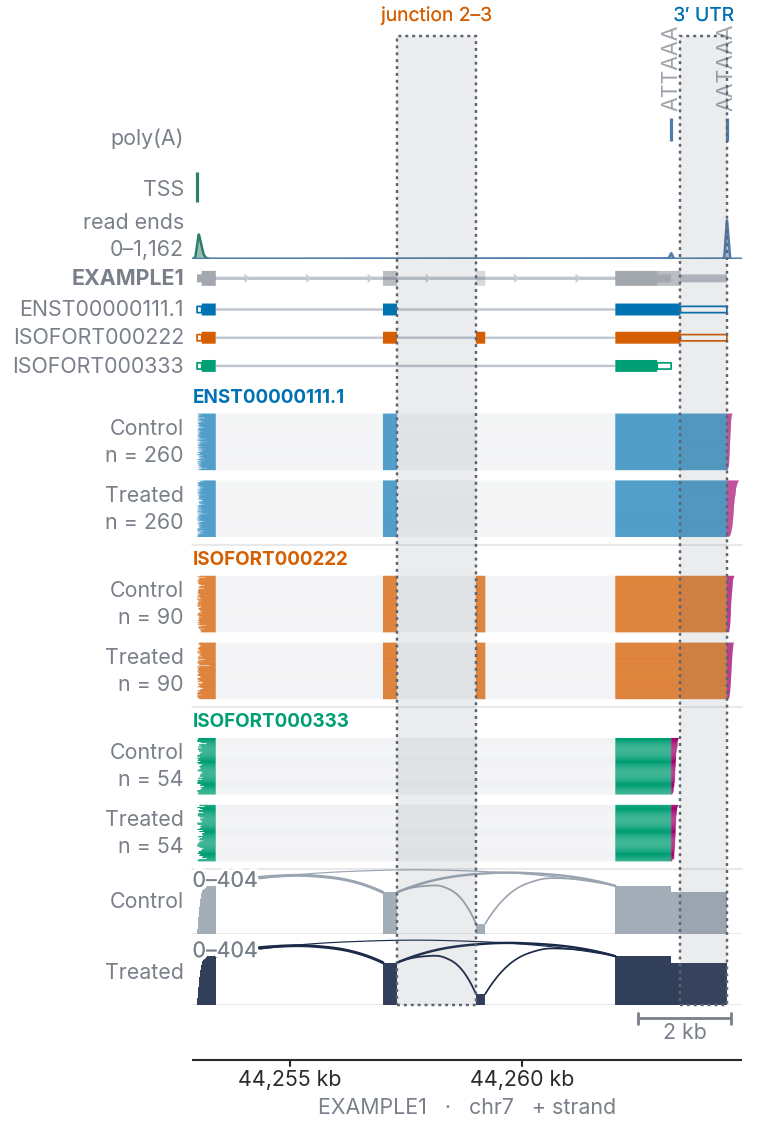
--highlight (highlight=) marks regions with a band through every track:
view.plot(highlight=["junction_2", "3_utr:ENST00000111.1"])
view.plot(highlight=(31_950_000, 31_951_000), highlight_style="outline")| Name | Marks |
|---|---|
exon_<N>, first_exon, last_exon |
one exon, numbered 5′ to 3′ |
intron_<N>, junction_<N> |
the intron between exon N and exon N+1 |
5_utr, 3_utr, cds |
from the coding extent in --bed |
chr22:31,950,000-31,951,000, (start, end) |
that range |
A named region is measured on the isoform with the most exons, or on the one given after a colon
(exon_2:ENST00000111.1). --highlight-style is both (a faint box with a dotted edge), box or outline.
--antisense (antisense=True) also draws the genes transcribed from the opposite strand in the window. Each gets
a section below the gene's tracks: its gene row, marked with its strand, its isoforms, their reads per condition and
its coverage, on a depth scale of its own. Its reads run 3′ to 5′ across the figure, so their poly(A) tails point
left. --antisense whole (antisense="whole") widens the window to draw those genes whole.
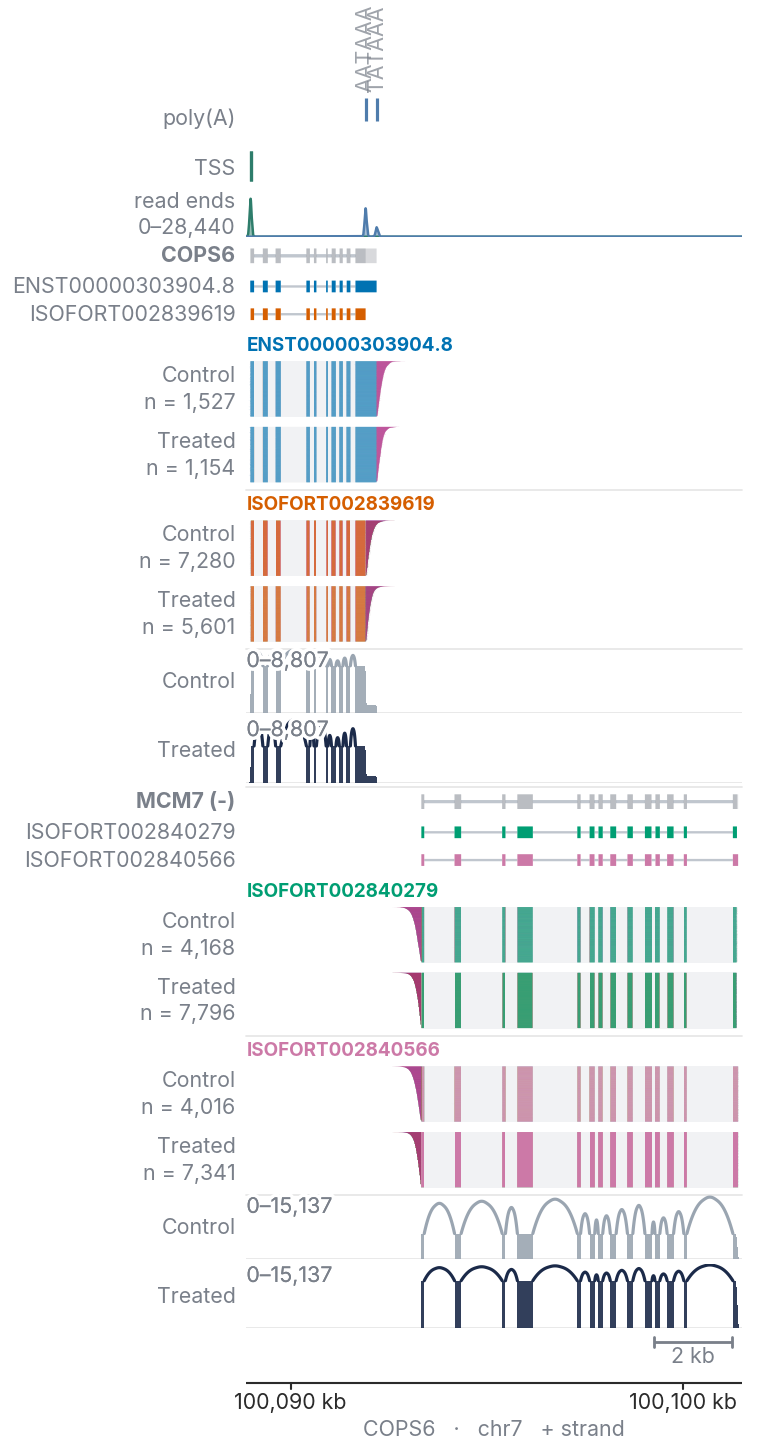
isotracks plot --gene COPS6 --isoforge results/project --antisense whole --output figures/COPS6Opposite-strand genes are found in the run's GTF, and their isoforms are selected by the same read thresholds as the gene's.
--fusion draws a fusion called by IsoForge, by its genes or its call ID:
isotracks plot --fusion RIMS2::ATP6V1C1 --isoforge results/project \
    --reference-gtf gencode.gtf --output figures/RIMS2_ATP6V1C1
from isotracks import FusionView
view = FusionView("RIMS2::ATP6V1C1", isoforge="results/project", reference_gtf="gencode.gtf")
view.plot(output="figures/RIMS2_ATP6V1C1")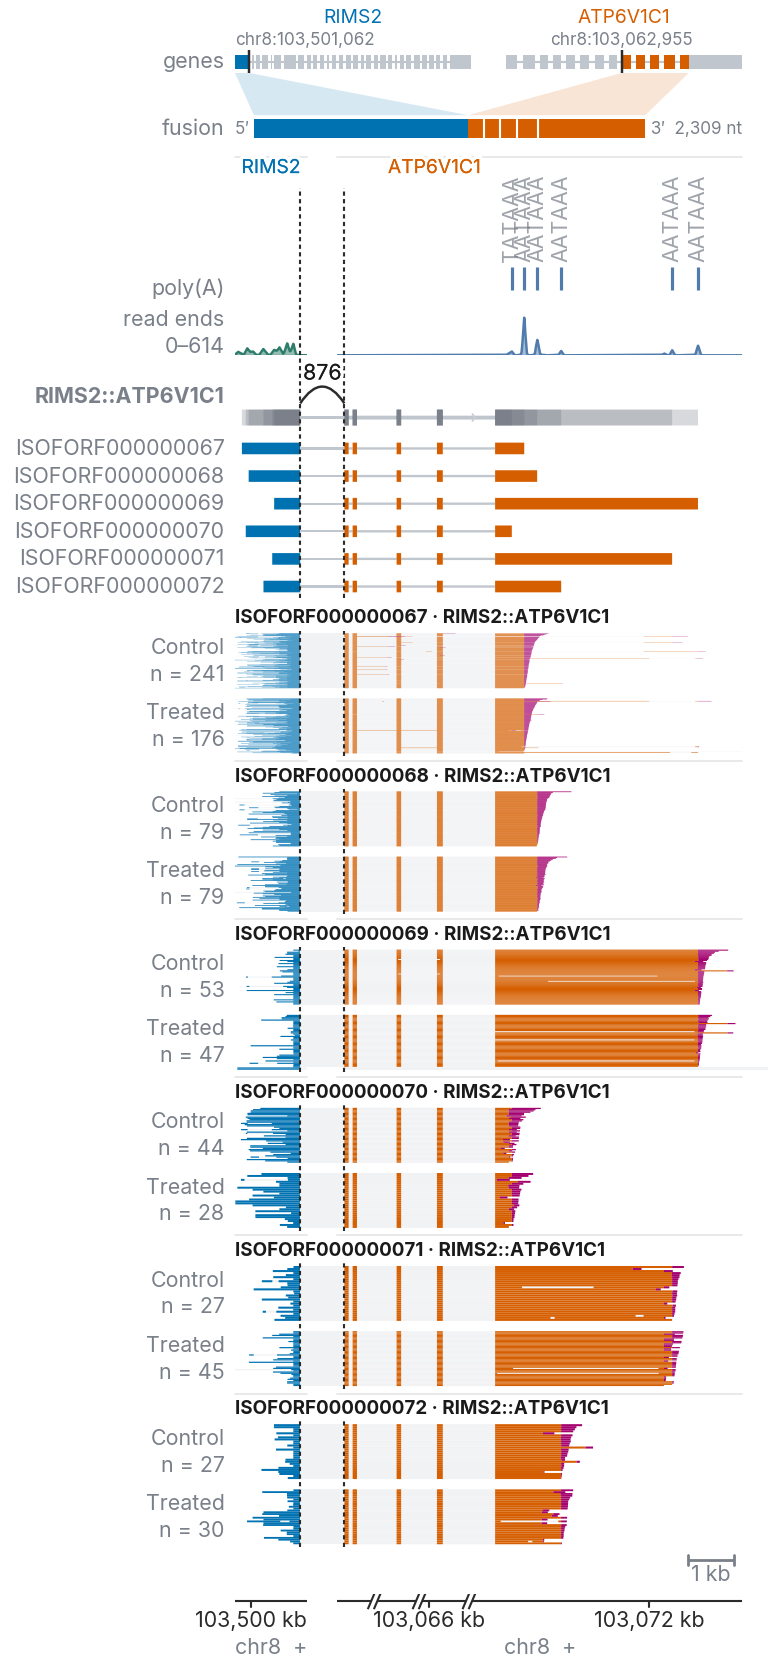
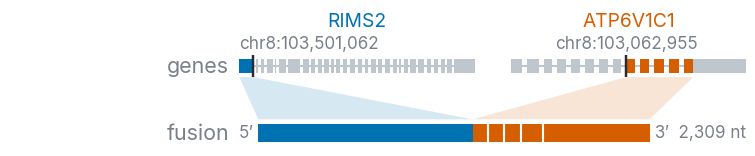
The schematic at the top (--no-fusion-schematic leaves it out) draws each partner gene whole, 5′ to 3′, as
its MANE Select isoform, with introns as equal short gaps (not to scale). The fusion's exons are coloured, the rest
of the gene is grey, and each breakpoint is marked with its coordinate. Below it, the fused transcript is drawn
exons only, to scale in nucleotides, with its length.
The panels follow the gene figure, one panel per partner in transcript order:
| Row | Shows |
|---|---|
| poly(A), TSS | sites at the ends of the fusion transcripts (--polya, --tss, or from --isoforge) |
| read ends | density of the fusion reads' 5′ and 3′ ends, on one scale across the panels |
| fusion gene | the fusion's transcripts overlaid in grey, with an arc and read count over each junction |
| transcripts | one row per fusion transcript, labelled with its IsoForge ID (ISOFORF000000067) |
| read stacks | the reads of each transcript, per condition |
- A dashed line marks each breakpoint through every row.
- Transcripts and reads are joined across the gap between panels: by an intron line where the junction is on splice sites at both ends, and by a dotted line where it is not.
- Introns are shortened within each panel (
--introns scaledis the default for a fusion). - For a fusion of three or more genes, transcripts through every partner are drawn first, then those joining only
some.
--fusion-reads completedraws only the former.
Input. The fusion tables hold every read, so BAMs are optional: they add the poly(A) tails. Samples are grouped
into conditions as for a gene; --conditions "Control:rep1,rep2;Treated:rep3" names the groups without BAMs.
Without IsoForge's tables, a fusion is drawn from a line of breakpoints, its reads found in the BAMs. A junction is
donor>acceptor, the last base kept upstream and the first kept downstream:
FusionView("RIMS2::ATP6V1C1  chr8::chr8  chr8:103501062>chr8:103062955",
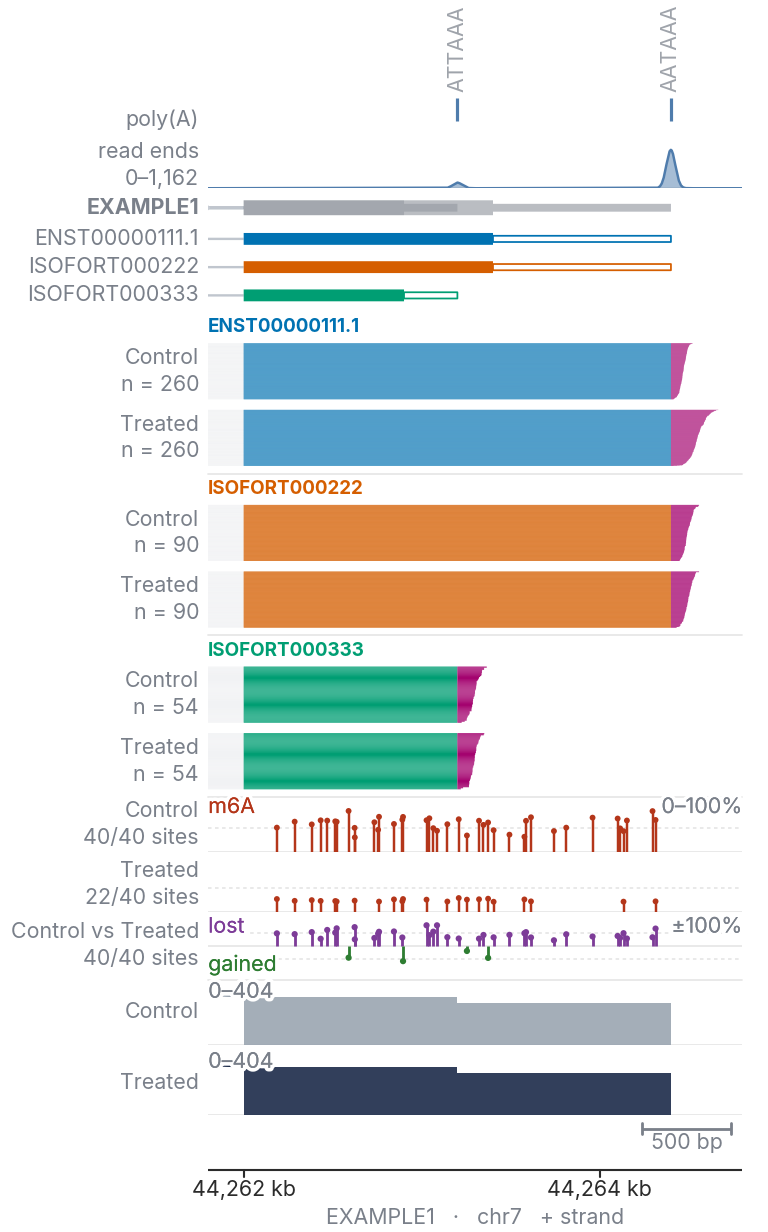
bam_files=bam_files, reference_gtf="gencode.gtf")--modkit: modified fraction per site |
--dmr: change between sample sets |
|---|---|
 |
 |
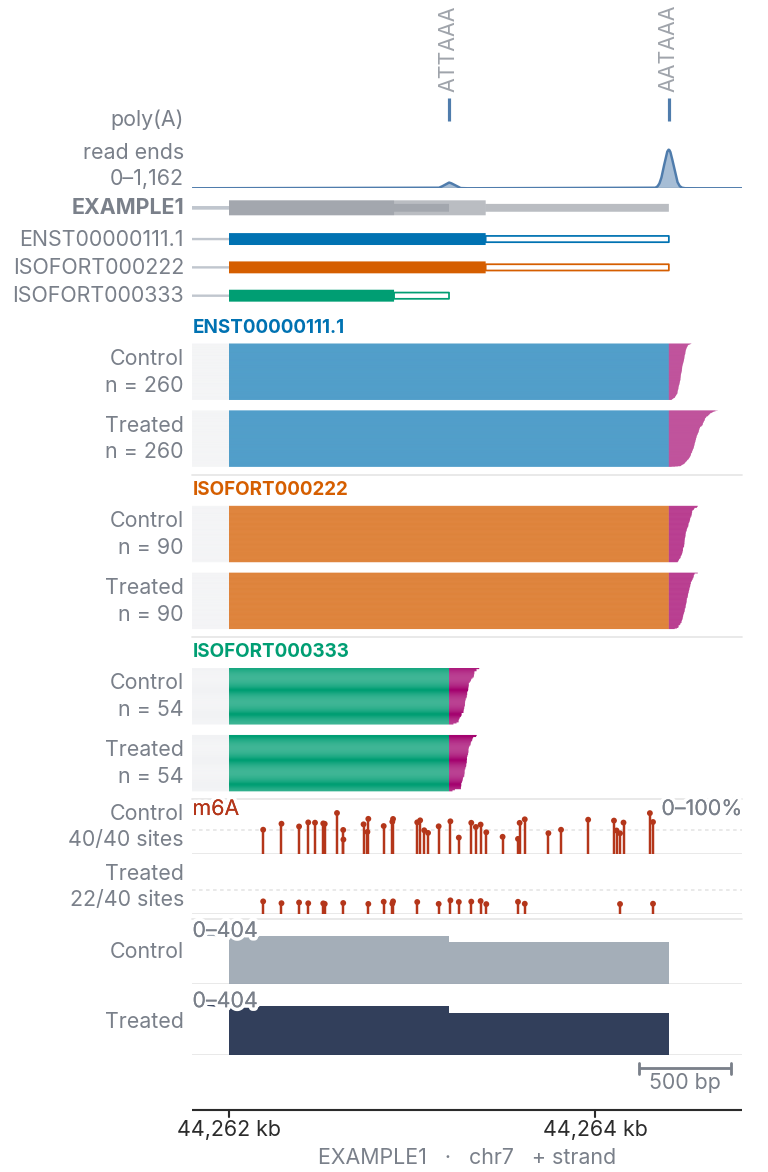
Modification tracks are drawn from modkit pileup bedMethyl files in
genome coordinates, bgzipped and tabix-indexed, one per replicate:
modkit pileup sample.bam sample.bed --ref genome.fa
bgzip sample.bed && tabix -p bed sample.bed.gz

isotracks plot --gene ACTB --isoforge results/project \
    --modkit "Control:Control_1.bed.gz;Treated:Treated_1.bed.gz" --mods a 17802 \
    --output figures/ACTB
Each lollipop is one site; its height is the modified fraction, from 0 to 100%: reads called modified over reads
assessed at that position. Replicates are pooled by summing counts. The gutter reports sites drawn over sites
assessed (89/1,933 sites).
| Option | Default | Meaning |
|---|---|---|
--mods |
a,17802 |
codes to draw. Codes joined by commas share a track; separate arguments get a track each. At most three per track. |
--min-mod-coverage |
10 | least reads at a site |
--min-mod-fraction |
0.3 | least modified fraction at a site |
--mod-regions |
exons |
window also draws sites outside the exons of the drawn isoforms |
| Base | Codes |
|---|---|
| A | a (m6A), 17596 (inosine), 69426 (Am) |
| C | m (5mC), 19228 (Cm) |
| G | 19229 (Gm) |
| U | 17802 (pseudouridine), 19227 (Um) |
--dmr draws the change in modified fraction per site from a modkit dmr pair site table, sorted, bgzipped and
tabix-indexed:
modkit dmr pair -a Control_1.bed.gz -a Control_2.bed.gz -b Treated_1.bed.gz -b Treated_2.bed.gz \
    --ref genome.fa --base A --header -o sites.bed
grep -v '^#' sites.bed | sort -k1,1 -k2,2n | bgzip > sites.bed.gz
tabix -p bed sites.bed.gz

isotracks plot --gene ACTB ... --dmr "Control vs Treated:sites.bed.gz"
The axis runs from −100% to +100%. modkit's effect size is a − b, so a stem pointing up is a site less modified
in the second sample set, and a stem pointing down one more modified.
| Option | Default | Meaning |
|---|---|---|
--max-diff-pvalue |
0.05 | largest p-value drawn |
--min-diff-effect |
0.2 | smallest change in modified fraction drawn |
--balanced-diff |
off | use modkit's replicate-balanced effect size and p-value |
Isoform and exon coordinates, 1-based and inclusive, and per-read poly(A) tail lengths:
isotracks info --gene SAT1 --isoforge results/project
isotracks info --gene SAT1 --isoforge results/project --format tsv --exons-table -o exons.tsv
isotracks polya --gene SAT1 --isoforge results/project -o SAT1_polya.csvview.print_info() # the report
view.isoform_table() # one row per isoform: exons, length, span, reads
view.exons() # one row per exon
view.polya_table() # gene, transcript_id, condition, sample, read_name, polya_length| Option | Values |
|---|---|
--width |
single (89 mm), onehalf (120), double (183), slide (254), or millimetres |
--readability |
strict, comfortable (default), large |
--roomy |
taller read, coverage and modification tracks; type size is unchanged |
--polya-scale |
base pairs drawn per nucleotide of poly(A) tail (default 1) |
--condition-labels |
display names, "Ctrl:Control,Trt:Treated" |
--condition-colors |
hex colours, "Control:#9AA5B1,Treated:#1B2A49" |
--formats, --dpi |
output formats (default PDF and PNG) and raster resolution (default 600) |
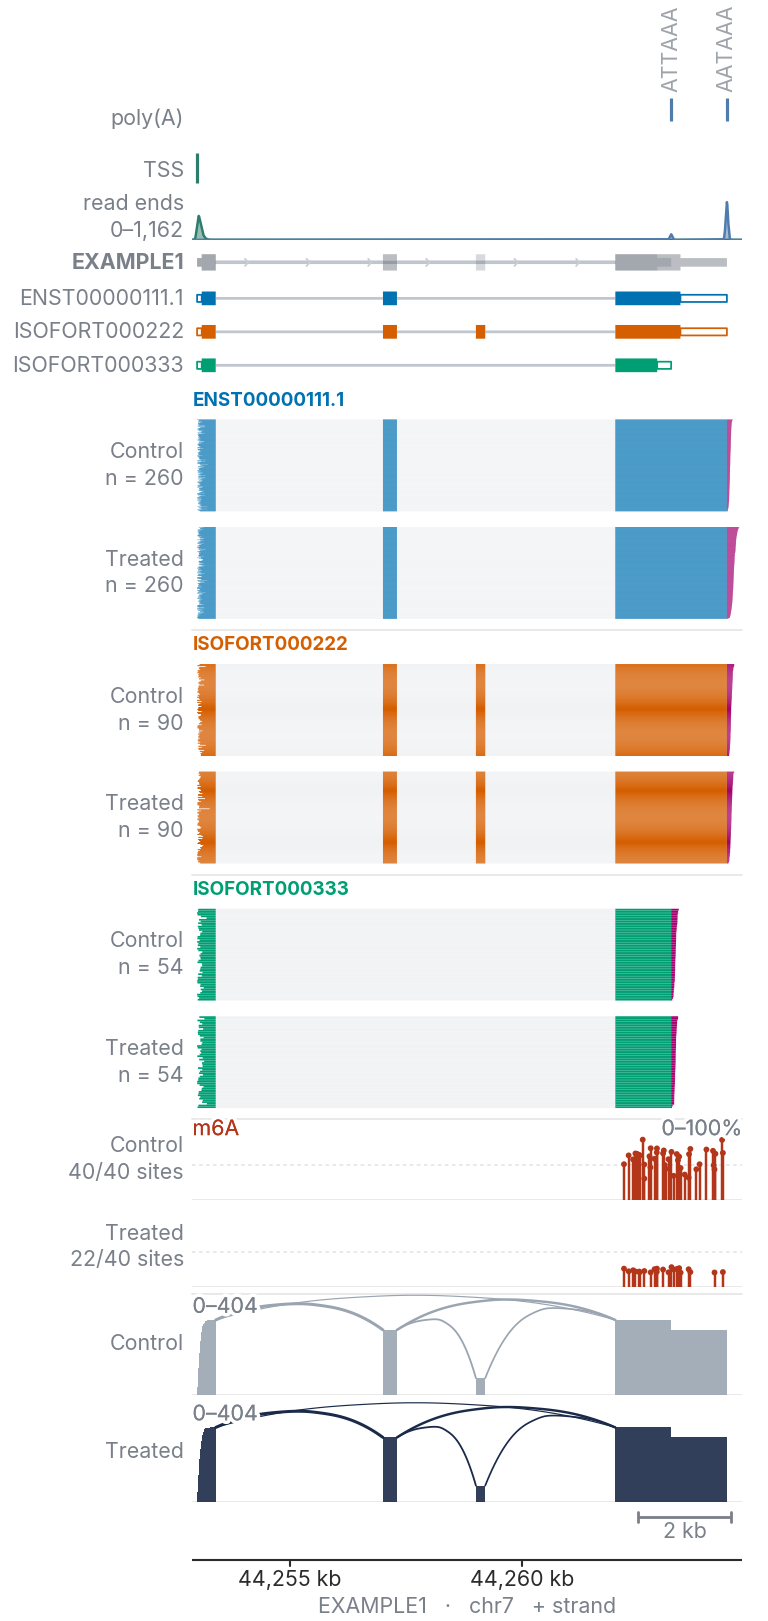
Figures are built at the printed width. Isoform colours are Okabe–Ito. PDF output embeds TrueType fonts and SVG keeps live text.
from isotracks import IsoTracks, Layout, theme

theme.use(width="double", readability="large")
IsoTracks(..., isoform_colors=["#0072B2", "#D55E00"], layout=Layout(read_stack=4.5, coverage=2.0))| Command | Does |
|---|---|
isotracks plot |
draw one gene (--gene), region (--region chr:start-end[:strand]) or fusion (--fusion) |
isotracks batch |
draw one figure per gene from a list (--genes genes.txt --outdir figures) |
isotracks info |
report isoform and exon coordinates |
isotracks polya |
write per-read poly(A) tail lengths as CSV |
isotracks index |
index a TSV read annotation by gene; not needed for Parquet |
isotracks <command> --help lists every option.
from isotracks import IsoTracks

view = IsoTracks(gene_name="SAT1", isoforge="results/project", min_reads_per_condition=5)

view.transcripts()                               # the isoforms drawn
view.plot(output="figures/SAT1")                 # PDF and PNG
view.plot(output="figures/SAT1.svg")             # one format
view.plot(region=view.zoom("last_exon"), sort_style="diamond")
view.plot(detail="last_exon", introns="scaled", highlight="3_utr")
plot_gene(gene, isoforge=..., output=..., **options) builds and draws in one call.
examples/ has a script and a notebook.
Tracks can also be stacked directly:
from isotracks import Canvas
from isotracks.io import CoverageReader

canvas = Canvas()
canvas.add("TranscriptTrack", file_name="models.bed", label="models")
canvas.add("CoverageTrack", reader=CoverageReader(file_names=["a.bam"]), label="depth")
canvas.add("CoordinateAxisTrack")
canvas.render(region=("chr1", 1_000_000, 1_010_000, "+"))pip install -e ".[dev]"
pytestThe figures in this README are written by the scripts in
docs/: make_examples.py from synthetic data,
make_gene_examples.py, make_antisense_example.py and make_fusion_example.py from an IsoForge run, and
make_logo.py.
Source layout
src/isotracks/
├── browser.py       IsoTracks, plot_gene: the gene view
├── fusion_view.py   FusionView: the fusion view
├── fusion.py        fusion calls, partners, reads and transcripts
├── isoforge.py      the files of an IsoForge run
├── annotation.py    GTF, read annotation and BED12
├── canvas.py        the figure: tracks in rows, in one or more panels
├── theme.py         widths, type sizes and colours
├── layout.py        track heights
├── cli.py           the isotracks command
├── io/              readers for alignments, features, sites and modifications
└── tracks/          one module per track type
IsoTracks is a companion tool of IsoForge. The IsoForge manuscript is in preparation. Until it is out, please cite the IsoForge repository:
Elshani M, Zhang Y, Harrison DJ. IsoForge, version 1.0.0. https://github.com/MustafaElshani/IsoForge
MIT