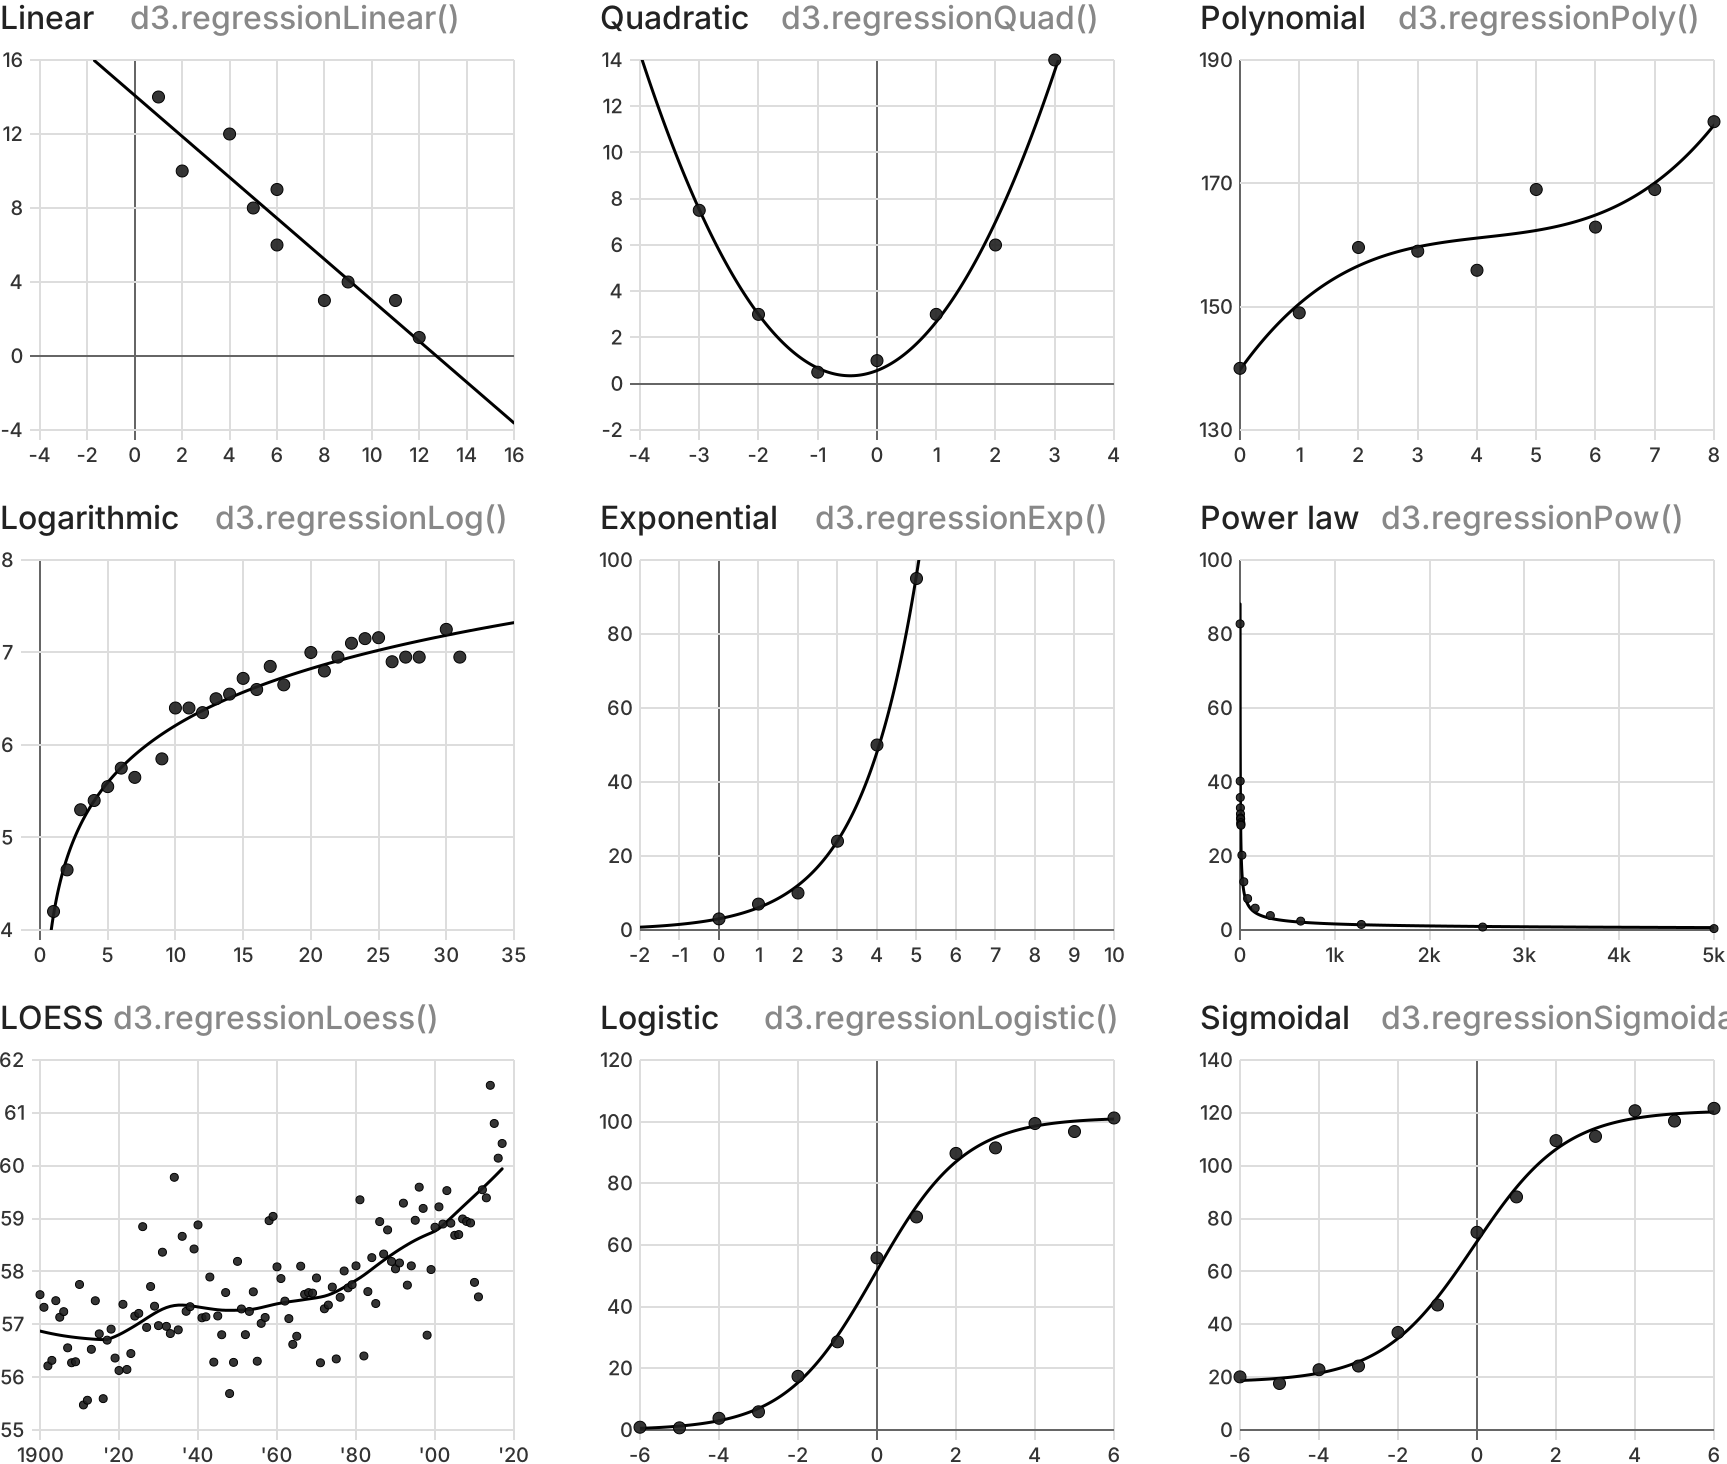
Calculate statistical regressions from two-dimensional data.
If you use NPM, npm install d3-regression.
import { regressionLinear } from "d3-regression";

const regression = regressionLinear()
  .x(d => d.x)
  .y(d => d.y)
  .domain([0, 100]);
You can also load the UMD bundle from a CDN; in vanilla, a d3 global is exported:
<script src="https://unpkg.com/d3-regression@2/dist/d3-regression.min.js"></script>
<script>

const regression = d3.regressionLinear()
  .x(d => d.x)
  .y(d => d.y)
  .domain([0, 100]);

</script>All regression generators accept any iterable of data, including arrays, Maps, and Sets. Maps work with the default accessors when their entries are two-element [x, y] pairs; Sets work with the default accessors when their values are two-element [x, y] arrays.
# d3.regressionLinear() · Source, Example
Creates a new linear regression generator with default x- and y- accessors and a null domain.
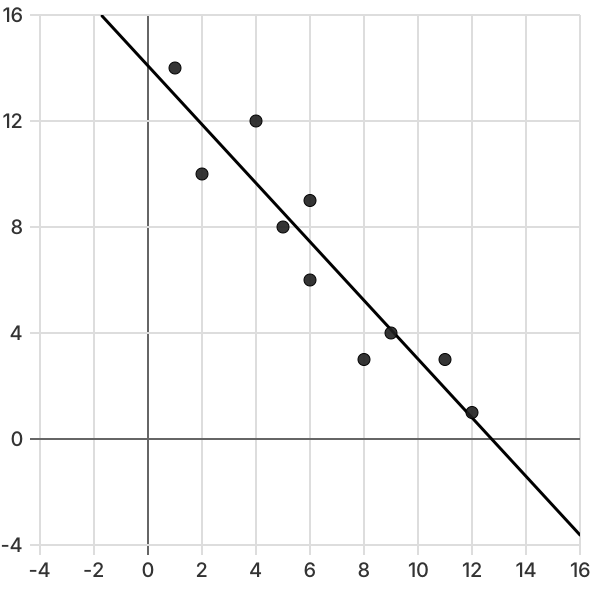
Computes the linear regression, which takes the form y = ax + b, for the specified data points, ignoring points with invalid values (null, undefined, NaN, Infinity).
Returns a line represented as an array of two points, where each point is an array of two numbers representing the point's coordinates.
Also returns properties a and b, representing the equation's coefficients, and rSquared, representing the coefficient of determination. Lastly, returns a predict property, which is a function that outputs a y-coordinate given an input x-coordinate.
If x is specified, sets the x-coordinate accessor, which is passed the current datum (d), the current index (i), and the entire data array (data). If x is not specified, returns the current x-coordinate accessor, which defaults to:
function x(d, i, data) {
  return d[0];
}If y is specified, sets the y-coordinate accessor, which is passed the current datum (d), the current index (i), and the entire data array (data). If y is not specified, returns the current y-coordinate accessor, which defaults to:
function y(d, i, data) {
  return d[1];
}
# linear.domain([domain]) · Source
If domain is specified, sets the minimum and maximum x-coordinates of the returned line to the specified array of numbers. The array must contain two elements. If the elements in the given array are not numbers, they will be coerced to numbers. If domain is not specified, returns a copy of the regression generator’s current domain.
If data is passed to the regression generator before a domain has been specified, the domain will be set to the minimum and maximum x-coordinate values of the data.
# d3.regressionExp() · Source, Example
Creates a new exponential regression generator with default x- and y- accessors and a null domain.
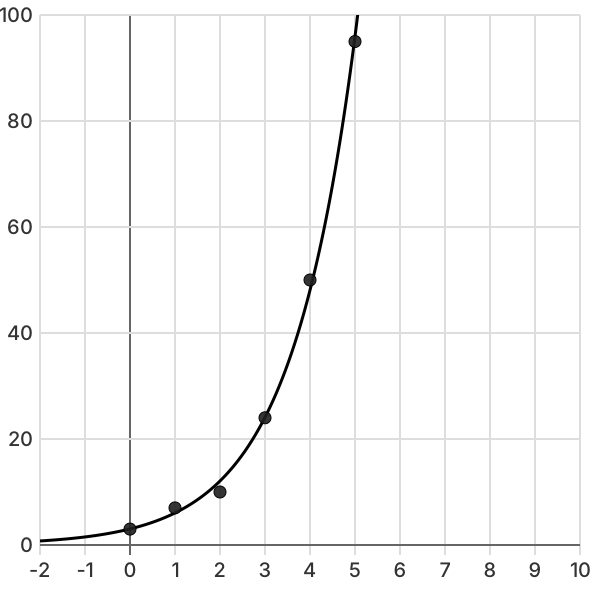
Computes the exponential regression, which takes the form y = aebx, for the specified data points, ignoring points with invalid values (null, undefined, NaN, Infinity) and nonpositive y-values.
Returns a smooth line represented as an array of points, where each point is an array of two numbers representing the point's coordinates.
Also returns properties a and b, representing the equation's coefficients, and rSquared, representing the coefficient of determination. Lastly, returns a predict property, which is a function that outputs a y-coordinate given an input x-coordinate.
See linear.x().
See linear.y().
# exp.domain([domain]) · Source
See linear.domain().
# d3.regressionLog() · Source, Example
Creates a new logarithmic regression generator with default x- and y- accessors and a null domain.
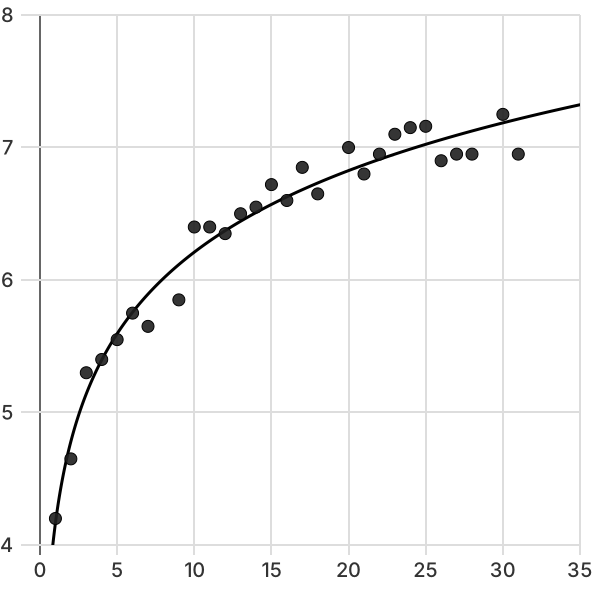
Computes the logarithmic regression, which takes the form y = a · ln(x) + b, for the specified data points, ignoring points with invalid values (null, undefined, NaN, Infinity) and nonpositive x-values.
Returns a smooth line represented as an array of points, where each point is an array of two numbers representing the point's coordinates.
Also returns properties a and b, representing the equation's coefficients, and rSquared, representing the coefficient of determination. Lastly, returns a predict property, which is a function that outputs a y-coordinate given an input x-coordinate.
See linear.x().
See linear.y().
# log.domain([domain]) · Source
See linear.domain().
If base is specified, sets the base of the logarithmic regression. If base is not specified, returns the current base, which defaults to Euler's number.
# d3.regressionQuad() · Source, Example
Creates a new quadratic regression generator with default x- and y- accessors and a null domain.
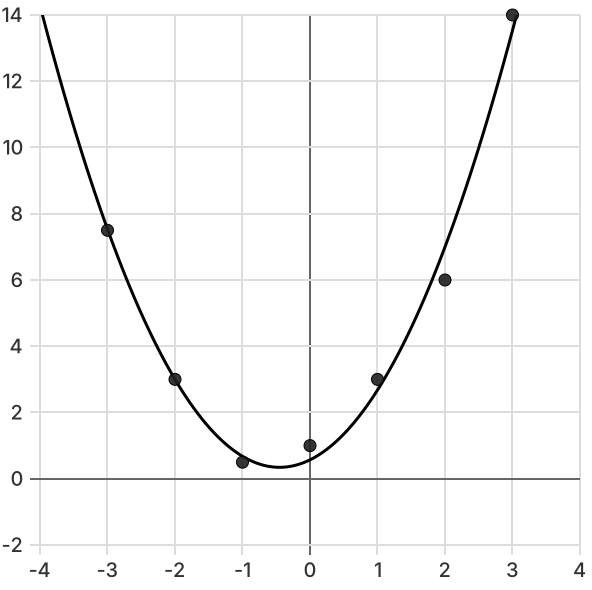
Computes the quadratic regression, which takes the form y = ax2 + bx + c, for the specified data points, ignoring points with invalid values (null, undefined, NaN, Infinity).
Returns a smooth line represented as an array of points, where each point is an array of two numbers representing the point's coordinates.
Also returns properties a, b, and c, representing the equation's coefficients, and rSquared, representing the coefficient of determination. Lastly, returns a predict property, which is a function that outputs a y-coordinate given an input x-coordinate.
See linear.x().
See linear.y().
# quad.domain([domain]) · Source
See linear.domain().
# d3.regressionPoly() · Source, Example
Creates a new polynomial regression generator with default x- and y- accessors, a null domain, and an order of 3. This implementation was adapted from regression-js.
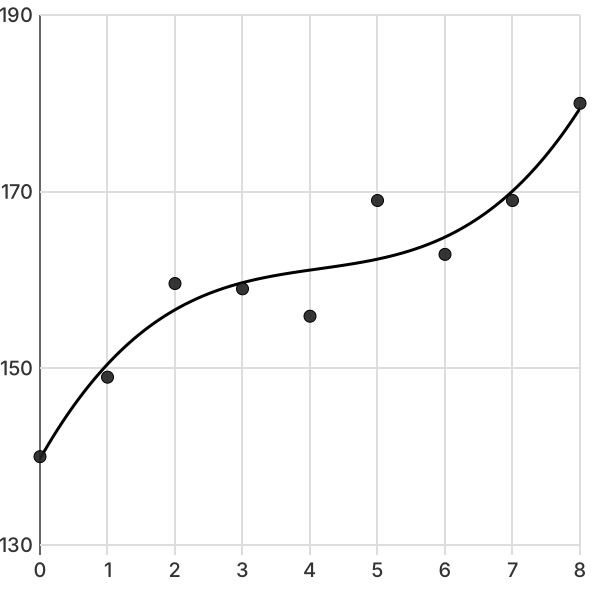
Computes the polynomial regression, which takes the form y = anxn + ... + a1x + a0, for the specified data points, ignoring points with invalid values (null, undefined, NaN, Infinity).
Returns a smooth line represented as an array of points, where each point is an array of two numbers representing the point's coordinates.
Also returns three properties: coefficients, an array representing the equation's coefficients with the intercept as the first item and nth degree coefficient as the last item; rSquared, representing the coefficient of determination; and predict, a function that outputs a y-coordinate given an input x-coordinate.
See linear.x().
See linear.y().
# poly.domain([domain]) · Source
See linear.domain().
# poly.order([order]) · Source
If order is specified, sets the regression's order to the specified number. For example, if order is set to 4, the regression generator will perform a fourth-degree polynomial regression. Likewise, if order is set to 2, the regression generator will perform a quadratic regression. Be careful about attempting to fit your data with higher order polynomials; though the regression line will fit your data with a high determination coefficient, it may have little predictive power for data outside of your domain.
If order is not specified, returns the regression generator's current order, which defaults to 3.
# d3.regressionPow() · Source, Example
Creates a new power law regression generator with default x- and y- accessors and a null domain.
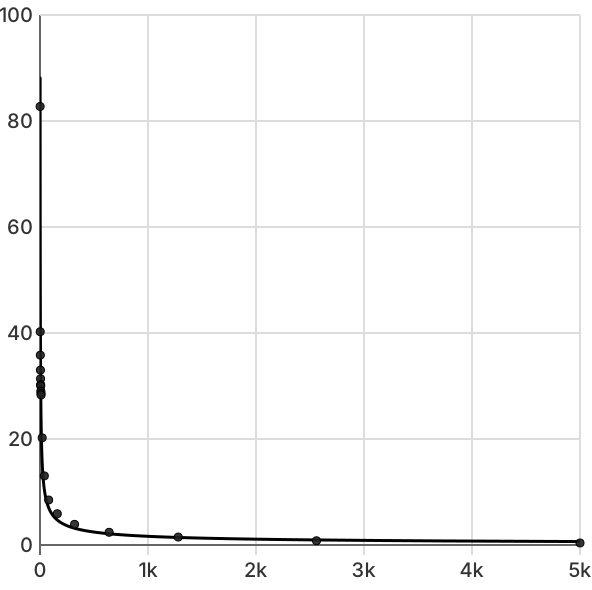
Computes the power law regression, which takes the form y = axb, for the specified data points, ignoring points with invalid values (null, undefined, NaN, Infinity) and nonpositive x- or y-values.
Returns a smooth line represented as an array of points, where each point is an array of two numbers representing the point's coordinates.
Also returns properties a and b, representing the equation's coefficients, and rSquared, representing the coefficient of determination. Lastly, returns a predict property, which is a function that outputs a y-coordinate given an input x-coordinate.
See linear.x().
See linear.y().
# pow.domain([domain]) · Source
See linear.domain().
# d3.regressionLoess() · Source, Example
Creates a new LOESS regression generator with default x- and y- accessors and a bandwidth of .3. This implementation was adapted from science.js.
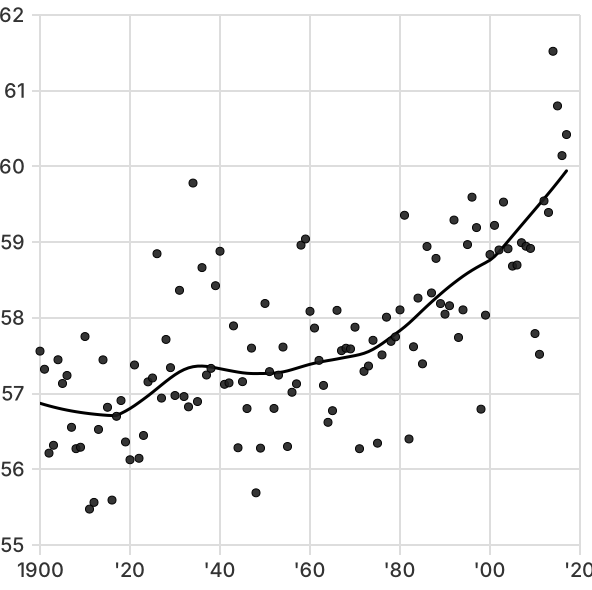
Computes the LOESS regression for the specified data points, ignoring points with invalid values (null, undefined, NaN, Infinity).
Returns a line represented as an array of n points, where each point is an array of two numbers representing the point's coordinates. Also returns rSquared, representing the coefficient of determination for the smoothed fitted values, and a predict property, which is a function that outputs a y-coordinate for a given x-coordinate by interpolating along the smoothed regression line.
See linear.x().
See linear.y().
# loess.bandwidth([bandwidth]) · Source
If bandwidth is specified, sets the LOESS regression's bandwidth, or smoothing parameter, to the specific number between 0 and 1. The bandwidth represents the share of the total data points that are used to calculate each local fit. Higher bandwidths produce smoother lines, and vice versa. If bandwidth is not specified, returns a copy of the regression generator’s current bandwidth, which defaults to .3.
# d3.regressionLogistic() · Source, Example
Creates a new logistic regression generator with default x- and y- accessors and a null domain. Use sigmoidal regression instead when the curve has a nonzero lower asymptote.
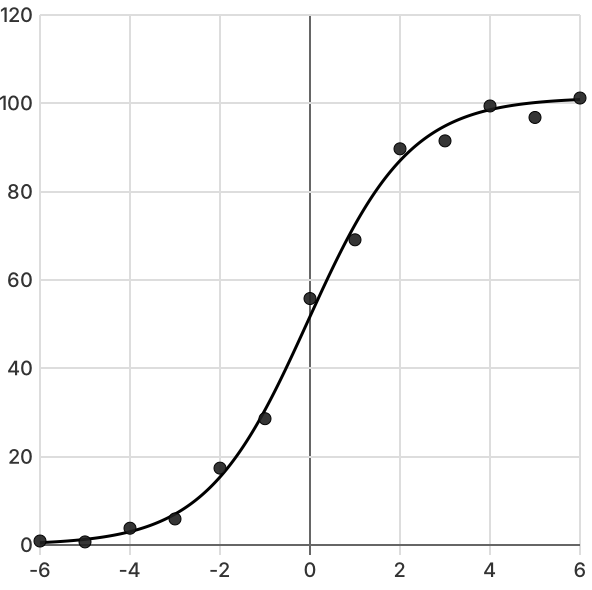
Computes the logistic regression, which takes the form y = a / (1 + e-b(x - c)), for the specified data points, ignoring points with invalid values (null, undefined, NaN, Infinity) and nonpositive y-values. This is the right choice for logistic growth or decay whose lower asymptote is zero; for shifted sigmoid curves of the form a + b / (1 + e-c(x - d)), use regressionSigmoidal.
Returns a smooth line represented as an array of points, where each point is an array of two numbers representing the point's coordinates.
Also returns properties a, b, and c, representing the equation's coefficients, and rSquared, representing the coefficient of determination. Lastly, returns a predict property, which is a function that outputs a y-coordinate given an input x-coordinate.
See linear.x().
See linear.y().
# logistic.domain([domain]) · Source
See linear.domain().
# d3.regressionSigmoidal() · Source, Example
Creates a new sigmoidal regression generator with default x- and y- accessors and a null domain. Use logistic regression instead when the lower asymptote is known to be zero.
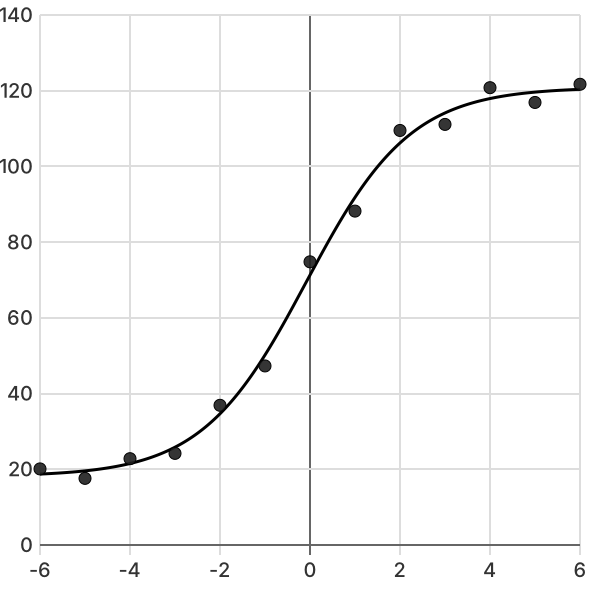
Computes the sigmoidal regression, which takes the form y = a + b / (1 + e-c(x - d)), for the specified data points, ignoring points with invalid values (null, undefined, NaN, Infinity). This four-parameter model fits shifted sigmoid curves with a baseline offset; for ordinary logistic growth or decay from zero to a, use regressionLogistic.
Returns a smooth line represented as an array of points, where each point is an array of two numbers representing the point's coordinates.
Also returns properties a, b, c, and d, representing the equation's coefficients, and rSquared, representing the coefficient of determination. Lastly, returns a predict property, which is a function that outputs a y-coordinate given an input x-coordinate.
See linear.x().
See linear.y().
# sigmoidal.domain([domain]) · Source
See linear.domain().