Auditing label-choice bias in healthcare risk-stratification models.
riskaudit is a small, dependency-light Python library that measures label-choice bias — how much genuine need a risk model leaves behind when it is trained on a convenient proxy (usually healthcare spending) instead of need itself. It is an auditor, not a model: it never trains or predicts. Give it the scores a deployed model already produced, an independent need measure, and population weights, and it quantifies the need left behind — weighted, with a design-based confidence interval, read against a random floor and an oracle ceiling.




How label-choice bias arises — and where riskaudit measures it. A concept map, not a data chart; the numbers are in Evidence.
(Versión en español más abajo — ir al español.)
pip install riskauditPython ≥ 3.11. The core needs only numpy, pandas, scikit-learn, matplotlib. Running the bundled examples (the MEPS pipeline, the Obermeyer download) needs a heavier stack, installed from source with the examples extra: pip install -e ".[examples]".
Audit your own model's scores in a few lines — no training, no PHI:
import numpy as np
from riskaudit.audit import top_k_capture

rng = np.random.default_rng(2026)
scores  = rng.random(5_000)   # what your risk model output per person
need    = rng.random(5_000)   # an independent measure of real need
weights = rng.random(5_000)   # population / survey weights

c = top_k_capture(scores, need, k=0.10, weights=weights)
print(f"top-decile capture: {c.value:.0%}  (floor {c.baseline:.0%}, oracle {c.oracle:.0%})")
# top-decile capture: 10%  (floor 10%, oracle 19%)   <- a random score sits at the floor
audit_report(results, "audit.html") bundles a whole set of results into one self-contained HTML report.
Health systems have limited budgets, so a model decides who gets prioritized — usually by predicting who will "spend the most," because spending is recorded for everyone. That choice has a blind spot: someone in distress who does not seek care has near-zero spending, so a spend-trained model calls them low-risk and never looks. The need was there; the label never looked for it. This is label-choice bias (Obermeyer et al., 2019) — the mechanism sketched at the top of this page.
For a score
A raw capture is uninterpretable alone, so every result is read against two anchors:
- a floor — a random score captures need in proportion to its size,
$C_k(\text{random})=k$ ; - an oracle — ranking by need itself,
$C_k(n)$ , the achievable ceiling.
The label-choice cost of training on a proxy scores + need + weights, it is domain- and country-agnostic: the same functions audit a hospital's readmission model, an insurer's cost model, or a ministry's triage algorithm.
Every function answers one part of a single question — how much need is left behind, of whom, compared to what, and with what certainty. All support weights and carry a confidence interval (or a docstring saying why not).
%%{init: {'theme':'base','themeVariables':{'primaryColor':'#eef3f8','primaryBorderColor':'#8fa8c8','primaryTextColor':'#152536','lineColor':'#9aa1a9'}}}%%
flowchart LR
    S["scores<br/>a deployed model's output"] --> AUD(["riskaudit.audit"])
    N["need<br/>independent measure"] --> AUD
    W["weights"] --> AUD
    AUD --> C["how much? capture vs. floor and oracle"]
    AUD --> G["of whom? group_capture"]
    AUD --> L["which label? reclassification and frontier"]
    AUD --> U["how certain? design-based CI and label_robustness"]
    classDef tool fill:#dfeaf5,stroke:#4C78A8,color:#173a5e;
    class AUD tool
| Function | Question it answers | |
|---|---|---|
| Measure | top_k_capture |
Of all real need, what fraction lands in the top-k, vs. the random floor and the oracle ceiling? |
label_choice_curve |
Where do the highest-need people sit across the score's percentiles? | |
| Disaggregate | group_capture |
Capture within each subgroup — whose need does the score rank worst? |
| Decide | reclassification |
Switching the label from A to B, who enters and leaves the priority list? |
label_blend_frontier |
Blend two labels α·A+(1−α)·B — the capture/composition trade-off frontier. | |
| Attribute | ablation |
Cross-fitted: how much does global performance drop vs. how much does capture collapse when a feature group is removed? |
incremental_lift |
Among the deprioritized, do those in need generate more future outcome than predicted? (the contribution metric) | |
regression_to_mean |
How much of a top-k outcome drop is just regression to the mean? (descriptive) | |
| Stress-test | label_robustness |
How wrong the need label would have to be to explain the gap away. |
| Report | audit_report |
Bundle any set of results into one self-contained HTML file. |
Most of these are careful weightings of familiar ideas (top_k_capture is weighted recall of need). Two are contributions I have not seen packaged elsewhere: incremental_lift, which makes the equity argument non-circular by scoring the model against its own future currency rather than the need label; and label_robustness, a Rosenbaum-style sensitivity bound on the need measure itself.
Confidence intervals are a percentile bootstrap. With a SurveyDesign, it is a stratified cluster bootstrap — PSUs are resampled within strata (VARSTR/VARPSU), so the interval reflects the survey design rather than treating a filtered sub-sample as i.i.d.; subgroup CIs use a domain bootstrap over the full frame. Without a design it falls back to a weighted row bootstrap.
Two honest caveats, stated rather than hidden: the top-k statistic is a non-smooth functional (a step at the threshold), so bootstrap coverage is approximate near ties; and a stratum that collapses to a single PSU is held fixed, contributing zero variance and biasing its CI low — SurveyDesign warns when this happens. Establishing coverage by simulation is on the roadmap.
The audit is only as meaningful as three inputs the user supplies:
needis an admissible yardstick. Calling a model "biased" asserts which target is legitimate need. That is a normative choice — stated and defended, not assumed (seeexamples/meps/METHODS.md) — andlabel_robustnessstress-tests how much it can be wrong before the finding flips.scores,need,weightsdescribe the same units, andneedis measured independently of the score under audit (otherwise the gap is mechanical).- The design is known when a design-based CI is claimed (strata/PSU labels); otherwise CIs are row-based and ignore clustering.
Three worked examples, from a controlled check to real survey microdata:
| Example | Data | What it demonstrates | Run |
|---|---|---|---|
| Benchmark | synthetic, bias planted with a known answer | every function recovers the planted bias end-to-end | python examples/benchmark/run_benchmark.py |
| Obermeyer 2019 | the authors' public synthetic data | reproduces the canonical label-choice audit, API-only | make validate-obermeyer |
| MEPS 2021–2023 | real U.S. survey microdata (AHRQ) | full weighted, design-based audit on messy longitudinal data | see examples/meps |
Validation — Obermeyer et al. (2019). Using only the public API on the authors' public data, the deployed cost-score leaves health need behind (top-3% capture of active chronic conditions 0.12 vs. a 0.19 oracle) and captures less of it for Black patients (0.10) than White (0.12); re-ranking by health raises the Black share of the auto-enroll tier (20.0% → 23.3%) and turns over 64% of the list. Directions match the paper; magnitudes are attenuated because the data is synthetic — documented, not tuned away, in validation/obermeyer_2019/COVERAGE.md.
Case study — MEPS 2021–2023. On ~3,001 adults with valid K6 distress scores in both panel years, the spend model captures only ~15% of top-decile need — barely above the ~10% floor, far below the ~41% oracle; a need-trained model reaches ~29%. Among the people the spend model deprioritizes, those in distress run up more total future cost than it predicted (incremental lift +0.8 log-dollars with the mental-health features, +1.0 without — both 95% CIs exclude zero): the bias is in the label, not in missing information.
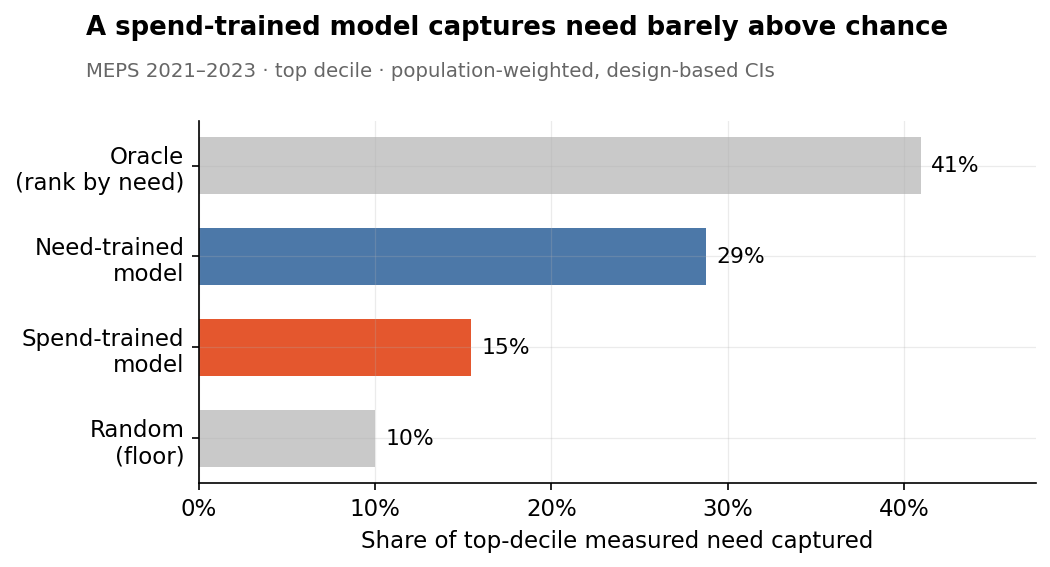
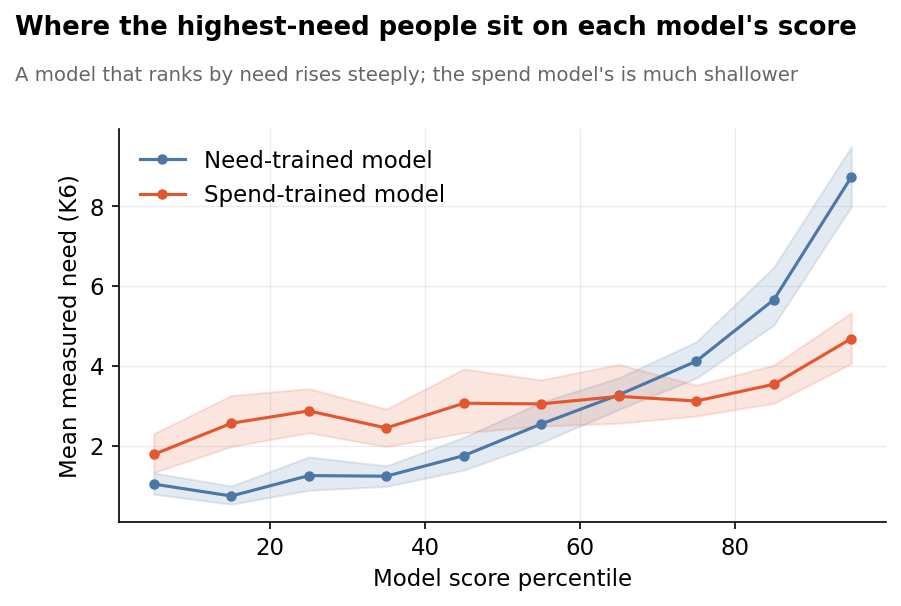
Left/top: the spend model captures 15% of top-decile need — barely above the 10% random floor, far below the 41% oracle. Right/bottom: where the highest-need people land on each model's score. Both are riskaudit's own output.
Honest limit. That excess does not appear on non-psychiatric utilization (ER + hospitalizations; lift ≈ 0, CI includes zero), so I do not claim the distress surfaces specifically as non-psychiatric spending — a clean test needs a non-psychiatric spend target (backlog). Full reasoning is in examples/meps/METHODS.md.
Honesty about limits is a design goal of this project, not a footnote:
- Small severe-untreated subgroup (~40 in the MEPS analytic sample) — reported descriptively with wide CIs, never modeled. The robust finding is the population-level mechanism, not an anecdote about invisible patients.
- "Need" is a normative choice — see Assumptions above;
label_robustnessquantifies its fragility. - Bootstrap coverage for the top-k functional is approximate — see Inference above.
- No causal claim. The audit measures where need lands on a score, not why; it is a diagnostic, not an identification strategy.
No data is stored in this repository — only download scripts and SHA-256 checksums are versioned; microdata is git-ignored. MEPS (AHRQ, U.S.) is free and needs no registration: HC-233/243/251 (FYC 2021–2023), HC-244 (Panel 26 longitudinal), HC-231 (Conditions) and HC-229A (Prescribed Medicines). See examples/meps/README.md.
v0.3.0 is on PyPI and archived on Zenodo. Next (see docs/roadmap-v2.md): a coverage simulation study for the capture CI, cost_of_blindness (the lift in budget terms), worst-off capture, and priority-list stability. A closed list, one function at a time — the project is strong because it does one thing.
Proromant, C. (2026). riskaudit: auditing label-choice bias in healthcare risk-stratification models (v0.3.0) [Software]. Zenodo. https://doi.org/10.5281/zenodo.21461268
Machine-readable metadata is in CITATION.cff.
- Obermeyer, Z., Powers, B., Vogeli, C., & Mullainathan, S. (2019). Dissecting racial bias in an algorithm used to manage the health of populations. Science, 366(6464), 447–453. https://doi.org/10.1126/science.aax2342
- Rosenbaum, P. R. (2002). Observational Studies (2nd ed.). Springer. — sensitivity-analysis framing behind
label_robustness. - Rust, K. F., & Rao, J. N. K. (1996). Variance estimation for complex surveys using replication techniques. Statistical Methods in Medical Research, 5(3), 283–310. — design-based (replication) variance.
MIT © Conrado Proromant — MD (PUC), MSc(c) Data Science (PUC).
Auditoría del sesgo por elección de etiqueta en modelos de estratificación de riesgo en salud.
riskaudit es una librería de Python, pequeña y de dependencias livianas, que mide el sesgo por elección de la etiqueta: cuánta necesidad real deja fuera un modelo de riesgo cuando se entrena con un proxy cómodo (típicamente el gasto sanitario) en lugar de la necesidad misma. Es un auditor, no un modelo: no entrena ni predice. Le das los scores que un modelo desplegado ya produjo, una medida independiente de need (necesidad) y weights poblacionales, y cuantifica la necesidad dejada atrás — ponderada, con IC de diseño, leída contra un piso al azar y un oráculo.
Cómo surge el sesgo por elección de etiqueta — y dónde lo mide riskaudit. Un mapa conceptual, no un gráfico de datos; los números están en Evidencia.
pip install riskauditPython ≥ 3.11. El core solo necesita numpy, pandas, scikit-learn, matplotlib. Para correr los ejemplos (pipeline MEPS, descarga de Obermeyer) se instala desde el fuente con el extra examples: pip install -e ".[examples]".
Audita los puntajes de tu propio modelo en pocas líneas — sin entrenar, sin datos sensibles:
import numpy as np
from riskaudit.audit import top_k_capture

rng = np.random.default_rng(2026)
scores, need, weights = rng.random(5_000), rng.random(5_000), rng.random(5_000)
c = top_k_capture(scores, need, k=0.10, weights=weights)
print(f"captura top-decil: {c.value:.0%}  (piso {c.baseline:.0%}, oráculo {c.oracle:.0%})")
audit_report(results, "audit.html") empaqueta un conjunto de resultados en un informe HTML autocontenido.
Los sistemas de salud tienen presupuesto limitado, así que un modelo decide a quién se prioriza — normalmente prediciendo quién "va a gastar más", porque el gasto está registrado para todos. Esa elección tiene un punto ciego: alguien con distrés que no consulta tiene gasto casi cero, así que el modelo lo etiqueta como bajo riesgo y nunca lo mira. La necesidad estaba; la etiqueta nunca la buscó. Esto es el sesgo por elección de la etiqueta (Obermeyer et al., 2019) — el mecanismo esquematizado al inicio de esta página.
Para un score
Un número de captura no significa nada solo, así que se lee contra dos anclas: un piso (un score al azar captura en proporción a su tamaño, scores + need + weights, es agnóstico al dominio y al país.
Cada función responde una parte de una sola pregunta — cuánta necesidad queda fuera, de quién, comparada con qué y con qué certeza. Todas soportan pesos y traen IC (o un docstring que dice por qué no).
%%{init: {'theme':'base','themeVariables':{'primaryColor':'#eef3f8','primaryBorderColor':'#8fa8c8','primaryTextColor':'#152536','lineColor':'#9aa1a9'}}}%%
flowchart LR
    S["scores<br/>salida de un modelo desplegado"] --> AUD(["riskaudit.audit"])
    N["need<br/>medida independiente"] --> AUD
    W["weights"] --> AUD
    AUD --> C["¿cuánta? captura vs. piso y oráculo"]
    AUD --> G["¿de quién? group_capture"]
    AUD --> L["¿qué etiqueta? reclassification y frontier"]
    AUD --> U["¿qué certeza? IC de diseño y label_robustness"]
    classDef tool fill:#dfeaf5,stroke:#4C78A8,color:#173a5e;
    class AUD tool
| Función | Pregunta que responde | |
|---|---|---|
| Medir | top_k_capture |
De toda la necesidad, ¿qué fracción cae en el top-k, vs. el piso al azar y el oráculo? |
label_choice_curve |
¿Dónde caen las personas de mayor necesidad a lo largo de los percentiles del score? | |
| Desagregar | group_capture |
Captura dentro de cada subgrupo — ¿de quién es la necesidad peor rankeada? |
| Decidir | reclassification |
Al cambiar la etiqueta de A a B, ¿quién entra y sale de la lista de prioridad? |
label_blend_frontier |
Mezcla dos etiquetas α·A+(1−α)·B — la frontera de trade-off captura/composición. | |
| Atribuir | ablation |
Cross-fitted: ¿cuánto baja el desempeño global vs. cuánto se desploma la captura al quitar un grupo de features? |
incremental_lift |
Entre los deprioritizados, ¿los que tienen necesidad generan más desenlace futuro del predicho? (métrica-contribución) | |
regression_to_mean |
¿Cuánto de una caída del top-k es solo regresión a la media? (descriptivo) | |
| Estresar | label_robustness |
¿Cuán equivocada tendría que estar la etiqueta need para explicar la brecha? |
| Informar | audit_report |
Empaqueta cualquier conjunto de resultados en un HTML autocontenido. |
La mayoría son ponderaciones cuidadosas de ideas conocidas (top_k_capture es recall ponderado de la necesidad). Dos son contribuciones que no he visto empaquetadas: incremental_lift, que hace no-circular el argumento de equidad al medir el modelo contra su propia moneda futura y no contra la etiqueta; y label_robustness, una cota de sensibilidad estilo Rosenbaum sobre la propia medida de necesidad.
Los IC son un bootstrap percentil. Con un SurveyDesign es un bootstrap de clúster estratificado — se remuestrean PSUs dentro de estratos (VARSTR/VARPSU), así el IC refleja el diseño muestral en vez de tratar una submuestra filtrada como i.i.d.; los IC de subgrupo usan bootstrap de dominio sobre el marco completo. Sin diseño, cae a un bootstrap de filas ponderado.
Dos caveats honestos, dichos y no escondidos: el estadístico top-k es un funcional no suave (un escalón en el umbral), así que la cobertura del bootstrap es aproximada cerca de empates; y un estrato que colapsa a un solo PSU se mantiene fijo, aporta varianza cero y sesga su IC hacia abajo — SurveyDesign avisa cuando pasa. Establecer la cobertura por simulación está en el roadmap.
La auditoría vale lo que valen tres insumos que provee el usuario:
needes una vara admisible. Llamar "sesgado" a un modelo afirma cuál es la necesidad legítima. Es una elección normativa — declarada y defendida, no supuesta (verexamples/meps/METHODS.md) — ylabel_robustnessmide cuánto puede estar equivocada antes de que el hallazgo se dé vuelta.scores,need,weightsdescriben las mismas unidades, yneedse mide independiente del score auditado (si no, la brecha es mecánica).- El diseño se conoce cuando se declara un IC de diseño (estratos/PSU); si no, los IC son de filas e ignoran el clustering.
Tres ejemplos, del control sintético a los microdatos reales de encuesta:
| Ejemplo | Datos | Qué demuestra | Correr |
|---|---|---|---|
| Benchmark | sintético, sesgo plantado con respuesta conocida | cada función recupera el sesgo plantado, end-to-end | python examples/benchmark/run_benchmark.py |
| Obermeyer 2019 | datos sintéticos públicos de los autores | reproduce la auditoría canónica, solo con el API | make validate-obermeyer |
| MEPS 2021–2023 | microdatos reales de encuesta (AHRQ, EE.UU.) | auditoría completa ponderada y de diseño sobre datos longitudinales sucios | ver examples/meps |
Validación — Obermeyer et al. (2019). Solo con el API sobre los datos públicos: el score de costo deja fuera la necesidad de salud (captura top-3% de condiciones crónicas 0.12 vs. oráculo 0.19) y captura menos la de pacientes negros (0.10) que blancos (0.12); re-rankear por salud sube su participación en el tramo auto-enroll (20.0% → 23.3%) y rota el 64% de la lista. Las direcciones coinciden con el paper; las magnitudes están atenuadas por ser dato sintético — documentado, no maquillado, en validation/obermeyer_2019/COVERAGE.md.
Caso — MEPS 2021–2023. Sobre ~3.001 adultos con K6 válido en ambos años del panel, el modelo de gasto captura solo ~15% de la necesidad del top-decil — apenas sobre el ~10% del azar, muy por debajo del ~41% del oráculo; un modelo de necesidad llega a ~29%. Entre los deprioritizados, los que están en distrés acumulan más gasto total futuro del predicho (lift +0.8 log-dólares con las features de salud mental, +1.0 sin ellas — ambos IC 95% excluyen el cero): el sesgo está en la etiqueta, no en falta de información.
Arriba: el modelo de gasto captura 15% de la necesidad del top-decil — apenas sobre el piso al azar de 10%, muy por debajo del oráculo de 41%. Abajo: dónde caen las personas de mayor necesidad en el score de cada modelo. Ambas son salida de la propia riskaudit.
Límite honesto. Ese exceso no aparece en la utilización no-psiquiátrica (urgencias + hospitalizaciones; lift ≈ 0, IC incluye el cero), así que no afirmo que el distrés se manifieste como gasto no psiquiátrico — un test limpio necesita un target de gasto no-psiquiátrico (backlog). Razonamiento completo en examples/meps/METHODS.md.
La honestidad sobre los límites es un objetivo de diseño, no una nota al pie:
- Subgrupo severo no tratado pequeño (~40 en la muestra analítica MEPS): descriptivo, IC anchos, nunca se modela. El hallazgo robusto es el mecanismo poblacional, no la anécdota de "los invisibles".
- "Necesidad" es una elección normativa — ver Supuestos;
label_robustnesscuantifica su fragilidad. - La cobertura del bootstrap para el funcional top-k es aproximada — ver Inferencia.
- Sin afirmación causal. La auditoría mide dónde cae la necesidad en un score, no por qué; es un diagnóstico, no una estrategia de identificación.
No se versiona ningún dato — solo scripts de descarga y checksums SHA-256; los microdatos van git-ignored. MEPS (AHRQ, EE.UU.) es gratis y sin registro: HC-233/243/251 (FYC 2021–2023), HC-244 (Panel 26 longitudinal), HC-231 (Condiciones) y HC-229A (Medicamentos). Ver examples/meps/README.md.
v0.3.0 está en PyPI y archivado en Zenodo. Siguiente (ver docs/roadmap-v2.md): un estudio de cobertura por simulación para el IC de captura, cost_of_blindness (el lift en términos de presupuesto), captura del peor-servido y estabilidad de la lista. Lista cerrada, una función a la vez.
Proromant, C. (2026). riskaudit: auditing label-choice bias in healthcare risk-stratification models (v0.3.0) [Software]. Zenodo. https://doi.org/10.5281/zenodo.21461268
Metadatos legibles por máquina en CITATION.cff.
- Obermeyer, Z., Powers, B., Vogeli, C., & Mullainathan, S. (2019). Dissecting racial bias in an algorithm used to manage the health of populations. Science, 366(6464), 447–453. https://doi.org/10.1126/science.aax2342
- Rosenbaum, P. R. (2002). Observational Studies (2ª ed.). Springer. — marco de análisis de sensibilidad detrás de
label_robustness. - Rust, K. F., & Rao, J. N. K. (1996). Variance estimation for complex surveys using replication techniques. Statistical Methods in Medical Research, 5(3), 283–310. — varianza de diseño por replicación.
MIT © Conrado Proromant — Médico (PUC), MSc(c) Data Science (PUC).