I hope I am doing this right, but when I use the command to get the alerts, I'm using as follows:
Get-LogicMonitorAlert -AccessId $accid -AccessKey $seckey -AccountName $acct -Filter 'filter=rule:"Error"' -EndDate (Get-Date).AddHours(-1) -Verbose
I am getting the result as follows:
VERBOSE: [VERBOSE] 2022-03-15T10:57:37: Beginning Get-LogicMonitorAlert.
VERBOSE: [VERBOSE] 2022-03-15T10:57:37: Converting/setting start/end date to seconds since epoch.
2022-03-15T10:57:37: Operating in the Default parameter set.
2022-03-15T10:57:37: Filter is: filter=rule:"Error"
2022-03-15T10:57:37: Start date: and End date: 15/03/2022 09:57:37
VERBOSE: [VERBOSE] 2022-03-15T10:57:37: Start epoch not specified, defaulting to the past day.
2022-03-15T10:57:37: Start date: 1647255457 and End date: 1647338257
VERBOSE: [VERBOSE] 2022-03-15T10:57:37: Converting special characters to URL encoding.
VERBOSE: [VERBOSE] 2022-03-15T10:57:37: The request loop has run 0 times.
VERBOSE: [VERBOSE] 2022-03-15T10:57:37: Building request header.
VERBOSE: [VERBOSE] 2022-03-15T10:57:37: Executing the REST query.
VERBOSE: GET with 0-byte payload
VERBOSE: received -byte response of content type application/json
VERBOSE: Content encoding: utf-8
VERBOSE: [VERBOSE] 2022-03-15T10:57:37: Executed REST query. There are 6 entries in $alerts.
VERBOSE: [VERBOSE] 2022-03-15T10:57:37: The request loop has run 1 times.
VERBOSE: [VERBOSE] 2022-03-15T10:57:37: Executing the REST query.
VERBOSE: GET with 0-byte payload
VERBOSE: received 75-byte response of content type application/json
VERBOSE: Content encoding: utf-8
VERBOSE: [VERBOSE] 2022-03-15T10:57:37: Executed REST query. There are 6 entries in $alerts.
Yet in the screenshot (servernames removed to protect the guilty) - There are more alerts than are being returned from the command.
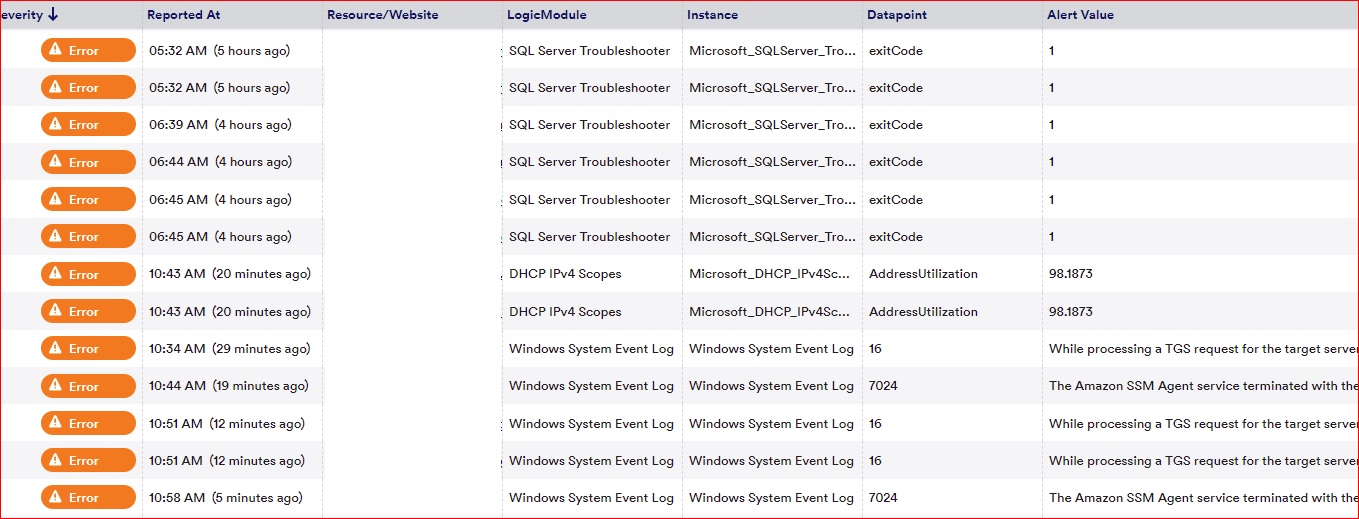
The SQL Alerts (Top 6) are showing, but the ones below that are not showing up?
If I edit the query:
Get-LogicMonitorAlert -AccessId $accid -AccessKey $seckey -AccountName $acct -Filter 'filter=severity:3,cleared:"false"' -EndDate (Get-Date).AddHours(-1) -Verbose
I get the exact same result.
if I edit the query to something like this:
$Alerts = Get-LogicMonitorAlert -AccessId $accid -AccessKey $seckey -AccountName $acct -Filter 'filter=rule:"Error"' -StartDate (Get-Date).AddDays(-5) -EndDate (Get-Date).AddHours(-1) -Verbose
foreach ($a in $Alerts) {
    $Name = $a.monitorObjectName
    $Obj = $a.monitorObjectType
    $Rule = $a.rule
    $Type = $a.type
    $Val = $a.alertValue
    $Threshold = $a.threshold
    $Emailed = $a.receivedList

    Write-Host "$Obj, $Rule, $Type, $Val, $Threshold, $Emailed"
}
I get the following: (names removed again)
VERBOSE: [VERBOSE] 2022-03-15T11:15:14: Beginning Get-LogicMonitorAlert.
VERBOSE: [VERBOSE] 2022-03-15T11:15:14: Converting/setting start/end date to seconds since epoch.
2022-03-15T11:15:14: Operating in the Default parameter set.
2022-03-15T11:15:14: Filter is: filter=rule:"Error"
2022-03-15T11:15:14: Start date: 10/03/2022 11:15:14 and End date: 15/03/2022 10:15:14
2022-03-15T11:15:14: Start date: 1646910914 and End date: 1647339314
VERBOSE: [VERBOSE] 2022-03-15T11:15:14: Converting special characters to URL encoding.
VERBOSE: [VERBOSE] 2022-03-15T11:15:14: The request loop has run 0 times.
VERBOSE: [VERBOSE] 2022-03-15T11:15:14: Building request header.
VERBOSE: [VERBOSE] 2022-03-15T11:15:14: Executing the REST query.
VERBOSE: GET with 0-byte payload
VERBOSE: received -byte response of content type application/json
VERBOSE: Content encoding: utf-8
VERBOSE: [VERBOSE] 2022-03-15T11:15:14: Executed REST query. There are 9 entries in $alerts.
VERBOSE: [VERBOSE] 2022-03-15T11:15:14: The request loop has run 1 times.
VERBOSE: [VERBOSE] 2022-03-15T11:15:14: Executing the REST query.
VERBOSE: GET with 0-byte payload
VERBOSE: received 75-byte response of content type application/json
VERBOSE: Content encoding: utf-8
VERBOSE: [VERBOSE] 2022-03-15T11:15:16: Executed REST query. There are 9 entries in $alerts.
device, Error, dataSourceAlert, 130.0, > 90 100,
device, Error, dataSourceAlert, 193.0, > 90 100,
device, Error, dataSourceAlert, 95.6898, >= 91 95 98,
device, Error, dataSourceAlert, 1.0, = 1 1,
device, Error, dataSourceAlert, 1.0, = 1 1,
device, Error, dataSourceAlert, 1.0, = 1 1,
device, Error, dataSourceAlert, 1.0, = 1 1,
device, Error, dataSourceAlert, 1.0, = 1 1,
device, Error, dataSourceAlert, 1.0, = 1 1,
So the rule is working but it seems the ones with windows event log errors are missing.
maybe I'm doing something wrong?
Many Thanks
I hope I am doing this right, but when I use the command to get the alerts, I'm using as follows:
Get-LogicMonitorAlert -AccessId $accid -AccessKey $seckey -AccountName $acct -Filter 'filter=rule:"Error"' -EndDate (Get-Date).AddHours(-1) -VerboseI am getting the result as follows:
VERBOSE: [VERBOSE] 2022-03-15T10:57:37: Beginning Get-LogicMonitorAlert.
VERBOSE: [VERBOSE] 2022-03-15T10:57:37: Converting/setting start/end date to seconds since epoch.
2022-03-15T10:57:37: Operating in the Default parameter set.
2022-03-15T10:57:37: Filter is: filter=rule:"Error"
2022-03-15T10:57:37: Start date: and End date: 15/03/2022 09:57:37
VERBOSE: [VERBOSE] 2022-03-15T10:57:37: Start epoch not specified, defaulting to the past day.
2022-03-15T10:57:37: Start date: 1647255457 and End date: 1647338257
VERBOSE: [VERBOSE] 2022-03-15T10:57:37: Converting special characters to URL encoding.
VERBOSE: [VERBOSE] 2022-03-15T10:57:37: The request loop has run 0 times.
VERBOSE: [VERBOSE] 2022-03-15T10:57:37: Building request header.
VERBOSE: [VERBOSE] 2022-03-15T10:57:37: Executing the REST query.
VERBOSE: GET with 0-byte payload
VERBOSE: received -byte response of content type application/json
VERBOSE: Content encoding: utf-8
VERBOSE: [VERBOSE] 2022-03-15T10:57:37: Executed REST query. There are 6 entries in $alerts.
VERBOSE: [VERBOSE] 2022-03-15T10:57:37: The request loop has run 1 times.
VERBOSE: [VERBOSE] 2022-03-15T10:57:37: Executing the REST query.
VERBOSE: GET with 0-byte payload
VERBOSE: received 75-byte response of content type application/json
VERBOSE: Content encoding: utf-8
VERBOSE: [VERBOSE] 2022-03-15T10:57:37: Executed REST query. There are 6 entries in $alerts.
Yet in the screenshot (servernames removed to protect the guilty) - There are more alerts than are being returned from the command.
The SQL Alerts (Top 6) are showing, but the ones below that are not showing up?
If I edit the query:
Get-LogicMonitorAlert -AccessId $accid -AccessKey $seckey -AccountName $acct -Filter 'filter=severity:3,cleared:"false"' -EndDate (Get-Date).AddHours(-1) -VerboseI get the exact same result.
if I edit the query to something like this:
I get the following: (names removed again)
VERBOSE: [VERBOSE] 2022-03-15T11:15:14: Beginning Get-LogicMonitorAlert.
VERBOSE: [VERBOSE] 2022-03-15T11:15:14: Converting/setting start/end date to seconds since epoch.
2022-03-15T11:15:14: Operating in the Default parameter set.
2022-03-15T11:15:14: Filter is: filter=rule:"Error"
2022-03-15T11:15:14: Start date: 10/03/2022 11:15:14 and End date: 15/03/2022 10:15:14
2022-03-15T11:15:14: Start date: 1646910914 and End date: 1647339314
VERBOSE: [VERBOSE] 2022-03-15T11:15:14: Converting special characters to URL encoding.
VERBOSE: [VERBOSE] 2022-03-15T11:15:14: The request loop has run 0 times.
VERBOSE: [VERBOSE] 2022-03-15T11:15:14: Building request header.
VERBOSE: [VERBOSE] 2022-03-15T11:15:14: Executing the REST query.
VERBOSE: GET with 0-byte payload
VERBOSE: received -byte response of content type application/json
VERBOSE: Content encoding: utf-8
VERBOSE: [VERBOSE] 2022-03-15T11:15:14: Executed REST query. There are 9 entries in $alerts.
VERBOSE: [VERBOSE] 2022-03-15T11:15:14: The request loop has run 1 times.
VERBOSE: [VERBOSE] 2022-03-15T11:15:14: Executing the REST query.
VERBOSE: GET with 0-byte payload
VERBOSE: received 75-byte response of content type application/json
VERBOSE: Content encoding: utf-8
VERBOSE: [VERBOSE] 2022-03-15T11:15:16: Executed REST query. There are 9 entries in $alerts.
device, Error, dataSourceAlert, 130.0, > 90 100,
device, Error, dataSourceAlert, 193.0, > 90 100,
device, Error, dataSourceAlert, 95.6898, >= 91 95 98,
device, Error, dataSourceAlert, 1.0, = 1 1,
device, Error, dataSourceAlert, 1.0, = 1 1,
device, Error, dataSourceAlert, 1.0, = 1 1,
device, Error, dataSourceAlert, 1.0, = 1 1,
device, Error, dataSourceAlert, 1.0, = 1 1,
device, Error, dataSourceAlert, 1.0, = 1 1,
So the rule is working but it seems the ones with windows event log errors are missing.
maybe I'm doing something wrong?
Many Thanks