Hi Hayden! :)
Could I please ask a question regarding an issue I am having with down peaks that do not look reduced in IGV.
I have run MAnorm using:
manorm --p1 treatment.narrowPeak --p2 DMSO.narrowPeak --r1 $bam_bed/treatment_bam.bed --r2 $bam_bed/DMSO_bam.bed -w 500 -o ER_LYday7vsDMSO -m 1 -p 0.05 --wa
The ChIPseq data is for the ER transcription factor and the median peak size is around 500.
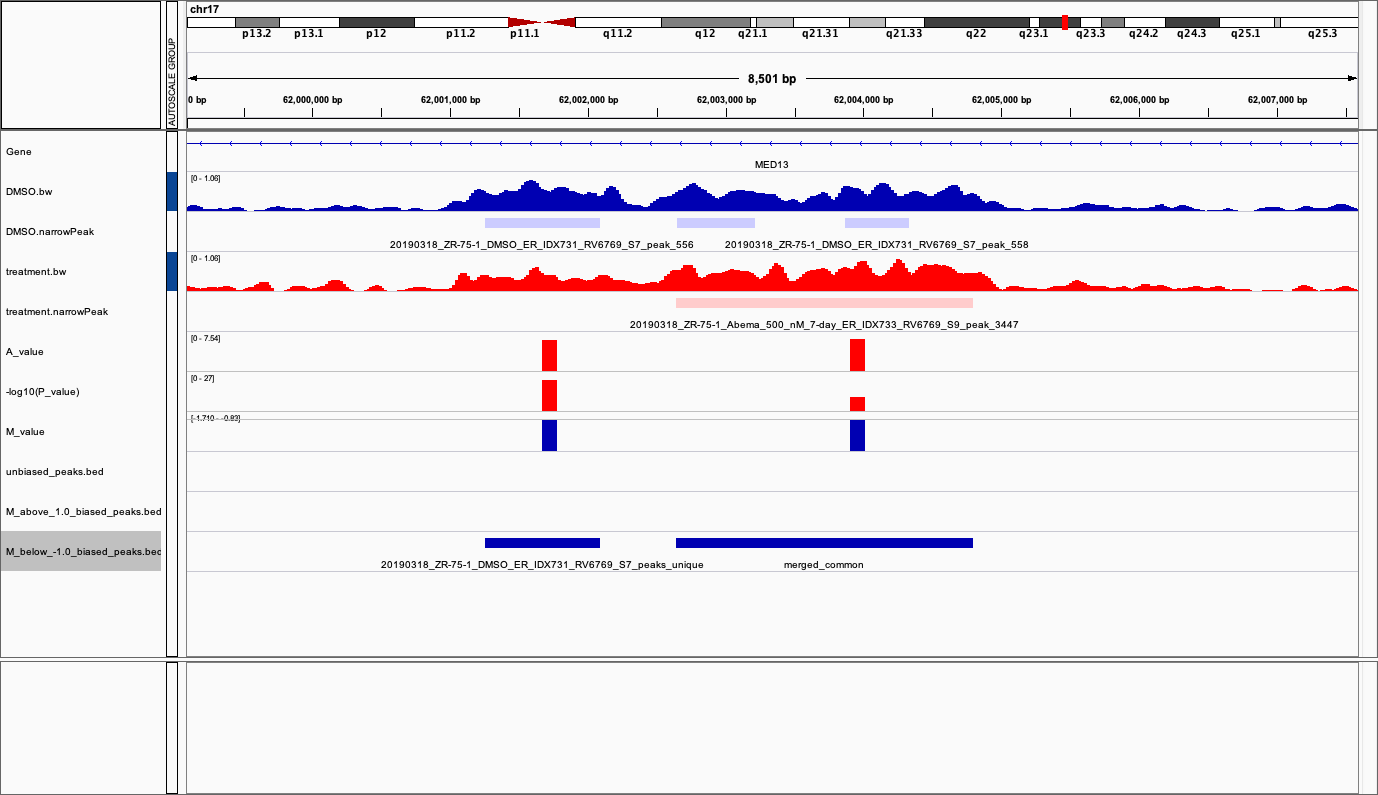
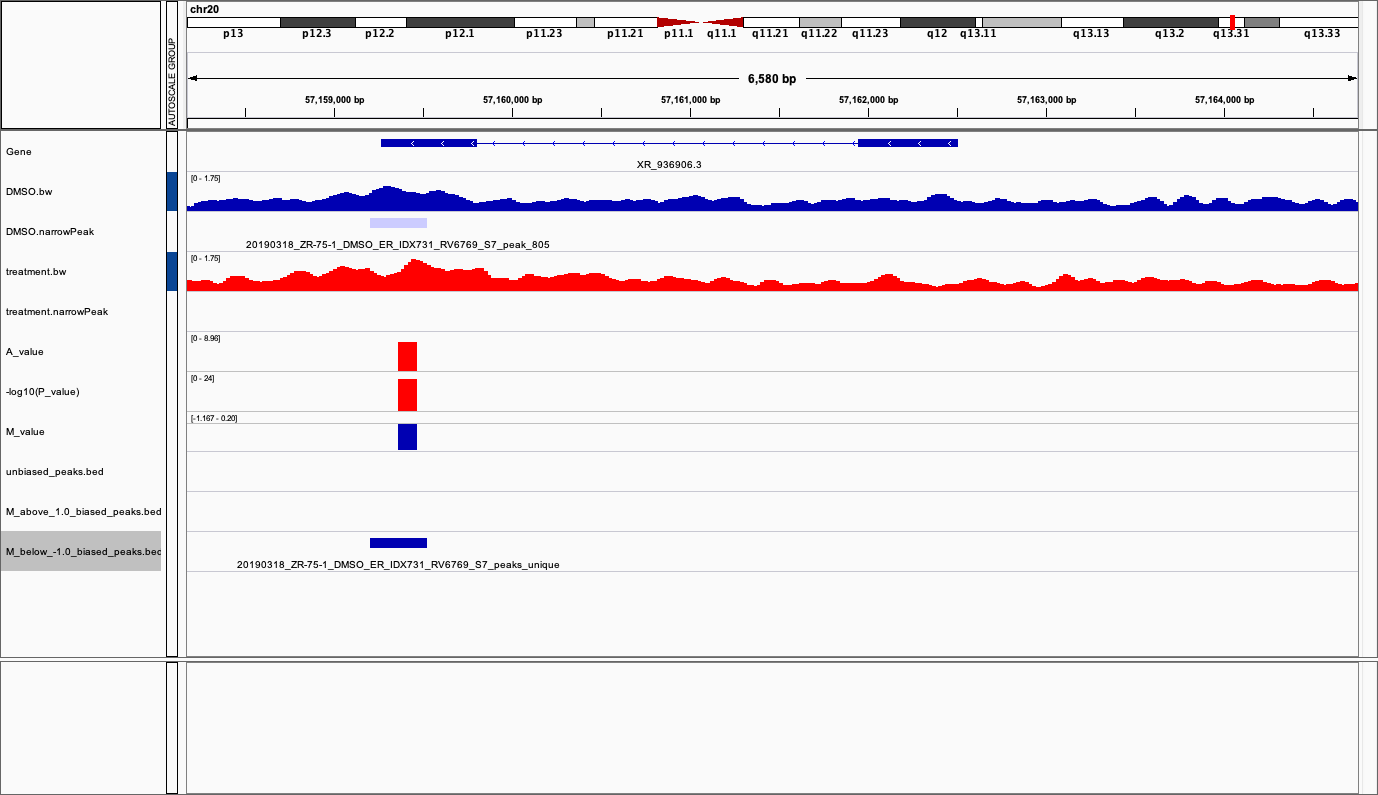
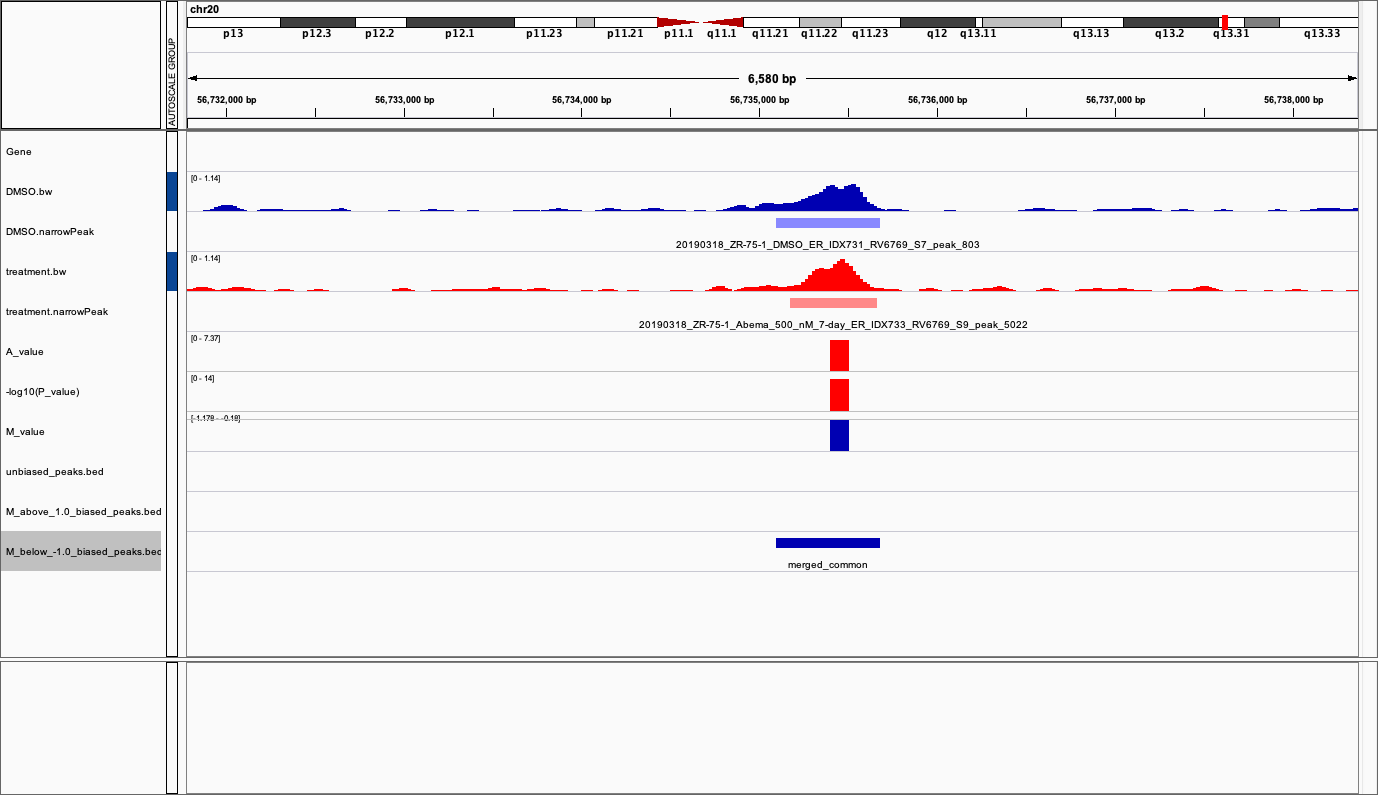
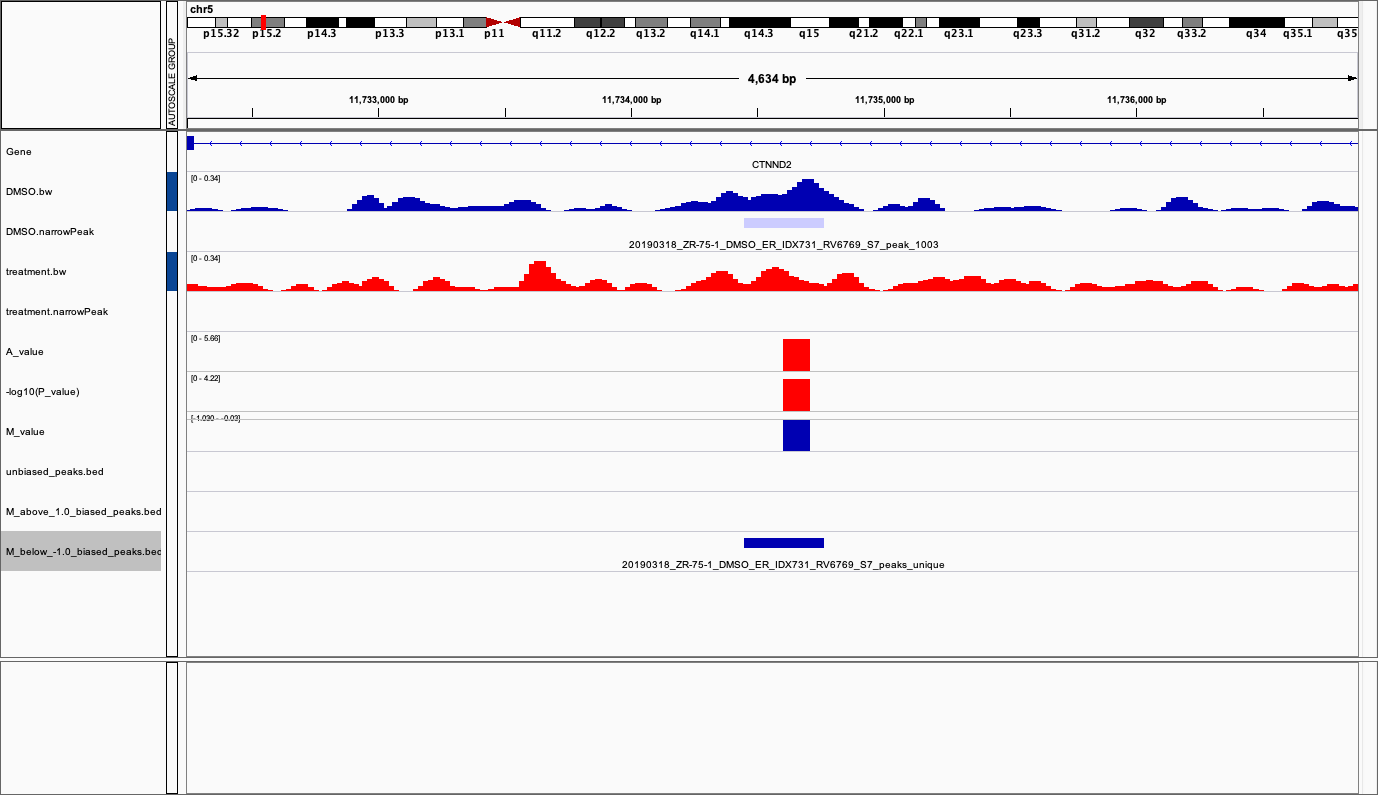
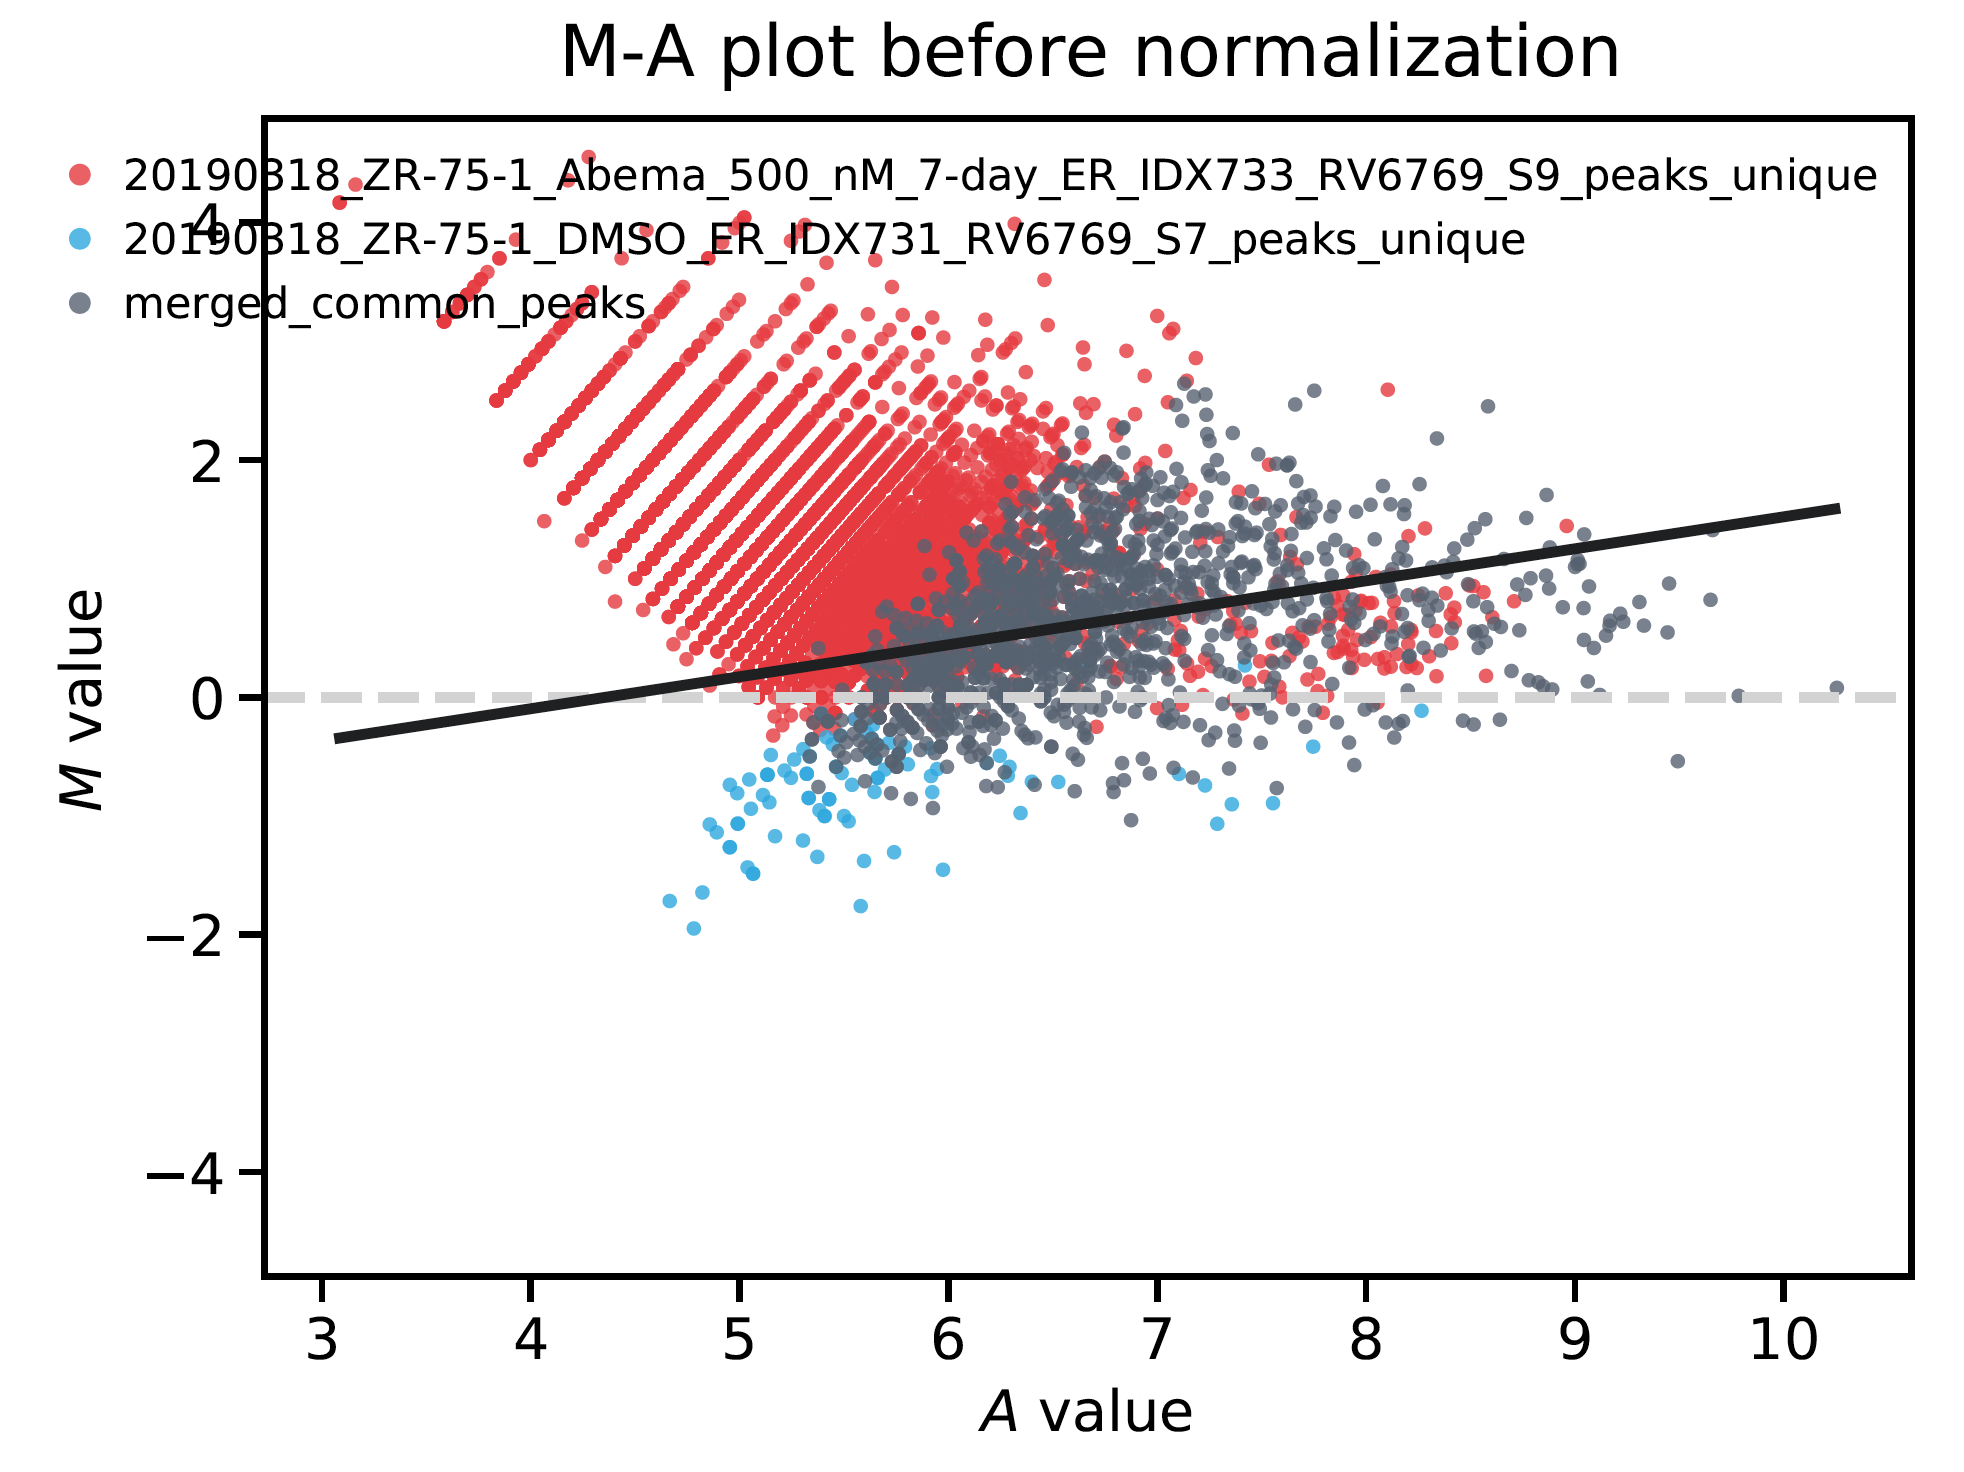
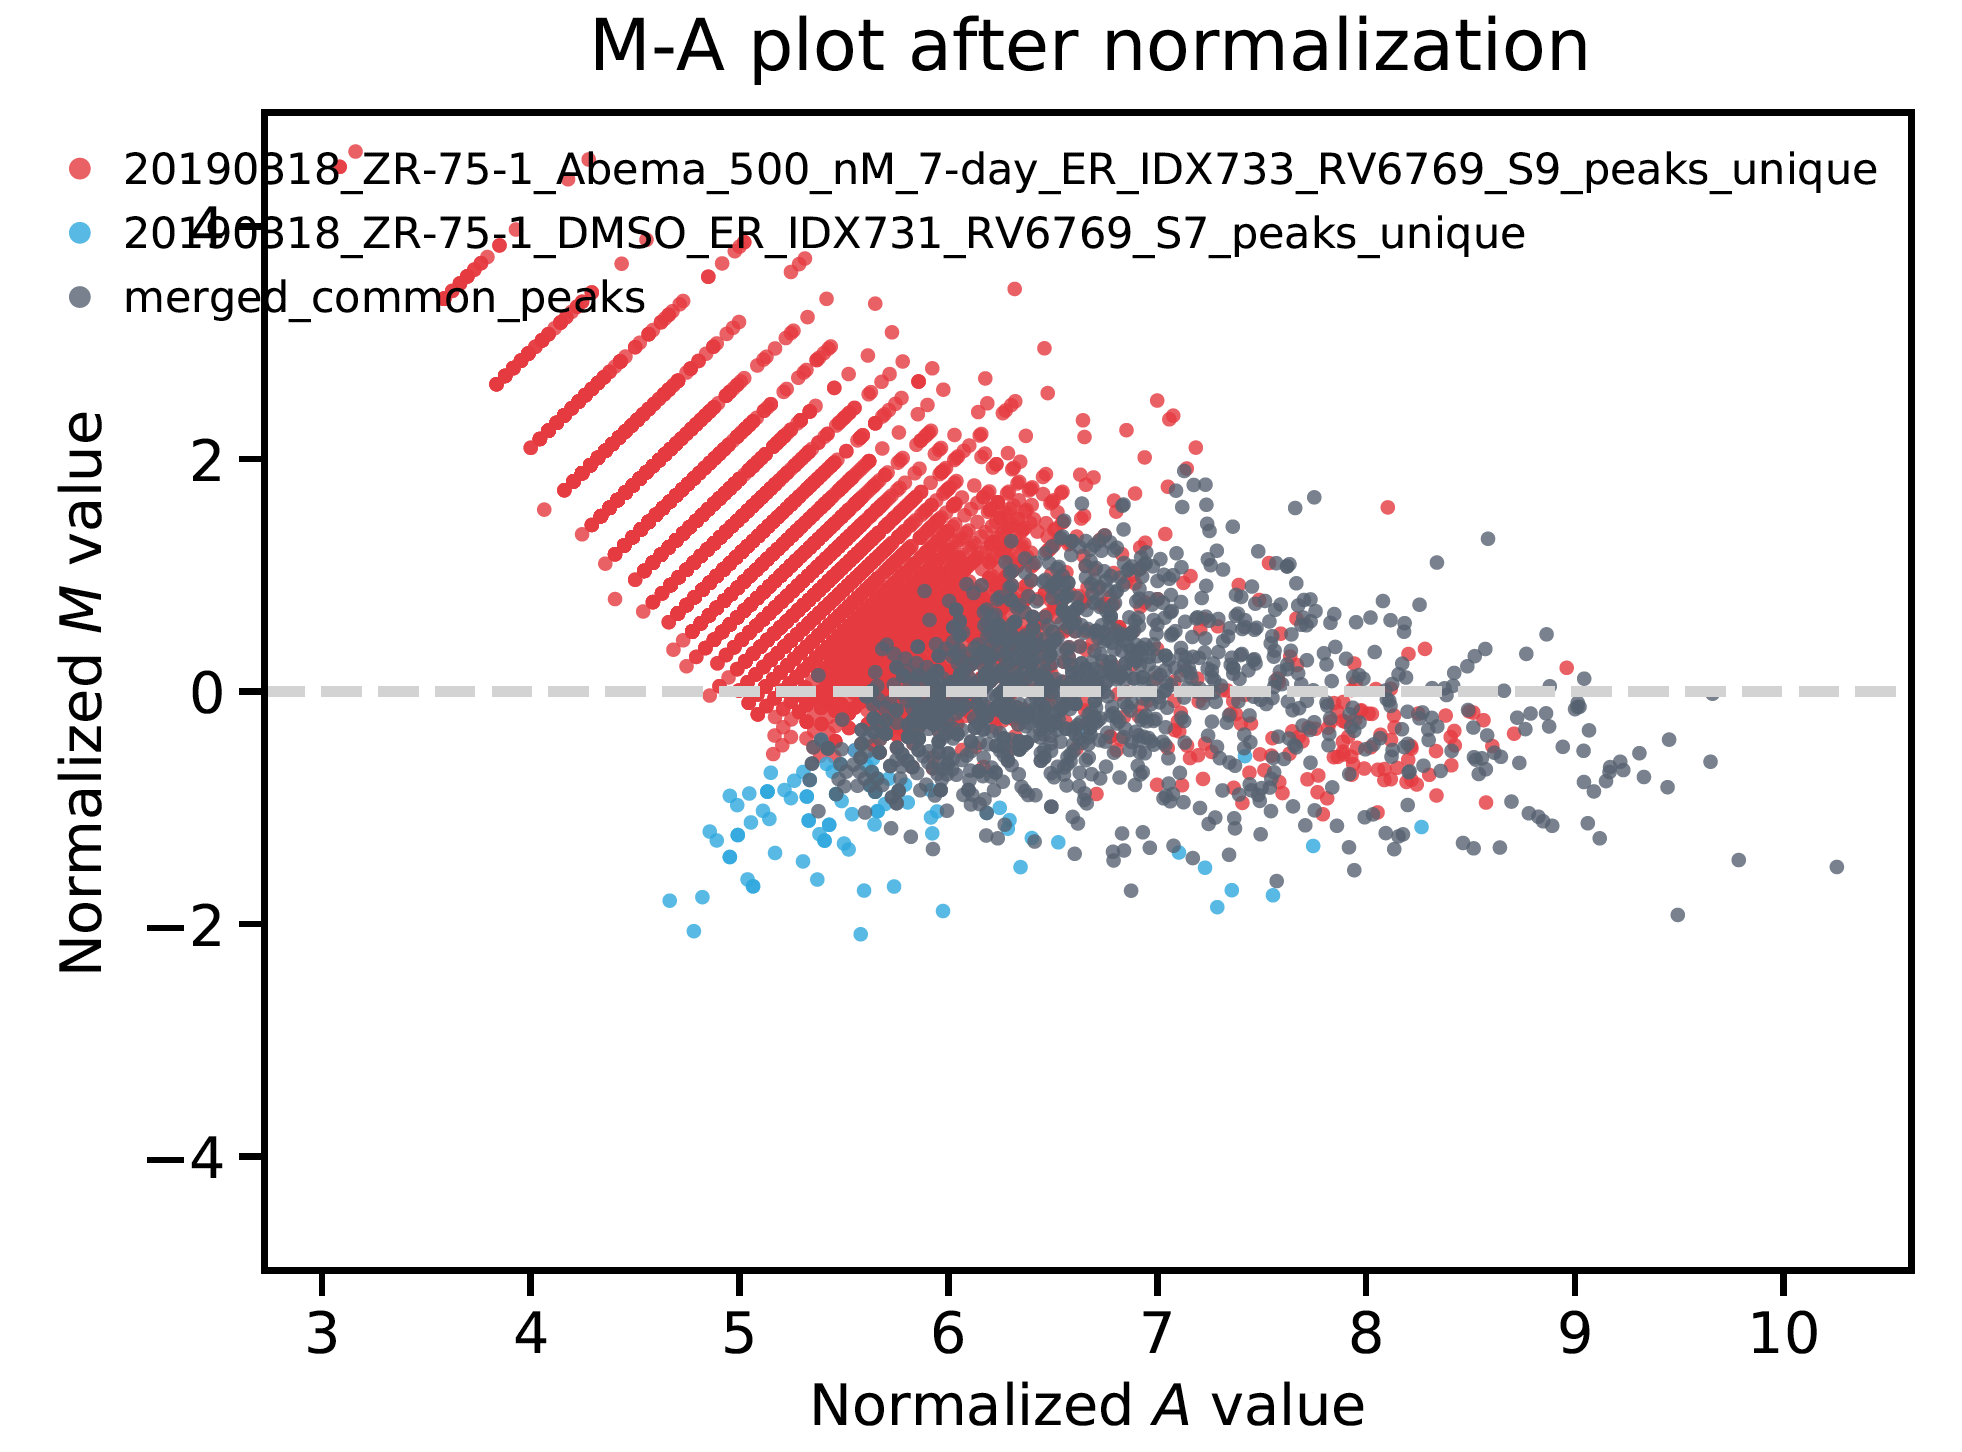
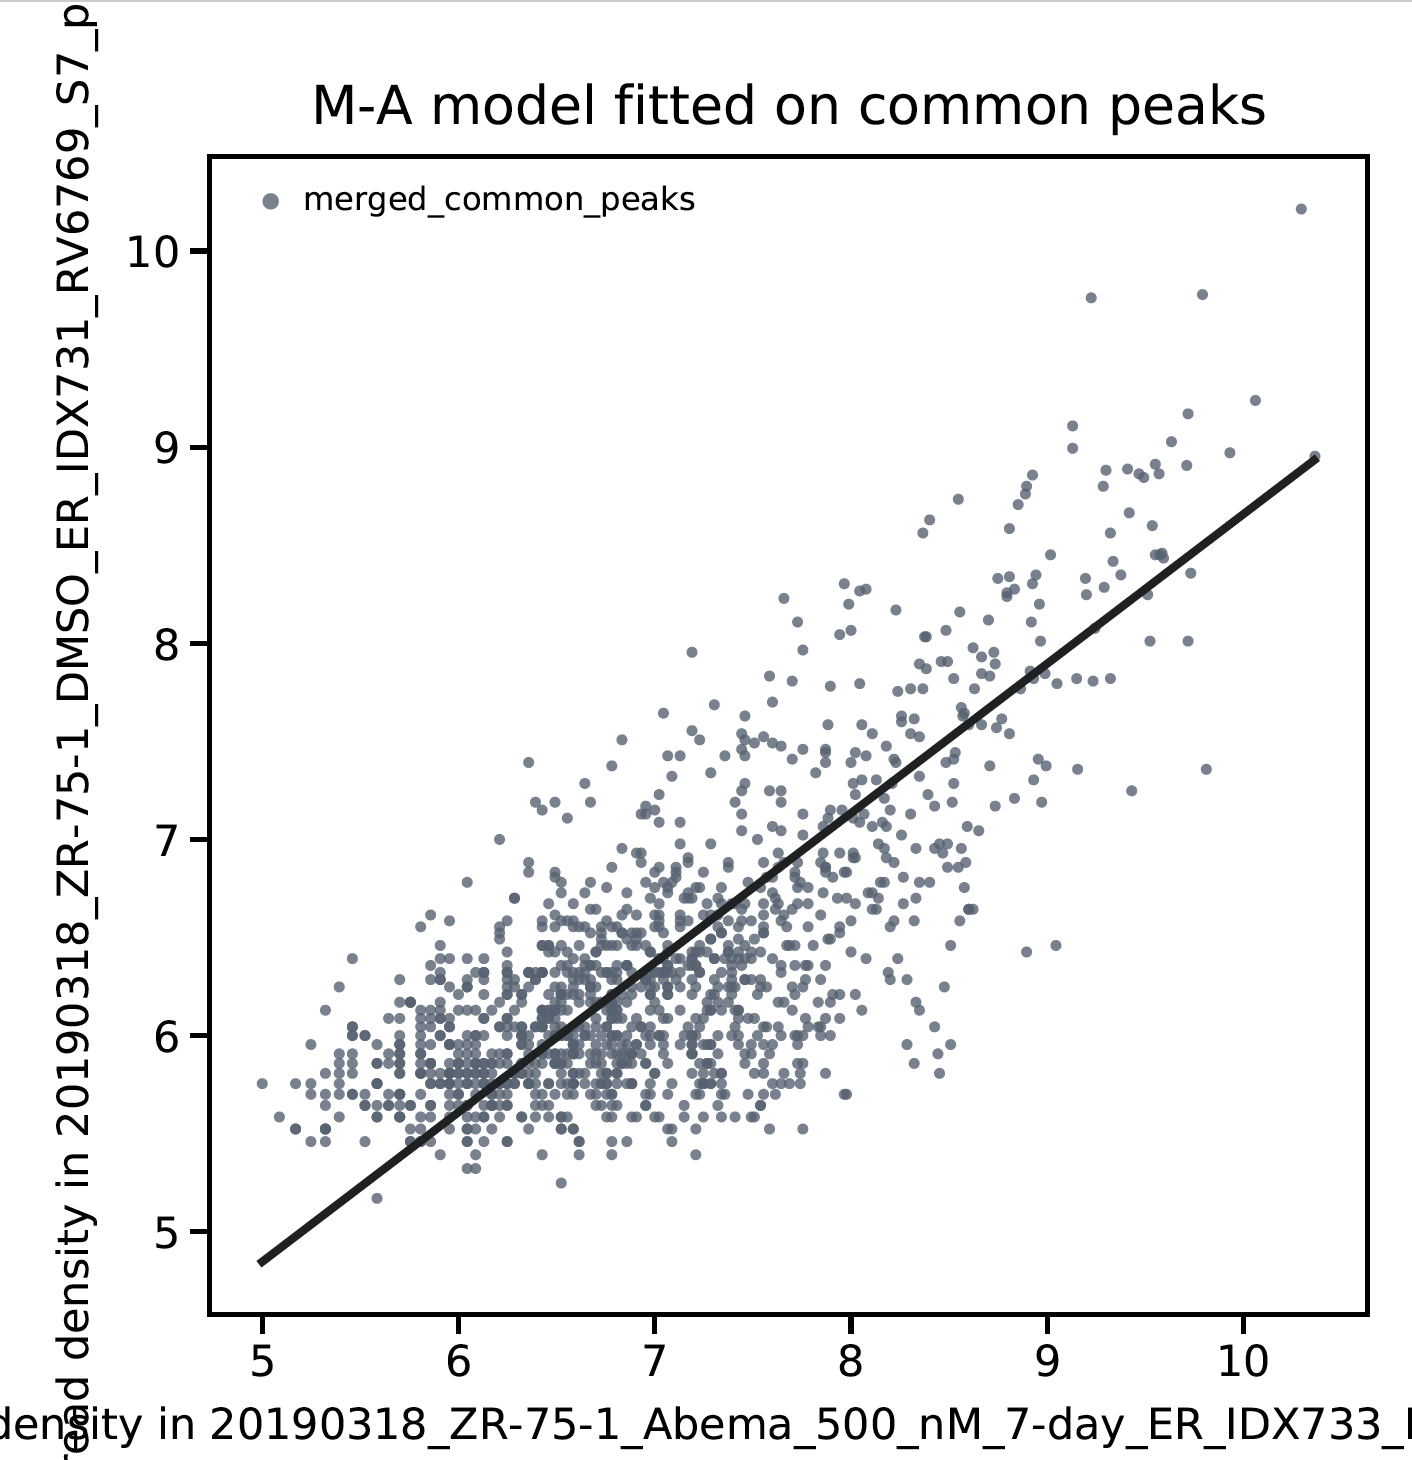
This generates 6851 treatment unique peaks, 91 DMSO unique peaks and 1247 common peaks. The up peaks (M_value > 1) look great on IGV (looks like an obvious increase from DMSO to treatment). However, the down peaks (M_value < -1) do not look real. Would you be able to understand this matter ?
Here are some examples:
Example 1 (M_value = -1.00171)
Example 2 (M_value = -1.16)
Example 3 (M_value = -1.178)
Example 4
(M_value = -1.02662)
Hi Hayden! :)
Could I please ask a question regarding an issue I am having with down peaks that do not look reduced in IGV.
I have run MAnorm using:
manorm --p1 treatment.narrowPeak --p2 DMSO.narrowPeak --r1 $bam_bed/treatment_bam.bed --r2 $bam_bed/DMSO_bam.bed -w 500 -o ER_LYday7vsDMSO -m 1 -p 0.05 --waThe ChIPseq data is for the ER transcription factor and the median peak size is around 500.
This generates 6851 treatment unique peaks, 91 DMSO unique peaks and 1247 common peaks. The up peaks (M_value > 1) look great on IGV (looks like an obvious increase from DMSO to treatment). However, the down peaks (M_value < -1) do not look real. Would you be able to understand this matter ?
Here are some examples:
Example 1 (M_value = -1.00171)




Example 2 (M_value = -1.16)
Example 3 (M_value = -1.178)
Example 4
(M_value = -1.02662)