Congrats for this library!
I'd like to plot the reassigned spectrogram of an audio frequency sweep (from 100hz to 20khz), available for download here as a WAV file.
from scipy.io import wavfile
from tftb.processing import *
import matplotlib.pyplot as plt

sr, x = wavfile.read('test.wav')
x = x[:1000]
s = reassigned_spectrogram(x)
plt.imshow(s[0])
plt.show()
Problem:
-
With a length of 1000 samples only (i.e. only 23ms), it already takes nearly one minute to compute!
So it's nearly impossible to test this reassigned spectrogram on a 10 seconds audio file.
How to improve the performance in this specific case (non-complex real audio signal)?
(Some audio editors are able to plot reassigned spectrograms quickly, such as Izotope RX, see here)
-
Even on the small portion of audio I tested, I couldn't get a nice plot of the reassigned spectrogram. Would you have a code example of plot of a reassigned spectrogram? Thank you in advance!
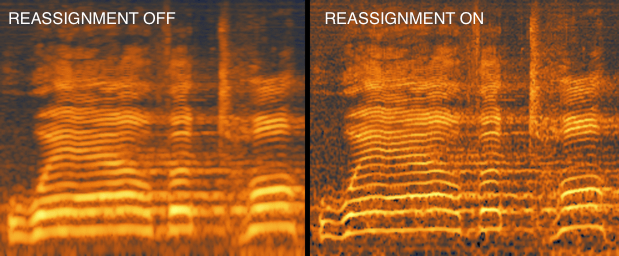
Result that I'm looking for:
Congrats for this library!
I'd like to plot the reassigned spectrogram of an audio frequency sweep (from 100hz to 20khz), available for download here as a WAV file.
Problem:
With a length of 1000 samples only (i.e. only 23ms), it already takes nearly one minute to compute!
So it's nearly impossible to test this reassigned spectrogram on a 10 seconds audio file.
How to improve the performance in this specific case (non-complex real audio signal)?
(Some audio editors are able to plot reassigned spectrograms quickly, such as Izotope RX, see here)
Even on the small portion of audio I tested, I couldn't get a nice plot of the reassigned spectrogram. Would you have a code example of plot of a reassigned spectrogram? Thank you in advance!
Result that I'm looking for: