I think this is enough to show the potential, it takes a bit of refactoring since so much logic goes into tile-handling atm, but we don't have to bother with that in the general case, when using the warper.
What will matter for mapscanner is making sensible choices about the dimension, and the extent - and whether we really have to stick with Mercator (it's hardcoded for now just to stay compatible with assumptions.
Pros: it's quicker, we can use multiple varied providers (some is GDAL-TMS xml, but wmts providers like mapbox also work), lots of tile logic can be forgotten
Con: we aren't getting native imagery, but we can by aligning to the zoom levels (I just stopped short of doing that because not sure it's so important).
I'm still in the middle of some of these things helper wise, but this can simplify what mapscanner is currently doing, I think.
  # bbox <- rbind (c(-96.12923, -96.01011),
#                c(41.26145, 41.32220)) # portion of omaha

library(mapscanner)
library(raster)
#> Loading required package: sp

bbox <- rbind(c(7.58, 7.62),
              c(51.95, 51.97))

## clean extent
buf <- function(ex, e2 = 1000) (ex %/% e2) * e2 + c(0, e2, 0, e2)
ex <- buf(c(slippymath::lonlat_to_merc(t(bbox))))
base <- "WMTS:https://api.mapbox.com/styles/v1/mapbox/%s/wmts?access_token=%s"
mapbox_token <- mapscanner:::get_mapbox_token ()
style <- "light-v10"
query_string <-   sprintf(base, style,  mapbox_token)

# guess dim
dm0 <- max(dev.size("px"))
dm <- as.integer(dm0 * c(1, diff(ex[3:4])/diff(ex[1:2])))

get_and_plot <- function(dsn, extent, dimension) {
  r <- raster(extent(extent), ncols = dimension[1], nrows = dimension[2], crs = "EPSG:3857")
 raster_data <- vapour::vapour_warp_raster(dsn, extent = extent,
                                          dimension = dimension, bands = 1:3,
                                          band_output_type = "integer", resample = "bilinear")
 out <- setValues(brick(r, r, r), do.call(cbind, raster_data))
 plotRGB(out)
  invisible(out)
}

get_and_plot(query_string, ex, dm)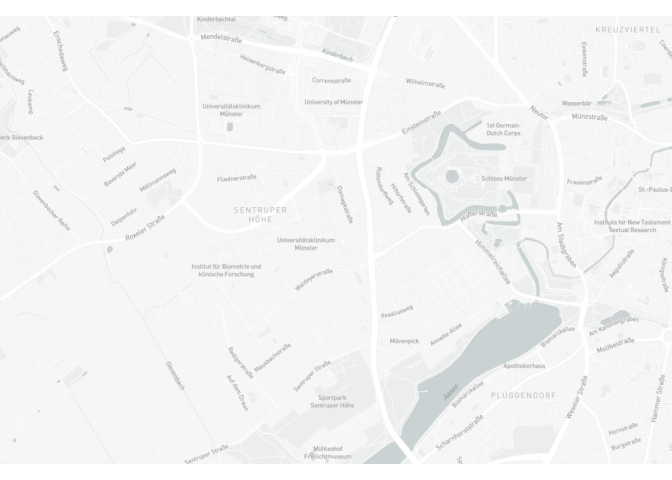
## more options
sources <-  read.csv(url("https://raw.githubusercontent.com/hypertidy/gdalwebsrv/master/inst/bundle/gdalwebsrv.csv"),
           colClasses = c("character", "character"), check.names = FALSE)

 osm <- sources$source[grep("wms_openstreetmap_tms", sources$name)][1]
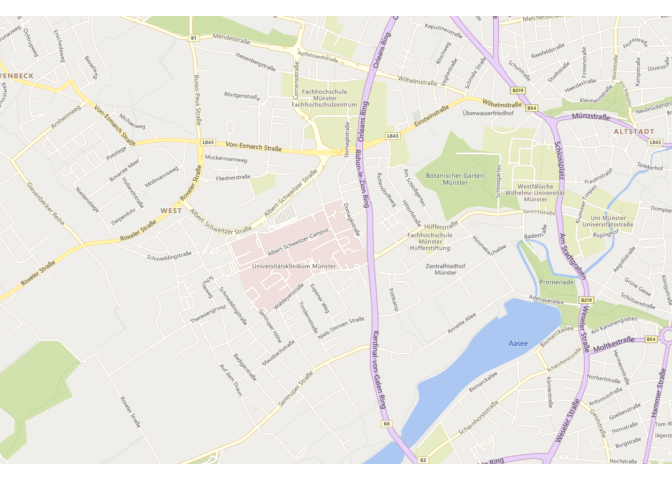
 ve <- sources$source[grep("wms_virtualearth_street", sources$name)][1]
 gh <- sources$source[grep("wms_googlehybrid_tms", sources$name)][1]
 esri <- sources$source[grep("wms_arcgis_mapserver_ESRI.WorldImagery_tms", sources$name)][1]
 get_and_plot(osm, ex, dm)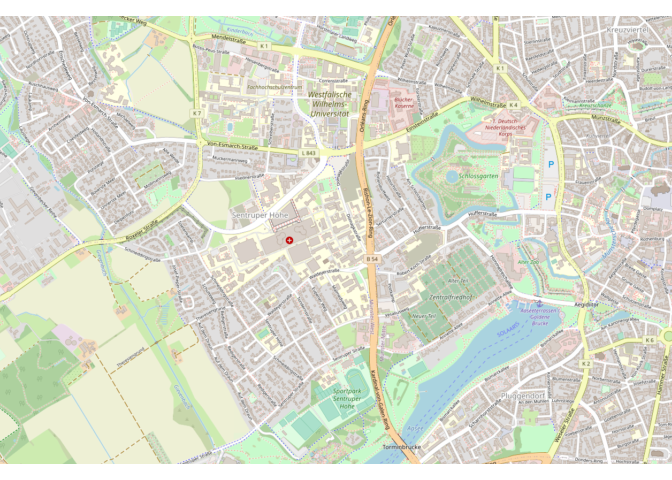
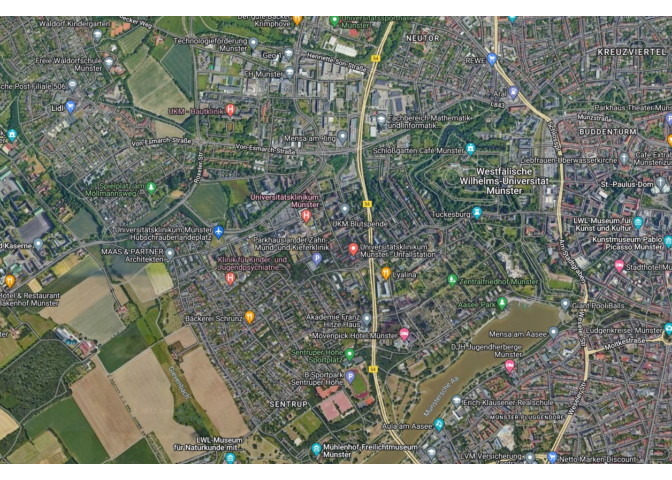
get_and_plot(esri, ex, dm)
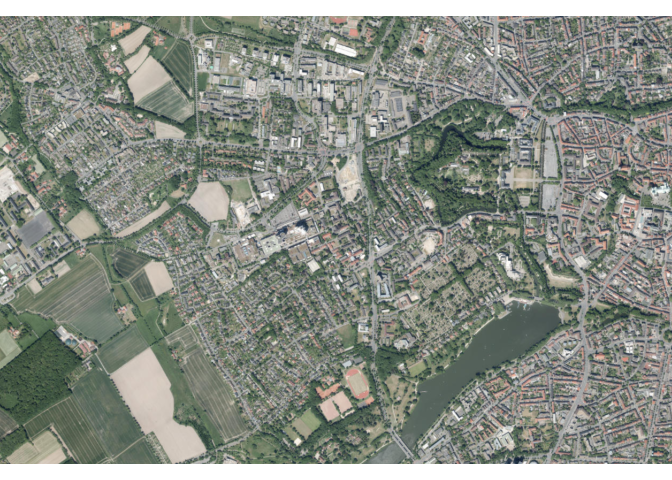
Created on 2022-06-28 by the reprex package (v2.0.1)
I think this is enough to show the potential, it takes a bit of refactoring since so much logic goes into tile-handling atm, but we don't have to bother with that in the general case, when using the warper.
What will matter for mapscanner is making sensible choices about the dimension, and the extent - and whether we really have to stick with Mercator (it's hardcoded for now just to stay compatible with assumptions.
Pros: it's quicker, we can use multiple varied providers (some is GDAL-TMS xml, but wmts providers like mapbox also work), lots of tile logic can be forgotten
Con: we aren't getting native imagery, but we can by aligning to the zoom levels (I just stopped short of doing that because not sure it's so important).
I'm still in the middle of some of these things helper wise, but this can simplify what mapscanner is currently doing, I think.
Created on 2022-06-28 by the reprex package (v2.0.1)