Hi Egil,
Thanks so much for creating the examples repo, this is super helpful!
One thing caught my attention in your data_pipeline_template notebook: the plot of predicted vs. actual TTE looks like the prediction is inverted (this is after your "Individual sequences" cell):
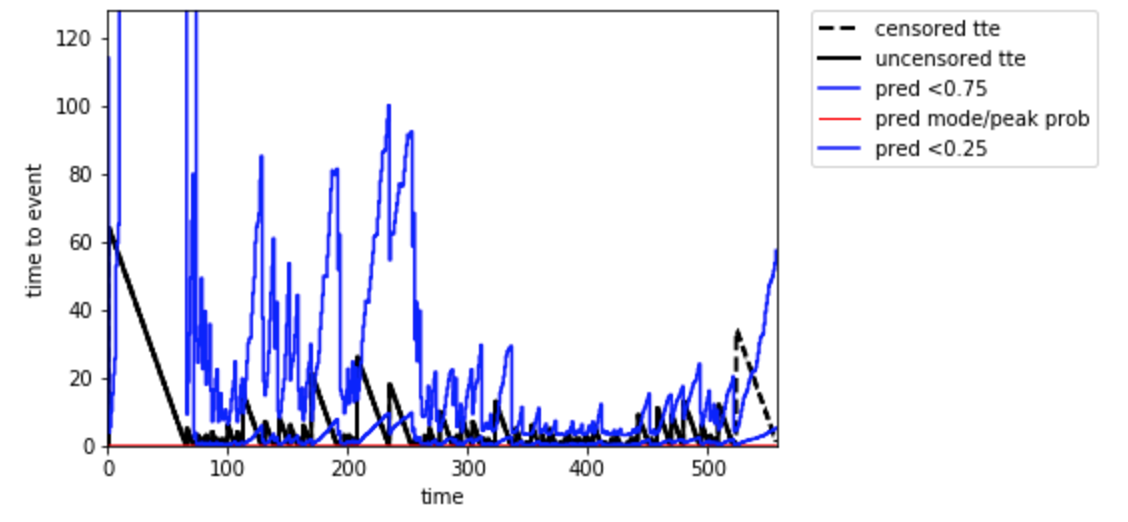
This doesn't happen for synthetic data, but it does seem to be a feature for irregularly sampled data. Do you know if it's because the initial alpha is not optimal, or for some other reason?
Thanks very much!
Natalia
Hi Egil,
Thanks so much for creating the examples repo, this is super helpful!
One thing caught my attention in your data_pipeline_template notebook: the plot of predicted vs. actual TTE looks like the prediction is inverted (this is after your "Individual sequences" cell):
This doesn't happen for synthetic data, but it does seem to be a feature for irregularly sampled data. Do you know if it's because the initial alpha is not optimal, or for some other reason?
Thanks very much!
Natalia