%matplotlib inline
import matplotlib.pyplot as plt
import epl.geometry
import cartopy
import requests

# grab the GBR county outline from a geojson hosted on github
r = requests.get("https://raw.githubusercontent.com/johan/world.geo.json/master/countries/GBR.geo.json")
gbr_shape = epl.geometry.shape(r.json()['features'][0]['geometry'], wkid=4326)

# Lets load up the Albers Equal Area projection.
lonlat_crs = cartopy.crs.PlateCarree()
albers = cartopy.crs.AlbersEqualArea(central_longitude=gbr_shape.centroid.x, central_latitude=gbr_shape.centroid.y)

fig = plt.figure(figsize=(4, 8))
ax = plt.subplot(projection=albers) # Specify projection of the map here

buffered_gbr = gbr_shape.buffer(-40000)

ax.add_geometries([gbr_shape.carto_geom], lonlat_crs, alpha=0.3, color='blue')
ax.add_geometries([buffered_gbr.carto_geom], lonlat_crs, alpha=0.3, color='green')

ax.set_extent(gbr_shape.carto_bounds, crs=lonlat_crs)
ax.gridlines(crs=lonlat_crs)
plt.show()
results in a trailing vertex
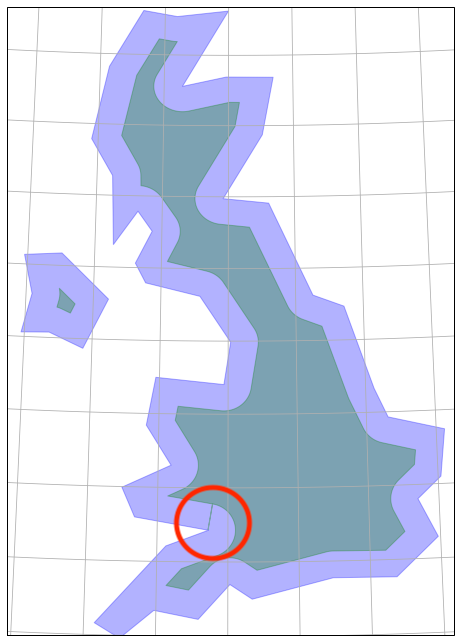
results in a trailing vertex