A ready-made Grafana dashboard for a self-hosted PDS, covering both host health (CPU, memory, disk, network) and PDS activity (accounts, sessions, OAuth grants, XRPC request rate and latency).
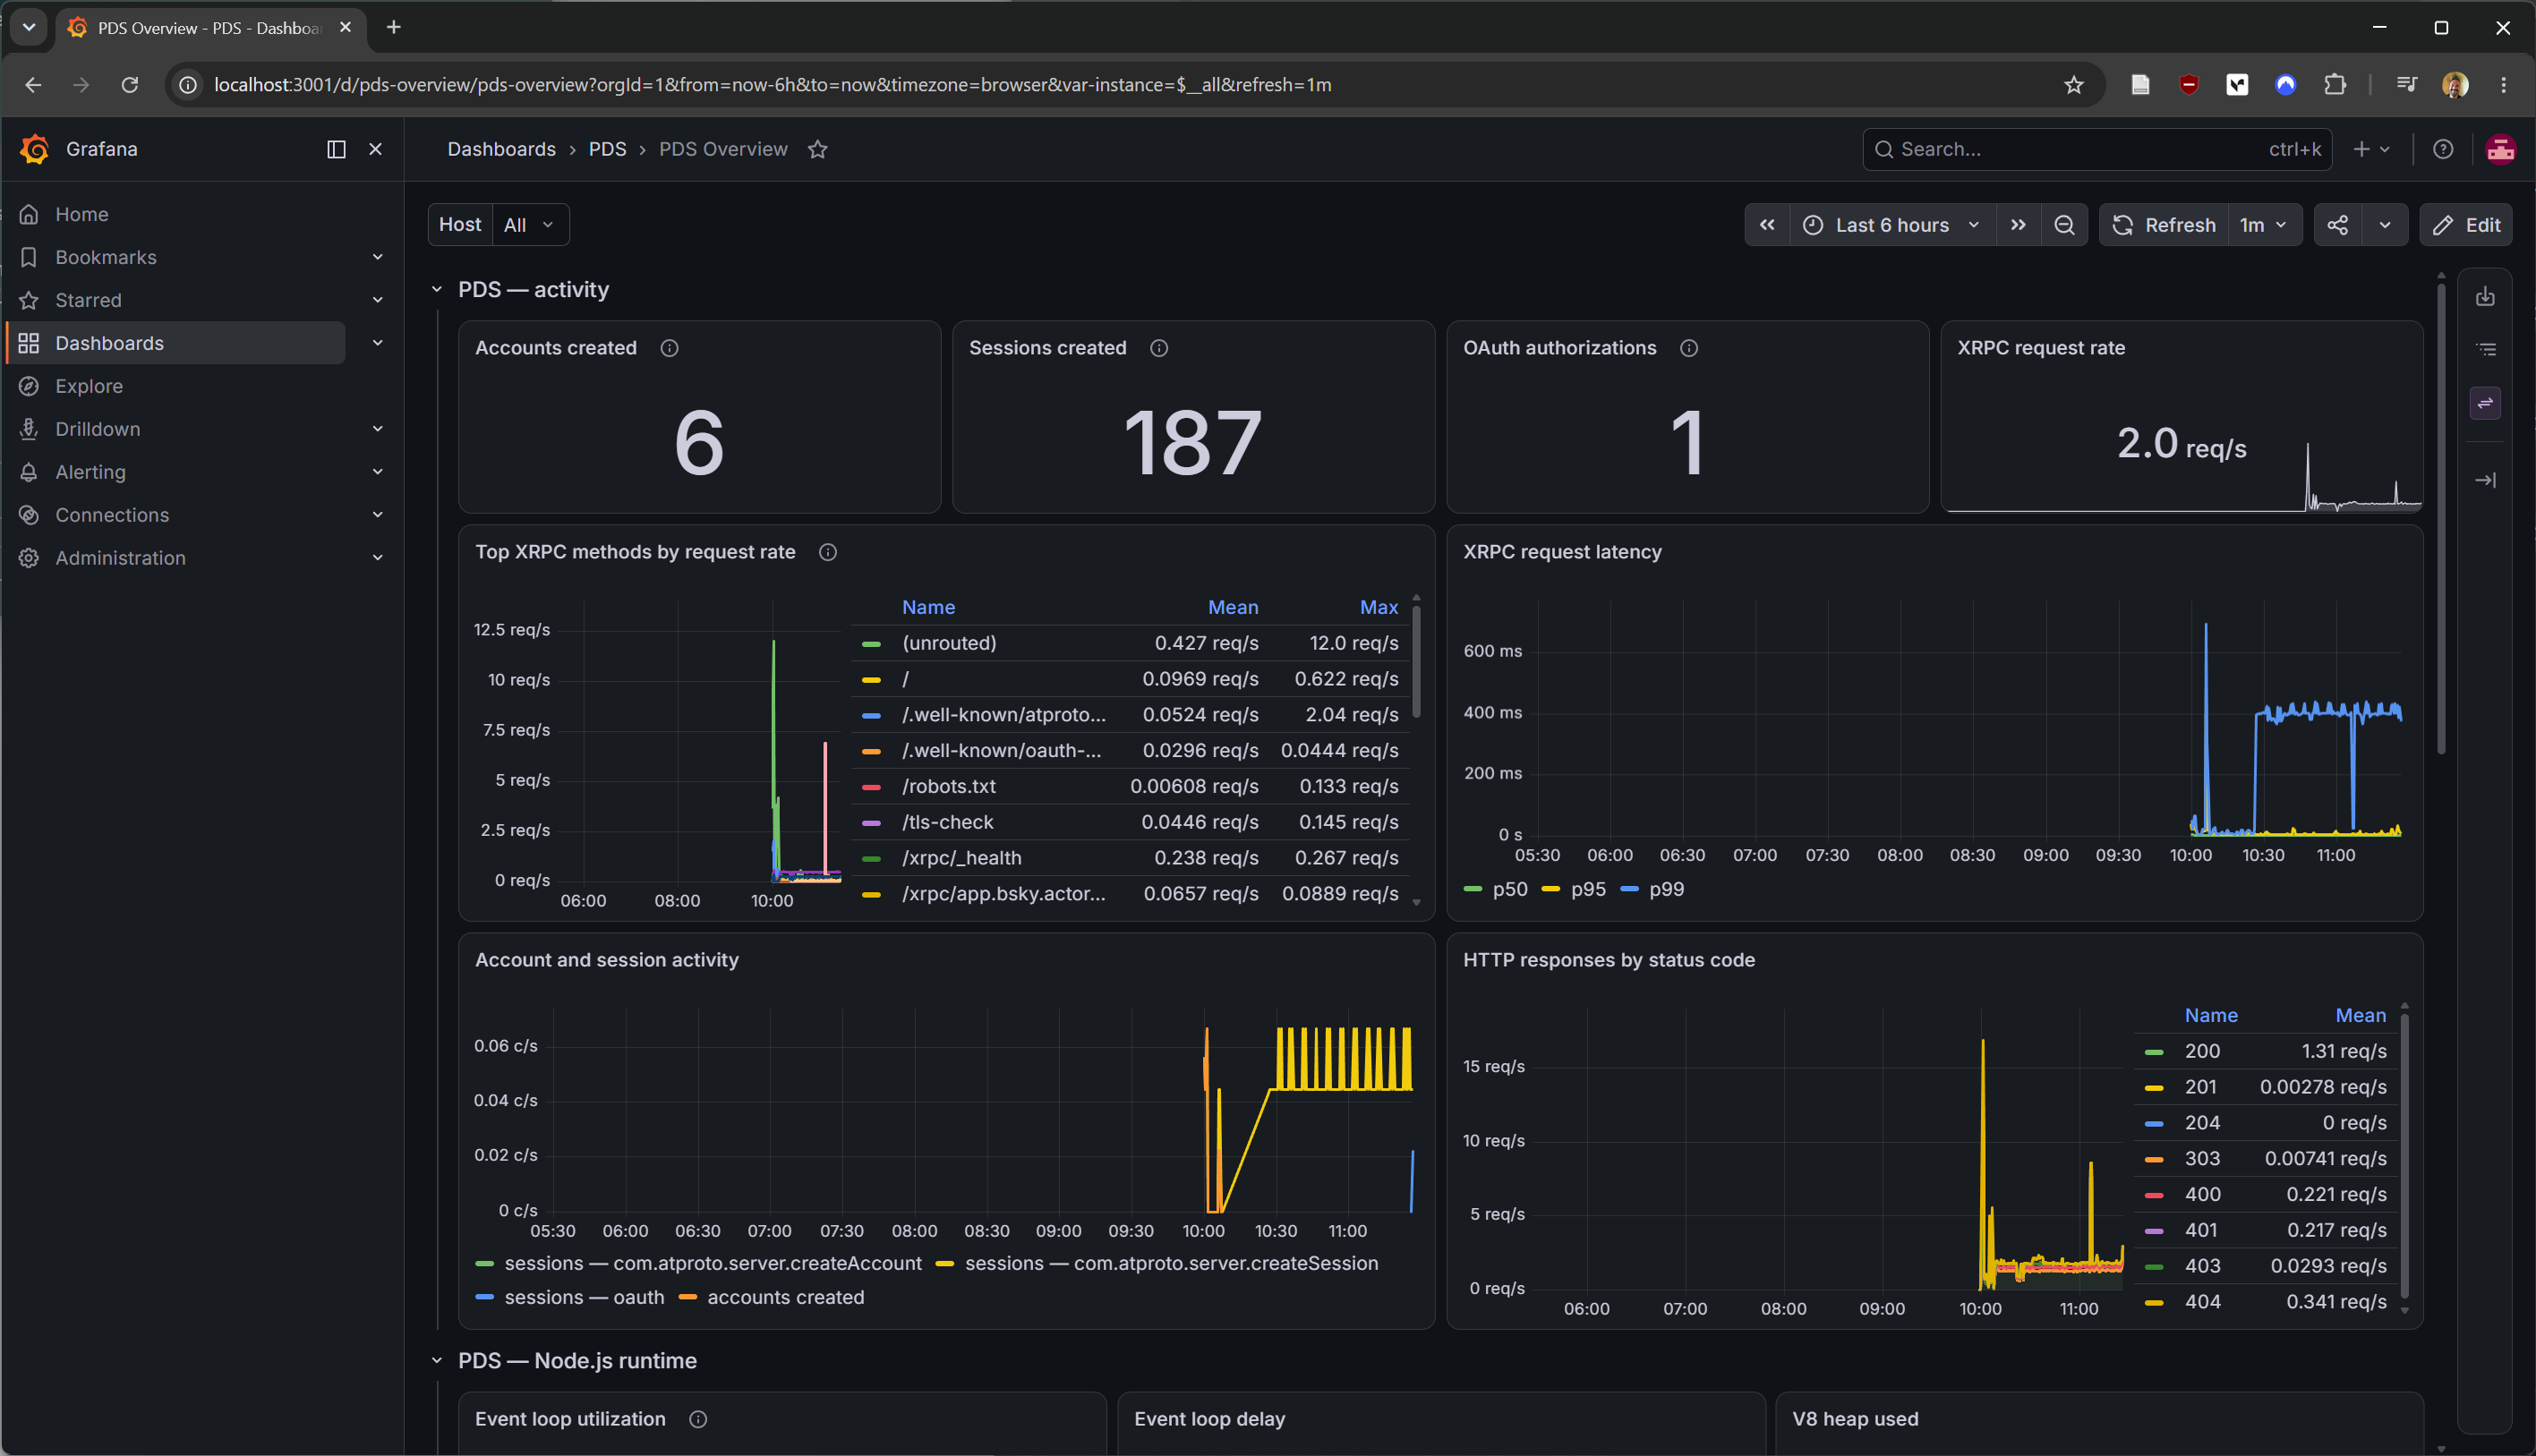
This is entirely optional and completely separate from the main PDS stack. It
does not modify /pds/compose.yaml and is not touched by pdsadmin update.
Telemetry support was added in @atproto/pds 0.5.26, and your PDS image has to
be new enough to include it. Check this before you change anything: if you
enable telemetry against an older image, the PDS does not start at all. It exits
with ERR_PACKAGE_PATH_NOT_EXPORTED and then crash-loops.
Supported images have a label:
docker image inspect ghcr.io/bluesky-social/pds:0.4 \
  --format '{{index .Config.Labels "social.bsky.pds.telemetry"}}'
That prints otel on a supported image.
The PDS speaks OpenTelemetry. It pushes metrics
over OTLP rather than exposing a /metrics endpoint to be scraped.
Prometheus v3 can receive OTLP directly, so this stack is just three containers with no OpenTelemetry Collector in between.
Grab this directory and start the stack:
curl -sL https://github.com/bluesky-social/pds/archive/refs/heads/main.tar.gz \
  | tar xz --strip-components=1 pds-main/monitoring
cd monitoring && docker compose up --detach
Then load the OpenTelemetry SDK and tell the PDS where to send metrics. Add to
/pds/pds.env:
NODE_OPTIONS=--import=@atproto/pds/telemetry
OTEL_SERVICE_NAME=pds
OTEL_EXPORTER_OTLP_METRICS_ENDPOINT=http://localhost:9090/api/v1/otlp/v1/metrics
OTEL_EXPORTER_OTLP_METRICS_PROTOCOL=http/protobuf
OTEL_METRIC_EXPORT_INTERVAL=15000
OTEL_SEMCONV_STABILITY_OPT_IN=http
OTEL_NODE_RESOURCE_DETECTORS=env,host,os,process,serviceinstance,container
and restart:
sudo systemctl restart pdsSome notes on those variables:
NODE_OPTIONS=--import=@atproto/pds/telemetryloads the telemetry SDK, and is required for a monitoring config. If you already setNODE_OPTIONSfor something else, append to it rather than replacing it.- Setting only
OTEL_EXPORTER_OTLP_METRICS_ENDPOINTrather than the genericOTEL_EXPORTER_OTLP_ENDPOINTis intentional. The PDS enables exactly the OTel signals you configure, so this enables metrics and leaves traces and logs disabled. For traces and logs, see Going further. OTEL_SEMCONV_STABILITY_OPT_IN=httpopts into the stable HTTP semantic conventions, and the dashboard is built against those names.OTEL_NODE_RESOURCE_DETECTORSis not strictly required, but the default detector set includes AWS, GCP and Azure detectors that probe cloud metadata services at startup. On a plain VPS those attempts fail, and the GCP one logs aMetadataLookupWarningevery time the PDS boots. The list above keeps the detectors that produce something useful and drops the cloud ones.
Everything binds to 127.0.0.1 and none of it is exposed to the internet by default. Do
not open these ports on your cloud firewall. Use an SSH tunnel:
ssh -L 3001:localhost:3001 you@your-pds-hostThen open http://localhost:3001 and log in with admin / admin. Grafana
will ask you to change the password on first login.
Grafana runs on 3001 because the PDS itself owns port 3000.
The PDS Overview dashboard is provisioned automatically, in a folder named
PDS. It is read-only; to customize it, use "Save as" to make your own copy, or
edit dashboards/pds-overview.json and restart Grafana.
The PDS reports five business events. Three of them are backed by counters and show up as metrics; two are only emitted as log records, and so are not on this dashboard:
| Event | Metric | When it fires |
|---|---|---|
account.created |
account_created_total |
createAccount, and OAuth sign-up |
session.created |
session_created_total |
createAccount, createSession, and OAuth sign-in |
oauth.authorization |
oauth_authorization_total |
an OAuth authorization is granted |
account.signed-in |
none — log record only | OAuth sign-in only (not password createSession) |
session.refreshed |
none — log record only | refreshSession, and OAuth token refresh |
The counters have only low-cardinality attributes: source on the account and
session counters, clientFirstParty on the OAuth one. Per-account detail such
as did and clientId is deliberately kept out of the metrics and appears only
in the log records.
In this case you don't need compose.yaml.
1. Point the PDS at your metrics backend. Set the variables above in
/pds/pds.env, with OTEL_EXPORTER_OTLP_METRICS_ENDPOINT pointed at your own
OTLP endpoint. If your Prometheus runs elsewhere, enable its OTLP receiver
(--web.enable-otlp-receiver) and use
http://your-prometheus:9090/api/v1/otlp/v1/metrics. If you run an
OpenTelemetry Collector, send to that instead.
2. Import the dashboard. In Grafana, Dashboards → New → Import → Upload
JSON file, and pick dashboards/pds-overview.json. It expects a Prometheus
data source; select yours when prompted.
For host metrics, you presumably already run node_exporter. If not, you can start just that one service from this directory:
docker compose up --detach node-exporterand add a scrape job to your own Prometheus:
scrape_configs:
  - job_name: pds-node
    static_configs:
      - targets: ['your-pds-host:9100']
Note that compose.yaml binds node_exporter to 127.0.0.1, so a Prometheus on
another machine cannot reach it as-is. Either scrape it over an SSH tunnel or a
private network, or change --web.listen-address, but if you make it listen on
a public interface, firewall it. node_exporter has no authentication.
Prometheus keeps 15 days by default (--storage.tsdb.retention.time in
compose.yaml) and stores data in a Docker volume, not under /pds. For a
single PDS this is a small amount of data, but note that it shares the host's
disk with your repos and blobs, and that a /pds backup will not include it.
If every PDS-related panel is empty while the host CPU/disk metrics work, the SDK is not loaded:
check that NODE_OPTIONS=--import=@atproto/pds/telemetry is really in
/pds/pds.env and that the PDS was restarted after you added it.
docker exec pds printenv NODE_OPTIONSMetric names come from the OpenTelemetry instrumentation and are translated by
Prometheus's OTLP receiver (dots become underscores, and type and unit suffixes
are appended; account.created becomes account_created_total). Names can
change as the instrumentation libraries are upgraded.
To see what your PDS is actually reporting:
curl -s localhost:9090/api/v1/label/__name__/values | tr ',' '\n' | grep -Ei 'account|session|oauth|http_server|nodejs|v8js'If you see http_server_duration_milliseconds_* rather than
http_server_request_duration_seconds_*, you are missing
OTEL_SEMCONV_STABILITY_OPT_IN=http.
Counters only exist once they have been incremented at least once, so a fresh
PDS legitimately has no account_created_total until somebody signs up.
If a name differs from what a panel queries, edit the panel's query, or open an issue so the dashboard can be fixed.
If you want sign-ins and session refreshes, or traces, Prometheus alone isn't enough, as it cannot receive either signal. You need something in front that can route each signal to a different backend: an OpenTelemetry Collector (or Grafana Alloy). With one in place you can point the PDS at a single endpoint and let the collector route each signal:
OTEL_EXPORTER_OTLP_ENDPOINT=http://localhost:4318The PDS deliberately does
not ship its pino request logs over OTLP. It emits only the five
events above, through the Logs API. Those records use the OTLP event_name
field (account.signed-in, session.refreshed, and so on) with the event detail
in attributes, and they are trace-correlated when traces are also enabled.
From there you have two options. To chart sign-ins and refreshes alongside the existing panels, have the collector turn those log records into counters with the count connector, matching on the record's event name, and export the result to Prometheus. To explore them as logs instead, send them to Loki and add it as a second Grafana data source; traces work the same way with Tempo.