Status: v2, 2026-07-28 — automatic collection, standalone extension.
Implemented in crates/timeless-ext/src/health_vtab.rs; the standalone
loadable extension is crates/dbhealth-ext → libdbhealth_ext.so
(cargo build -p dbhealth-ext --release). Tests: tests/dbhealth.sh.
.load ./libdbhealth_ext

CREATE VIRTUAL TABLE dbhealth USING dbhealth;
-- that's it: collection has begun.

SELECT * FROM dbhealth_report;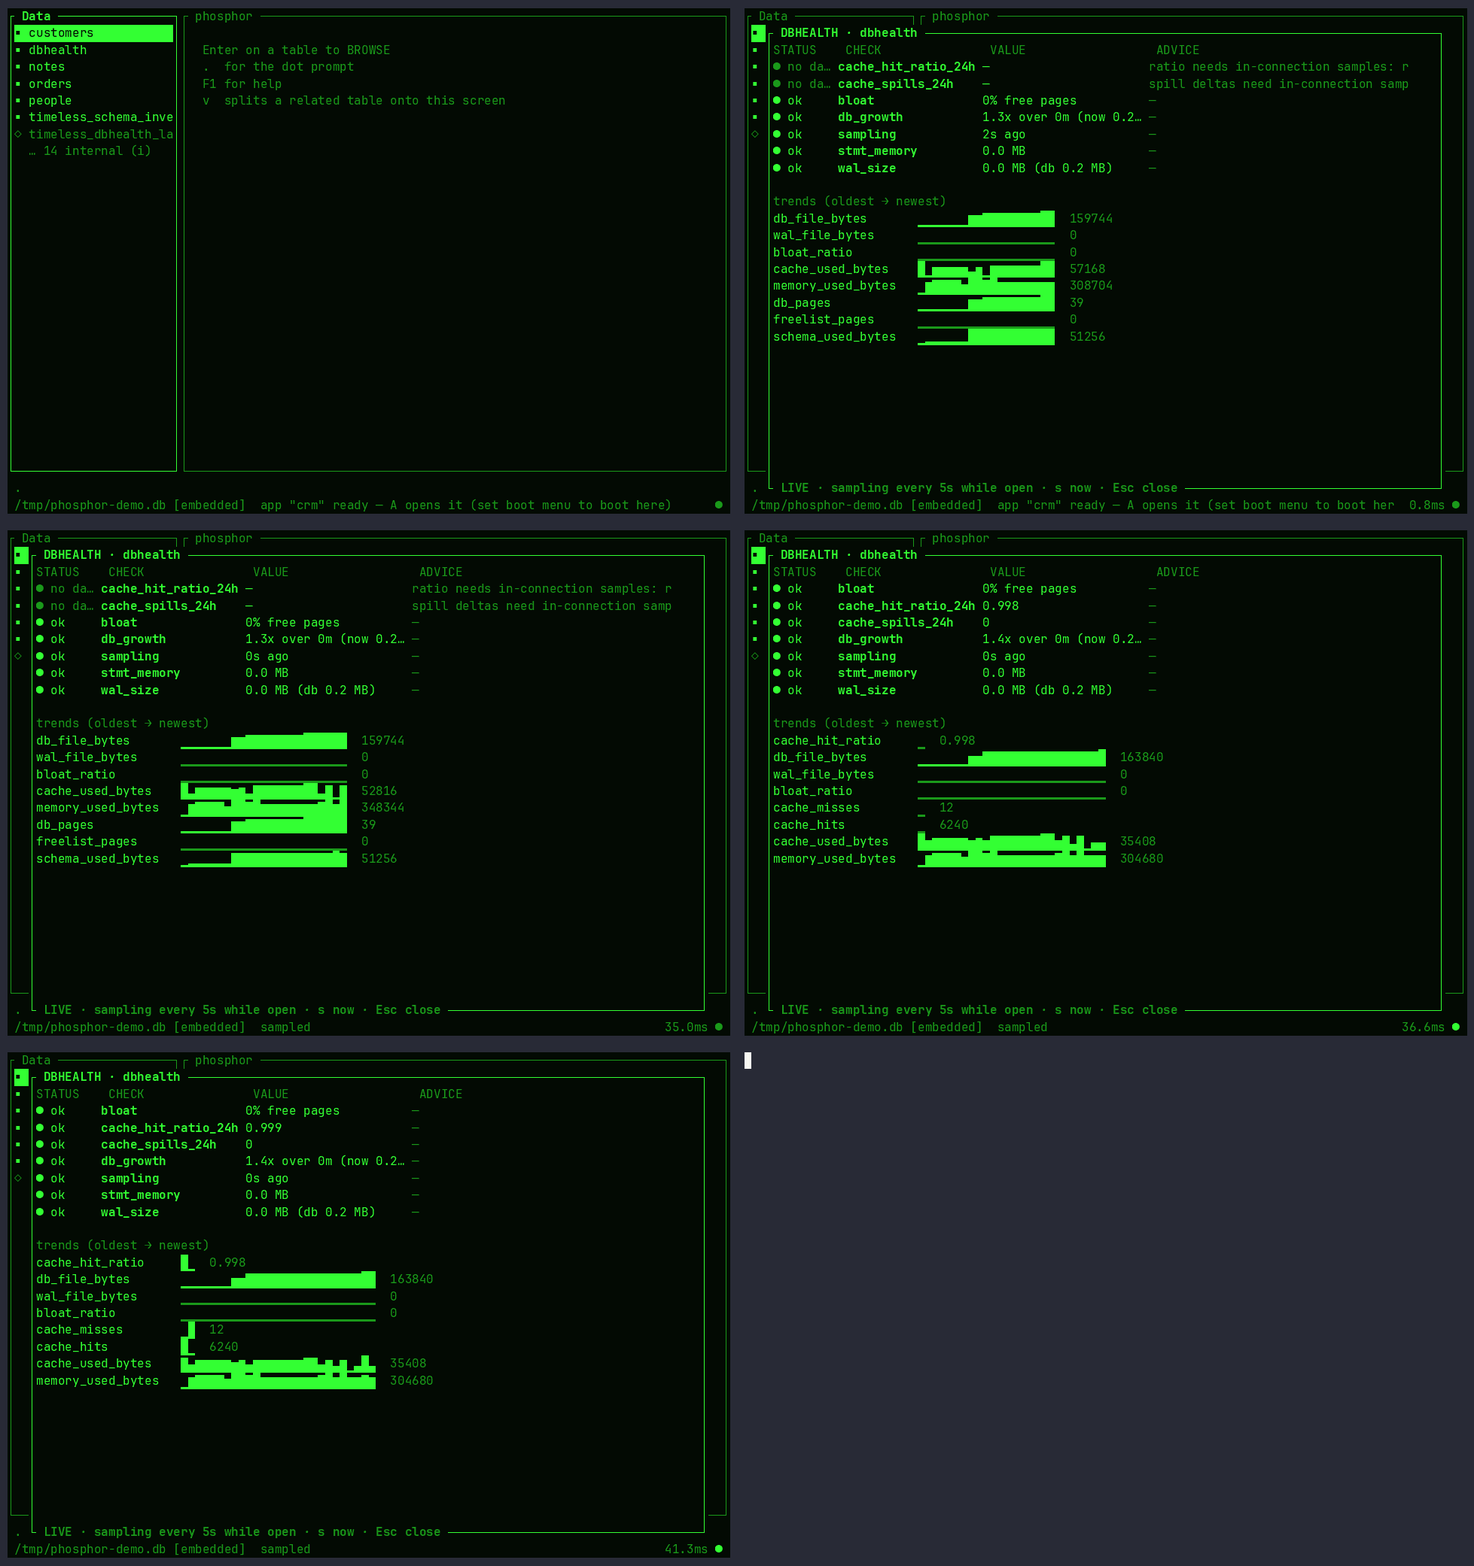
v2 changes (2026-07-28), after real-user feedback:
- Collection is automatic. Creating a dbhealth table — or simply
re-opening a database that has one — starts a background sampler for
that (file, table): its own connection, first sample ~2 seconds after
open, then every
every=Nseconds (default 60;every=0restores the old passive behavior). The thread stops when the last connection closes, when the table is dropped, or after repeated failures. In-memory/temp databases have no file for a second connection, so they remain command-driven. "If someone loads the dbhealth extension they absolutely expect collection to begin" — correct, and now true. - dbhealth is its own extension.
libdbhealth_ext.soregisters thedbhealthmodule (aliastimeless_healthfor existing tables) and nothing else — monitoring without the telemetry modules. It shares the compressed-metrics engine with timeless-libsql at the source level (thetimeless-extcrate is now also an rlib), not at load time. Loadlibtimeless_ext.sofor metrics/logs/traces; loadlibdbhealth_ext.sofor health; they are separate products. - Scheduled samples record db-level gauges only (pages, freelist,
bloat, file/WAL sizes, memory): connection-scoped cache counters
measured from an idle sampler connection would be noise dressed as
data. The interactive
'sample'command (your app's heartbeat, phosphor's live console) still records full counter deltas and the hit ratio; the report's advice says exactly that when ratio data is missing. - The F2/F3 arguments pass through:
USING dbhealth(retention='30d')works. - Under sqld, collection goes through the front door — cron is
REQUIRED. sqld holds databases open in a long-lived process, but it
also virtualizes the WAL for replication, so an out-of-band sampler
connection could desync the replication log. The embedded scheduler
therefore refuses files under a
*.sqld/directory: with sqld, nothing collects unless you sample through the interface. The whole collector is one crontab line (see below).
Put the dbhealth extension in sqld's trusted extensions directory and restart:
cp libdbhealth_ext.so ext-dir/
(cd ext-dir && sha256sum *.so > trusted.lst)   # regenerate, both .so if
                                               # you also load timeless
sqld --db-path your.sqld --extensions-path ./ext-dir ...
Create the table once (any client): CREATE VIRTUAL TABLE dbhealth USING dbhealth; — then install the collector. This exact line is
tested against a real sqld; copy it verbatim, adjusting only host:port:
# m h dom mon dow  command
* * * * * /usr/bin/curl -sS -m 10 -o /dev/null http://127.0.0.1:8880/v3/pipeline -d '{"requests":[{"type":"execute","stmt":{"sql":"INSERT INTO dbhealth(dbhealth) VALUES (?1)","args":[{"type":"text","value":"sample"}]}},{"type":"close"}]}'
Why it looks the way it does — each choice avoids a classic cron trap:
?1bind instead of'sample'in the SQL — no nested single quotes, so the shell quoting is trivial and un-breakable.- No
%anywhere — cron treats%as a newline; this line has none to escape. - Full
/usr/bin/curlpath — cron's PATH is minimal. -m 10— a hung server can't pile up curl processes.-sS -o /dev/null— silent on success, real errors still reach cron's mail/log.
Authenticated servers (Turso-style): add
-H "Authorization: Bearer $TOKEN" before -d.
One behavior to expect: each tick lands on one of sqld's pooled worker connections. The FIRST sample on any given connection records the db-level gauges (no delta baseline yet); repeat ticks on warmed connections add the cache-counter deltas and hit ratio. With a small pool and a one-minute cadence, full coverage arrives within minutes — and those ratios describe REAL workers serving real traffic, which is better data than any background thread could produce.
SQLite is the most widely deployed database in the world and almost none of it is monitored. There's no server process to attach an agent to, so the entire monitoring category (PMM, pganalyze, RDS Performance Insights) simply skipped it. Embedded apps ship, then: databases bloat, freelists grow, queries quietly degrade to full scans as data distribution shifts, WAL files balloon under checkpoint starvation — and the first signal anyone gets is "the app feels slow," months later, with zero history to diagnose from.
Storing health history in the db was always possible; nobody did it because at plain-table rates it reads as self-inflicted bloat. That objection is what the timeless compression removes: health metrics are the friendliest data the metrics engine will ever see — regular cadence, slowly-changing values, the ~200x compression class. A year of 50 series sampled every 60 seconds is roughly 5–25 MB (0.23–1 B/point observed range for friendly data). The monitoring costs less than one day of the logs it helps explain.
Two properties fall out for free by riding the existing engine:
- The history travels with the file. Copy the db for a support ticket and the performance history comes along. A device mailed back from the field carries its own black box.
- libSQL replication ships it upstream. A fleet of embedded replicas replicating to a primary is a fleet reporting health to a central server — with no agent, no scrape endpoint, no pipeline. Nothing else in the SQLite world can say that sentence.
- Passive. No background threads, no timers. Sampling happens when the
app says
'sample'— the cadence loop stays external (app timer, cron via CLI, sqld request), exactly like the Prometheus scrape loop. - It's just SQL. The read surface is identical to
timeless_metrics; every dashboard/query pattern from the User's Guide applies. - Honest limits, documented. Per-connection counter scope, observer effect, and compile-flag-dependent sources are stated, not hidden.
- Don't fight the host. No global hooks in v1 (sqld's replication owns the WAL hook; apps may own trace/commit hooks). Sampling reads counters; it does not intercept anything.
-- zero-config create; optional args shown with defaults
CREATE VIRTUAL TABLE dbhealth USING timeless_health(flush_every=1);

INSERT INTO dbhealth(dbhealth) VALUES ('sample');      -- v1: counters + pragmas + file sizes
INSERT INTO dbhealth(dbhealth) VALUES ('flush');       -- inherited lifecycle commands
INSERT INTO dbhealth(dbhealth) VALUES ('compact');
INSERT INTO dbhealth(dbhealth) VALUES ('prune:<ts>');  -- seconds, like metrics
Row shape is exactly timeless_metrics: (name TEXT, ts INTEGER /*sec*/, value REAL, labels TEXT). Shadow tables follow the same pattern
(dbhealth_chunks, dbhealth_series, dbhealth_meta).
'sample' appends one point per metric below, timestamped now, then flushes
opportunistically every flush_every samples (see Durability).
CREATE VIRTUAL TABLE also creates three ordinary SQL views (and DROP TABLE removes them), so evaluating health requires no DBA knowledge:
<t>_report— the headline: one row per health check withstatus(ok | warn | attention | no data), a human-readable value, and one concrete piece of advice; sorted worst-first. Seven checks in v1: sampling freshness,cache_hit_ratio_24h,bloat,wal_size,cache_spills_24h,stmt_memory,db_growth_7d. Thresholds are deliberately visible in the view SQL (.schema <t>_report): opinionated but inspectable, and users can define their own variants. A fresh table renders a complete report — every check degrades to ano datarow with onboarding advice, never a missing row or a NULL.<t>_now— latest value per series plus its age in seconds.<t>_trends— per-series daily min/avg/max over the last 7 days.
Because the table is a timeless_metrics table underneath, CREATE also
installs the two metric companions from the
observability schema: timeless_<t>_series
(every retained series with span and point/chunk counts, a view over the
timeless_series table-valued function) and timeless_<t>_latest
(newest sample per series with a human-readable timestamp). The dbhealth
extension registers timeless_series alongside its own modules so those
views resolve on a dbhealth-only connection. That matters beyond
convenience: SQLite re-validates every view in the schema on
ALTER TABLE ... RENAME COLUMN, DROP COLUMN, and RENAME TO, so an
unresolvable view would block schema changes to every table in the
database. (Any connection without the extension loaded cannot resolve
views over the dbhealth virtual table either — load the extension, or
set PRAGMA legacy_alter_table=ON for that one statement, before
altering schema from a plain sqlite3 shell.)
The vtabs are marked SQLITE_VTAB_INNOCUOUS (the FTS5 precedent) so the
views work under the CLI's default trusted_schema=off — this applies to
all four timeless modules, so users can build their own views over
metrics/logs/traces too.
Implementation notes that cost a debugging round, recorded so they aren't
relearned: SQLite's printf() renders NULL arguments as 0, so every
formatted value needs a CASE ... IS NULL guard, and a FROM (SELECT ... WHERE ...) subquery over an empty table yields zero rows (dropping the
whole UNION ALL branch), so single-value checks must use scalar
subqueries (SELECT (SELECT ...) AS v) to guarantee one row.
Everything below is available from inside a loadable extension on the host
connection handle, via libsqlite3-sys FFI (sqlite3_db_status,
sqlite3_status64, sqlite3_db_filename + stat()) and pragmas executed
re-entrantly (the FTS5-pattern SQL the engines already use). No hooks, no
compile-flag dependencies, cost ≈ a few dozen microseconds plus two pragma
queries.
| series name | source | kind | what it tells you |
|---|---|---|---|
cache_hits |
DBSTATUS_CACHE_HIT |
delta/interval | page cache efficiency numerator |
cache_misses |
DBSTATUS_CACHE_MISS |
delta/interval | denominator; misses = disk reads |
cache_hit_ratio |
derived at sample time | gauge 0–1 | the headline number; NULL if no traffic in interval |
cache_writes |
DBSTATUS_CACHE_WRITE |
delta/interval | dirty-page writebacks |
cache_spills |
DBSTATUS_CACHE_SPILL |
delta/interval | cache too small for txns → mid-txn spills |
cache_used_bytes |
DBSTATUS_CACHE_USED |
gauge | current pager cache memory |
schema_used_bytes |
DBSTATUS_SCHEMA_USED |
gauge | schema memory (growth = schema churn) |
stmt_used_bytes |
DBSTATUS_STMT_USED |
gauge | prepared-stmt memory (leak detector) |
lookaside_hits |
DBSTATUS_LOOKASIDE_HIT |
delta/interval | small-alloc fast path health |
lookaside_miss_full |
DBSTATUS_LOOKASIDE_MISS_FULL |
delta/interval | lookaside pool exhaustion |
memory_used_bytes |
sqlite3_memory_used() |
gauge | process-wide SQLite heap |
db_pages |
PRAGMA page_count |
gauge | file size in pages |
freelist_pages |
PRAGMA freelist_count |
gauge | dead space |
bloat_ratio |
derived: freelist/page_count | gauge 0–1 | when to incremental_vacuum |
db_file_bytes |
stat(db file) |
gauge | on-disk size, main file |
wal_file_bytes |
stat(db-wal) |
gauge | checkpoint starvation detector (0 if absent) |
Counter semantics: sqlite3_db_status counters are cumulative per
connection. 'sample' stores deltas since the previous sample on this
vtab (state held in the shared engine), because deltas are what you chart
and they survive connection identity questions better than raw cumulatives.
The reset flag is never passed — dbhealth must not disturb counters another
component may read.
Labels: {"db":"main"} in v1 (ATTACH-ed database sampling is a v2 question).
Requires small read-only accessors added to timeless-core engines; worth a
minor version on its own.
| series name | labels | what |
|---|---|---|
timeless_buffered |
{"table":...} |
points/entries/spans in memory (crash-loss exposure, right now) |
timeless_chunks / timeless_blocks |
{"table":...} |
fragmentation → when to compact/optimize |
timeless_stored_bytes |
{"table":...} |
compressed on-disk footprint |
timeless_stored_points |
{"table":...} |
total durable points |
timeless_last_flush_ms |
{"table":...} |
flush latency, most recent |
The db monitors the monitor. A dashboard can alert on "buffered points high and rising" — the exact precursor of data loss on crash — using the store itself.
Statement-level truth: which queries full-scan, sort, or build transient
indexes. SQLite has no global index-usage counters — but per-statement
counters aggregated by normalized SQL are more actionable than any global
rate ("SELECT … WHERE customer_email = ? full-scanned 4,112 times today"
names the missing index directly).
| series name | source | notes |
|---|---|---|
stmt_fullscan_steps |
sqlite3_stmt_status(FULLSCAN_STEP) |
labels {"query":"<normalized, truncated, hashed>"} |
stmt_sorts |
…(SORT) |
ORDER BY without index |
stmt_autoindex |
…(AUTOINDEX) |
SQLite built a transient index — the loudest "add an index" signal |
stmt_reprepares |
…(REPREPARE) |
schema churn / cache invalidation |
stmt_elapsed_ns |
sqlite3_trace_v2(PROFILE) |
latency; enables slow-query series |
Design constraints that make this v2, not v1:
sqlite3_trace_v2is a singleton per connection — installing it can clobber a host app's tracer. Must save/chain the prior callback, and be opt-in.sqlite3_normalized_sqlrequiresSQLITE_ENABLE_NORMALIZE, which most builds lack; fallback is our own literal-stripping normalizer (bounded, hash-suffixed labels to cap cardinality).- Label cardinality is the classic monitoring foot-gun; cap distinct query
labels (e.g. top-N by cost per interval, rest as
{"query":"_other"}). - Overhead is per-statement, not per-sample; it must be benchmarked and
published as current evidence before it defaults anywhere.
RESULTS.mdis a historical baseline archive, not that future release gate.
Also v2, cheap but compile-flag-gated: dbstat-derived per-table/index page
counts and fill factor ({"object":"idx_orders_email"}), guarded by a
runtime pragma_module_list check.
The metrics engine's default auto-flush (4096 points/series) would hold ~68 days of 1-minute samples in memory — useless for the crash-forensics case, where the samples leading up to the crash are the valuable ones. Options:
- (a) Flush every sample (
flush_every=1). Max durability; produces 1-point chunks → chunk-count bloat, leans oncompact. CHOSEN AS DEFAULT during implementation — see below. - (b)
flush_every=Nsamples. Bounded loss window (N minutes at 1-min cadence), fewer/larger chunks, 29 µs/sample measured. Recommended for long-lived apps sampling on a timer. - (c) Piggyback on host commits (flush health buffer when the host app commits anyway). Requires the commit hook — singleton, conflict-prone, deferred to v2 as an opt-in.
Why the default flipped from the draft's 20 to 1: the cron pattern —
sqlite3 db ".load …" "INSERT …('sample')", process exits — is a headline
use case, and with any N > 1 it loses every sample silently: the buffer
dies with the process, and each fresh process restarts the count at 0,
never reaching N. A default must not silently destroy data in a documented
usage pattern. The cost is real but bounded: 2.9 ms/sample (commit I/O)
and one-point chunk confetti that 'compact' collapses to 0.23 B/point —
both measured, both invisible at cron cadences. Long-lived apps opt into
N > 1 and get the 29 µs path with a consciously chosen loss window.
Observer effect stated honestly: each flush dirties pages and (in WAL mode)
appends frames — and it is itself visible in cache_writes /
wal_file_bytes, so dbhealth measures its own overhead.
sqlite3_db_status counters are per connection; pragmas and file sizes
are db-global. 'sample' reports the calling connection's counters — in a
single-connection embedded app (the primary audience) that's the whole
truth. Under sqld's pool it's a sampled connection's view: fine for trends
(hit ratios converge), documented as a limit. The process-global registry
already shares one engine per (db, table), so series identity and delta
state stay consistent regardless of which connection issues 'sample'.
Cross-connection aggregation (registry-tracked handles, summed counters) is
a v3 investigation, not a v1 promise.
- No hooks (
wal_hookis owned by sqld replication; commit/trace hooks are host-app territory). v1 is strictly read-and-store. - No alerting/rules engine. Thresholds are
SELECTs the app runs; the example queries are the "alert rules." - No automatic sampling. The passive contract holds; put
'sample'in the loop you already have (the same cron that curls Prometheus scrapes, the app's heartbeat timer, a sqld client).
-- Cache health, last 24h, 5-min resolution
SELECT (ts/300)*300 AS t, round(avg(value),3)
  FROM dbhealth WHERE name='cache_hit_ratio' AND ts > unixepoch()-86400
 GROUP BY t ORDER BY t;

-- Is the db bloating? (vacuum decision, from data, not vibes)
SELECT max(value) FROM dbhealth
 WHERE name='bloat_ratio' AND ts > unixepoch()-7*86400;

-- Checkpoint starvation: WAL growing across days
SELECT (ts/3600)*3600 AS hour, max(value)/1048576.0 AS wal_mb
  FROM dbhealth WHERE name='wal_file_bytes' AND ts > unixepoch()-3*86400
 GROUP BY hour HAVING wal_mb > 16 ORDER BY hour;

-- v2: which queries want an index, ranked
SELECT json_extract(labels,'$.query') AS q, sum(value) AS scans
  FROM dbhealth WHERE name='stmt_fullscan_steps' AND ts > unixepoch()-86400
 GROUP BY q ORDER BY scans DESC LIMIT 10;
All of it works over sqld/HTTP unchanged (SQLD.md) — a Grafana JSON-datasource panel away from being an actual PMM screen.
| phase | scope | acceptance |
|---|---|---|
| v1 ✅ (2026-07-27) | timeless_health vtab wrapping the metrics engine; 'sample' with the v1 inventory; flush_every; lifecycle commands |
DONE — cli.sh section 22 (baseline/delta semantics, stat oracle, cache torture, rollback, prune, loss-window honesty); 29 µs/sample buffered, 2.9 ms durable; 0.23 B/point after compact. |
| v1.5 | meta-telemetry via new timeless-core accessors |
buffered-points series proven against a deliberate large buffer + crash |
| v2 | 'sample:statements' (trace chaining, normalizer, cardinality cap), dbstat gauges, commit-piggyback flush |
overhead benchmark published; host-tracer chaining test; cardinality cap test |
| v3 | cross-connection aggregation; ATTACH-ed db sampling; fleet patterns (replication rollup queries) | exploratory — needs design notes of its own |
Test posture matches the repo: every metric asserted against an independent
source where one exists (e.g. db_file_bytes vs actual stat;
cache_misses forced via PRAGMA cache_size=2 torture), oracle-style
mirror where it doesn't.
Delta state on reopenANSWERED in v1: first sample on a connection emits gauges only and records the baseline; deltas start at the second sample. Persisting cumulatives in_metawould be wrong, not just unnecessary —sqlite3_db_statuscounters are per-connection and reset to zero with each new connection, so cross-process deltas are meaningless by construction. Consequence, now documented: the cron/CLI pattern yields the 9 db-global gauges; connection-counter deltas andcache_hit_ratiorequire a long-lived connection.sqldWAL-hook interaction — v1 takes no hooks, but verify the replication logger's counters aren't perturbed by our pragma reads (expected no; test anyway).- Sampling ATTACH-ed databases —
sqlite3_db_statusis per-connection, pragmas are per-schema; worth{"db":"aux"}labels in v2? memory_highwaterreset — reading with reset gives per-interval peak but perturbs other readers; without reset it's monotone and dull. Lean: skip in v1.- Name for the Grafana story — a ready-made dashboard JSON in
tools/would make the pitch land ("import this, point it at sqld"). In scope for v1 docs or separate?
- 2026-07-27 — Name: dbhealth (module
timeless_health, conventional table namedbhealth). Continues a lineage: the author's first software was EdgeHealth, monitoring the coax network edge. Same instinct, thirty years on — put the monitoring where the thing lives. - 2026-07-27 — v1 is hook-free and passive; statement profiling is opt-in v2. Rationale: singleton-hook conflicts (sqld replication, host tracers) and the repo's no-daemons contract.
- 2026-07-27 — Storage rides the existing metrics engine unchanged; no new codec work. Health data is the friendly-compression case the engine already excels at. (Confirmed by measurement: 0.23 B/point after compact.)
- 2026-07-27 (implementation) — Default
flush_everyis 1, not the draft's 20. Any higher default silently loses every sample in the cron/CLI pattern (buffer dies with the process; a fresh process never reaches sample N). Durability-by-default wins; long-lived apps opt into N > 1 for the 29 µs path. - 2026-07-27 (implementation) — HealthTab WRAPS MetricsTab (repr(C), wrapped vtab first) rather than duplicating it: reads, pushdown, transactions, savepoints, Tier 1/2/Prometheus ingest, and DROP are all inherited; dbhealth adds only 'sample' and the flush_every arg.
- 2026-07-27 — v2 statement profiling explicitly deferred (author decision): v1 ships hook-free; revisit only with the trace-chaining and cardinality-cap design in hand.
- 2026-07-28 — v2: collection is automatic (author decision, after
using it). The passive design was defensible engineering and wrong
product: no monitoring tool ever shipped that collects nothing by
default. A per-(file, table) sampler thread with its own connection
starts at create and at every re-open;
every=0keeps the passive mode. Scheduled samples are db-level gauges only (an idle sampler connection's cache counters are not your application's cache counters); in-connection samples remain the source of ratio/delta series. - 2026-07-28 — dbhealth is a standalone extension
(
libdbhealth_ext.so, crates/dbhealth-ext): separate artifact, shared engine source. Entry points in timeless-ext are feature-gated (entrypoints, default on) so the two .so files never fight oversqlite3_extension_init. - 2026-07-28 — Branch reconciliation. dbhealth v1 was built on
agent/r1-r8-correctness-0.1.1while a parallel line advanced master to 0.2.0 without it; 0.2.0 released dbhealth-less and a rebuild would have silently dropped the module from the .so. Ported onto master (this line), adapted to the 0.2.0 internals (table_args, F2 retention, F3 rollups — which dbhealth now forwards). Lesson recorded: feature branches merge before releases cut, and parallel sessions name their branches to each other. - 2026-07-27 — Companion views ship with the table (
_now,_report,_trends): the raw series are the truth, the views are the judgment — "is my database healthy?" must not require DBA knowledge. In-extension (not a docs snippet) so they're zero-config, version with the metric inventory, and work over sqld. Required marking all timeless vtabs INNOCUOUS (FTS5 precedent) for trusted_schema=off.